Deformation Characteristics Evaluation of Modified
Equal Channel Angular Pressing Processes
Seung Chae Yoon
1;2, Anumalasetty Venkata Nagasekhar
3, Ji Hoon Yoo
4,
Mohamed Ibrahim Abd El Aal
4;5, Majid Vaseghi
4;6and Hyoung Seop Kim
4;*1Center for Advanced Aerospace Materials, Pohang University of Science and Technology (POSTECH),
Pohang, 790-784, Korea
2Research & Development Team, Hyundai HYSCO, Chungnam, 343-831, Korea
3ARC Centre of Excellence for Design in Light Metals, Materials Engineering, The University of Queensland,
St Lucia, Brisbane, QLD-4072, Australia
4Department of Materials Science and Engineering, Pohang University of Science and Technology (POSTECH),
Pohang, 790-784, Korea
5
Mechanical Design and Production Department, Faculty of Engineering, Zagazig University, Zagazig, Egypt
6Department of Materials Science and Engineering, Sharif University of Technology, Tehran, 11155-9466, Iran
In current studies, equal channel angular pressing process (ECAP) and modified ECAP processes are simulated under ideal conditions to compare the deformation characteristics. The deformation behaviour is more complicated and the strain induced during the processes is highly non-uniform in the modified ECAP processes except in the equal channel multi-angular pressing (ECMAP) process with Route C. The strain homogeneity is more of a possibility with ECAP and ECMAP with Route C processes. The deformation stress state is widely distributed in nature in modified ECAP processes than in conventional ECAP. In addition, the load requirements are also higher in modified ECAP processes with that of the ECAP process. [doi:10.2320/matertrans.MB200906]
(Received July 16, 2009; Accepted September 1, 2009; Published October 21, 2009)
Keywords: equal channel angular pressing (ECAP), severe plastic deformation (SPD), T-ECAP, cross-ECAP, equal channel multi-angular pressing (ECMAP), finite element analysis
1. Introduction
Nanostructured and ultrafine grained metallic materials have received great interest in the last decades because of their unique mechanical and physical properties and high performance.1–4)For fabrication of bulk ultrafine grained and nanostructured materials, equal channel angular pressing (ECAP) is the most promising severe plastic deformation (SPD) processing technique.5,6) In addition, the ECAP process has been used to compact powders7,8)and mechanical property enhancement of tubular materials.9,10) Various modifications to the ECAP process: equal channel multi angular pressing (ECMAP),11)T shaped ECAP (T-ECAP),12) Cross shaped ECAP (Cross-ECAP),13)rotary die ECAP,14,15) ECAP combined with rolling: cold rolling and continuous ECAP,16) ECAP combined with forward extrusion: ECAP-FE,17) and FE-ECAP18) were developed to enhance the efficiency of the ECAP process. The deformation behaviour and strain homogeneity of these processes were also analysed by using finite element simulations.15,19–30) ECAP has been applied to many materials, such as Al 6000 series alloys31) and steels.32)
However, very little work has been reported by comparing the deformation behaviour and strain homogeneity of the modified ECAP processes with that of the ECAP. In addition, the comparison has been made only between two
process-es.26,27)No systematic comparison of deformation
character-istics of the modified ECAP processes with that of ECAP process has been reported until today. In addition, the knowledge of deformation characteristics and load
require-ments of the modified ECAP process are essential to figure out the efficiency and industrial applicability of the modified processes in comparison to the ECAP process. Hence, in current studies a more detailed and systematic evaluation of deformation characteristics and load requirements is made between the modified ECAP processes: Cross-ECAP, T-ECAP, ECMAP-Route A, and ECMAP-Route C and ECAP process.
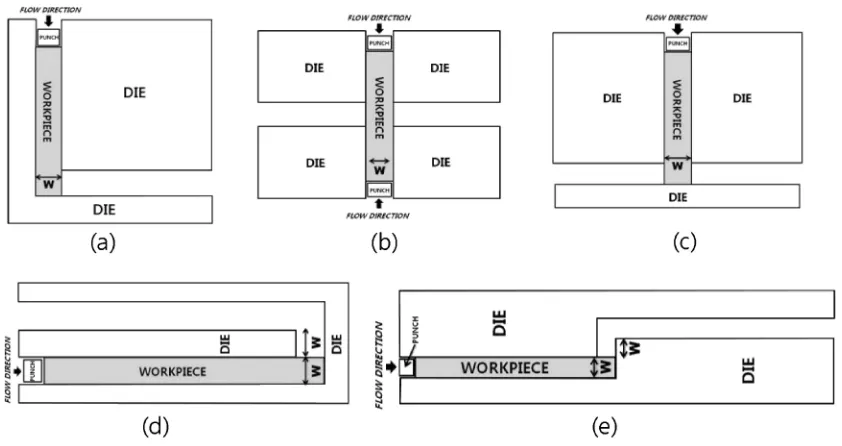
Figure 1 shows the schematics of the ECAP and modified ECAP processes. The deformation takes place in different stages in all these processes. More details of the deformation stages of all these processes have been explained elsewhere.
2. Finite Element Analysis
An isothermal two-dimensional plane strain finite element simulations of the ECAP and modified ECAP processes were carried out by using the commercial rigid-plastic software DEFORM 2D.33)It is well known that the material behaviour and frictional conditions have measurable influence on the deformation characteristics of the ECAP process.34–36) How-ever, it is necessary to avoid the influence of such additional effects while evaluating the deformation characteristics of different ECAP processes. Hence, all simulations were carried out under ideal conditions (rigid-perfect plastic material ¼100MPa, with frictionless contact between the die and workpiece) with a workpiece of1010mm2in cross sectional area. Because of the rigid-plastic property, the material always yields with strain whatever the strain value is. The length of the workpiece of 60 mm was considered for ECAP, Cross-ECAP, and T-ECAP processes, and 100 mm was considered for ECMAP process. Die and punch were *Corresponding author, E-mail: [email protected]
Special Issue on Severe Plastic Deformation for Production of Ultrafine Structures and Unusual Mechanical Properties: Aiming Breakthrough in Materials Development
modelled as rigid. Workpiece was modelled with four node plane strain elements. All simulations were performed with a speed of 1 mm/s.
3. Results and Discussion
The deformation characteristics of the various modified ECAP processes are compared with that of the conventional ECAP process in the following aspects: overall deformation/ flow behaviour, stress-strain variations, and strain homoge-neity. The load requirements of the modified ECAP processes are also compared with that of the ECAP process.
The overall deformation/flow behaviour of the ECAP and modified ECAP processes is analysed through effective strain contour plots shown at 60% and at the end of the deformation
in Figs. 2 and 3, respectively. The effective strain contour plots at 60% of the deformation in Fig. 2 indicate the deformation behaviour in steady state region of the deforma-tion process. The effective strain contour plots at the end of the deformation, in Fig. 3, indicate the overall deformation behaviour of the workpiece and an effective strain induced in the workpiece.
The effective strain contour plots in Fig. 2 clearly show that the deformation is almost simple shear in ECAP and ECMAP processes. From Figs. 2(a) and 3(a), it can be observed that the deformation is smooth and uniform across the cross-section of the workpiece in ECAP. In Cross-ECAP, Figs. 2(b) and 3(b), the deformation is non-uniform and localized at the centre of the workpiece. In T-ECAP, Figs. 2(c) and 3(c), the deformation is more complex and non-uniform across the cross-section of the workpiece. In
Fig. 1 Schematics of the (a) ECAP, and modified ECAP processes: (b) Cross-ECAP, (c) T-ECAP, (d) ECMAP-Route A, and (e) ECMAP-Route C.
Fig. 2 Effective strain contour plots of the (a) ECAP, (b) Cross-ECAP, (c) T-ECAP, (d) ECMAP-Route A, and (e) ECMAP-Route C processes at 60% of the deformation.
[image:2.595.87.508.70.293.2] [image:2.595.310.541.340.510.2] [image:2.595.56.285.342.545.2]ECMAP-Route A, Figs. 2(d) and 3(d), the deformation is smooth but non-uniform. In ECMAP-Route C, Figs. 2(e) and 3(e), the deformation is smooth and uniform.
The corner gap/dead zone formation is more common in ECAP and it has some adverse effects on the deformation behaviour.34–36)However, in current studies no corner gap is observable with ECAP, Fig. 2(a), due to the perfectly plastic material behaviour. In modified ECAP processes, Figs. 2(b)– (e), no corner gap formation is observable. The same was observed even under realistic conditions in modified ECAP processes.25–27)
The shape of the front end of workpiece at the end of the deformation is more uniform in ECAP and Cross-ECAP, Figs. 3(a) and (b), and closer to uniform in ECMAP, Figs. 3(d) and (e). Whereas, it is non-uniform in T-ECAP, Fig. 3(c). In addition, large upward bending of the workpiece is also observable in T-ECAP.
The effective strain contour plots in Fig. 3 show the strain induced in the workpiece at the end of the deformation process. The maximum and minimum strain points induced in the workpiece are indicated by square and triangle symbols, respectively, in the strain contour plots of Fig. 3. The strain induced in the workpiece is higher with modified ECAP processes in comparison to ECAP process. In addition, the workpiece processed through T-ECAP of Fig. 3(c), and ECMAP-Route A of Fig. 3(d), received more non-uniform strain with a maximum of about 4 and minimum of almost 0. To analyse the strain homogeneity of the processes, the effective strain variations across the width ‘A-B’ of the workpiece cross section are plotted in Fig. 4. The width ‘A-B’ in each process is located in Fig. 3. The strain induced is more non-uniform in T-ECAP, with large variation of effective strain from 3.7 to 1.4 across the width ‘A-B’. In Cross-ECAP process, the effective strain varied from 2.5 to 1.2 from centre to the surface of the workpiece. In ECMAP with Route A and Route C, the strain varied from 3.4 to 2.2 and 2.6 to 2.9 across ‘A-B’, respectively. In ECAP, the strain varied from 1.26 to 1 across A-B. Thus, the effective strain difference across the width ‘A-B’ is less in ECAP and ECMAP-Route C and hence it is possible to obtain strain homogeneity in these processes. The strain inhomogeneity in
the Cross-ECAP and T-ECAP process is due to localized deformation. In ECMAP-Route A, the strain inhomogeneity is due to the effects of die geometry and strain hardening characteristics. The strain inhomogeneity will generate non-uniform mechanical properties and microstructure in the deformed materials. The influence of strain homogeneity on the mechanical properties of ECAP processed materials is explained elsewhere.37)
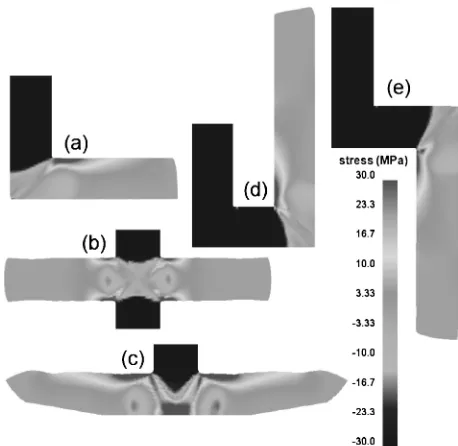
The knowledge of stress state and load requirements is essential to design sound tools for any deformation processes. The stress state of the modified deformation processes is analysed through maximum principal stress contour plots shown in Fig. 5. Stresses are tensile in nature in the deformation zone and after exiting from the deformation zone. More severe tensile stresses are generated in the Cross-ECAP and T-Cross-ECAP processes in comparison to Cross-ECAP and ECMAP processes. The more severe tensile stresses gen-erated in the modified ECAP processes may generate cracks on the surface of the workpiece during multiple passes.
The load-displacement curves of different ECAP-based processes are shown in Fig. 6. The load requirements are higher in modified ECAP processes than that in the ECAP process due to higher strain developed in the modified ECAP processes. It should be remembered that the load levels in metal forming are governed by geometry, stress-strain curve, stress-strain rate, temperature, friction, etc. In this study, the material is rate-insensitive and perfect-plastic without strain hardening, hence load is mainly governed by a geometry and friction. It is clear that the conventional ECAP needs the lowest load (1180 N). The load (1420 N) in T-ECAP is higher than that in ECAP, due to the friction effect: relative area of the contact between the die and workpiece is higher in T-ECAP than in ECAP. The load in Cross-ECAP is highest because it has double action punches, i.e. the load is almost double of the ECAP. The ECMAP shows two stages, because of the double angular deforming
0 1 2 3 4 5 6 7 8 9 10
1.0 1.5 2.0 2.5 3.0 3.5 4.0
Effective Strain
Distance, d/mm CECAP ECAP ECMAP_RA ECMAP_RC TECAP
Fig. 4 Equivalent plastic strain variations across distance A-B of different ECAP processes. Locations of A-B of different ECAP processes are shown in Fig. 3.
[image:3.595.311.540.70.293.2] [image:3.595.64.275.71.238.2]zones. Thus, the stresses generated and load requirements are higher in modified ECAP processes in comparison to the ECAP process.
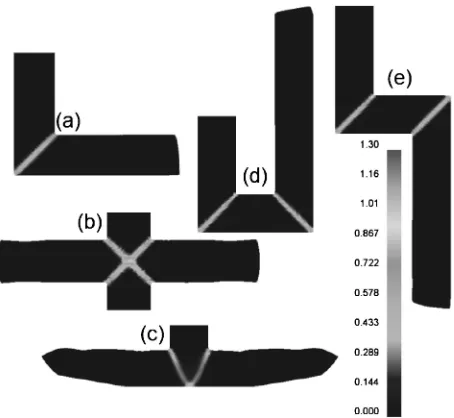
The strain rate contour plots of ECAP and modified ECAP processes are shown in Fig. 7. The strain rate contour plots of ECAP process, Fig. 7(a), show that the deformation is simple almost shear and the strain rate is higher at the corners where two channels meet. In Cross-ECAP, Fig. 7(b), the deforma-tion is highly localized along the shear line of 45. The stain
rate is higher at the four corners and central area where four channel meet. In T-ECAP, Fig. 7(c), the deformation is highly localized along the shear line of 60. The strain rate is
higher at the corner regions where two channels meet and at the bottom region. In ECMAP with Route A and Route C, Figs. 7(d) and 7(e), the deformation is almost simple shear. However, the strain rate is very high at the inner corners and low at the outer corners with ECMAP-Route A, see Fig. 7(d). In ECMAP-Route C, Fig. 7(e), the strain rate is higher at both the corners where two channels meet, similar to ECAP.
From a broader prospective, it can be understood that the deformation behaviour is more complicated in modified ECAP processes than that of the ECAP process. The induced strain is also higher in modified ECAP processes. However, the strain homogeneity is possible only through ECAP and ECMAP-Route C processes. The deformation stress state is widely distributed in nature in modified ECAP processes than in conventional ECAP. However, the stress intensity is higher in modified ECAP processes due to larger deformation. The load requirements are also higher in modified ECAP processes.
4. Conclusions
Deformation characteristics of modified ECAP processes: Cross-ECAP, T-ECAP, ECMAP with Route A and Route C are compared with that of the ECAP process by carrying out finite element simulations under ideal conditions. The simu-lated results show that the deformation is more complicated and induced strain is higher in modified ECAP processes in comparison to the ECAP process. However, the induced strain is highly non-uniform and localized in the modified ECAP processes except in ECMAP-Route C. The deforma-tion stress state is widely distributed in nature in modified ECAP processes than in conventional ECAP. In addition, the load requirements are also higher in modified ECAP processes with that of the ECAP process.
Acknowledgements
Australian Research Council (ARC) Centre of Excellence for Design in Light Metals is funded by the Australian Government. This research was supported by a grant from the Center for Advanced Materials Processing (CAMP) of the 21st Century Frontier R&D Program funded by the Ministry of Knowledge Economy, Republic of Korea. The calcula-tions were performed using the supercomputing resources of the Korea Institute of Science and Technology Information (KISTI).
REFERENCES
1) R. Z. Valiev, I. V. Alexandrov, Y. T. Zhu and T. C. Lowe: J. Mater. Res.17(2002) 5–8.
2) H. S. Kim: Scr. Mater.39(1998) 1057–1061.
3) H. S. Kim, C. Suryanarayana, S.-J. Kim and B. S. Chun: Powder Metall.41(1998) 217–220.
4) H. S. Kim and Y. Estrin: Appl. Phys. Lett.79(2001) 4115–4117. 5) Y. H. Jang, S. S. Kim, S. Z. Han, C. Y. Lim and M. Goto: Metal. Mater.
Inter.14(2008) 171–175.
6) R. Z. Valiev and T. G. Langdon: Prog. Mater. Sci.51(2006) 881–981. 7) A. V. Nagasekhar, Y. Tick-Hon and K. S. Ramakanth: Appl. Phys. A85
(2006) 185–194.
8) A. V. Nagasekhar, Y. Tick-Hon, R. K. Guduru and K. S. Ramakanth: Phys. C466(2007) 174–180.
9) A. V. Nagasekhar, U. Chakkingal and P. Venugopal: J. Mater. Proc. Tech.173(2006) 53–60.
10) A. V. Nagasekhar, U. Chakkingal and P. Venugopal: J. Manu. Proc.8
(2006) 112–120.
11) Y. Iwahashi, Z. Horita, M. Nemoto and T. G. Langdon: Acta Mater.46
(1998) 3317–3331.
12) V. S. Rao, B. P. Kashyap, N. Prabhu and P. D. Hodgson: Mater. Sci. Eng. A486(2008) 341–349.
0 10 20 30 40 50
0 500 1000 1500 2000 2500
Load, F/N
Displacement, d/mm
CECAP ECAP ECMAP_RA ECMAP_RC TECAP
Fig. 6 Load-displacement curves of different ECAP processes.
[image:4.595.57.281.68.239.2] [image:4.595.56.283.280.489.2]13) C. Y. Chou, S. L. Lee and J. C. Lin: Mater. Chem. Phys.107(2008) 193–199.
14) A. Ma, Y. Nishida, K. Suzuki, I. Shigematsu and N. Saito: Scr. Mater.
52(2005) 433–437.
15) S. C. Yoon, M. H. Seo, A. Krishnaiah and H. S. Kim: Mater. Sci. Eng. A490(2008) 289–292.
16) J. C. Lee, H. K. Seok and J. Y. Suh: Acta Mater.50(2002) 4005–4019. 17) M. H. Paydar, M. Reihanian, E. Bagherpour, M. Sharifzadeh, M.
Zarinejad and T. A. Dean: Mater. Lett.62(2008) 3266–3268. 18) M. H. Paydar, M. Reihanian, E. Bagherpour, M. Sharifzadeh, M.
Zarinejad and T. A. Dean: Mater. Design30(2009) 429–432. 19) H. S. Kim, M. H. Seo and S. I. Hong: J. Mater. Proc. Technol.113
(2001) 622–626.
20) S. C. Baik, Y. Estrin, H. S. Kim, R. Hellmig and H.-T. Jeong: Mater. Sci. Forum408–412(2002) 697–702.
21) H. S. Kim: Mater. Sci. Eng. A328(2002) 317–323.
22) A. Rosochowski and L. Olejnik: J. Mater. Proc. Tech.125–126(2002) 309–316.
23) S. C. Baik, Y. Estrin, R. J. Hellmig, H. T. Jeong, H.-G. Brokmeier and H. S. Kim: Z. Metallkd.94(2003) 1189–1198.
24) H. S. Kim, M. H. Seo and S. I. Hong: J. Mater. Proc. Technol.130–131
(2004) 497–503.
25) A. V. Nagasekhar, Y. Tick-Hon and S. Li: Int. J. Nanosci.4(2005) 745–751.
26) A. V. Nagasekhar and H. S. Kim: Metals Mater. Inter. 14 (2008) 565–568.
27) A. V. Nagasekhar and H. S. Kim: Comp. Mater. Sci.43(2008) 1069– 1073.
28) W. Wei, W. Zhang, K. X. Wei, Y. Zhong, G. Cheng and J. Hu: Mater. Sci. Eng. A516(2009) 111–118.
29) J.-H. Han, H.-J. Chang, K.-K. Jee and K. H. Oh: Metals Mater. Inter.15
(2009) 439–445.
30) S. C. Yoon, A. V. Nagasekhar and H. S. Kim: Metals Mater. Inter.15
(2009) 215–219.
31) B. S. Moon, H. S. Kim and S. I. Hong: Scr. Mater.46(2002) 131– 136.
32) H. S. Kim, W. S. Ryu, M. Janecek, S. C. Baik and Y. Estrin: Advanced Eng. Mater.7(2005) 43–46.
33) DEFORM 2D, Scientific Forming Technologies Corporation Colum-bus, OH (1997).
34) H. S. Kim, M. H. Seo and S. I. Hong: Mater. Sci. Eng. A291(2000) 86–90.
35) S. Li, M. A. M. Bourke, I. J. Beyerlein, D. J. Alexander and B. Clausen: Mater. Sci. Eng. A382(2004) 217–236.
36) A. V. Nagasekhar and Y. Tick-Hon: Comp. Mater. Sci. 30(2004) 489–495.