Equal-Channel Angular Pressing and High-Pressure Torsion of Pure Copper:
Evolution of Electrical Conductivity and Hardness with Strain
Kaveh Edalati
1,2,+, Kazutaka Imamura
3, Takanobu Kiss
3and Zenji Horita
1,21Department of Materials Science and Engineering, Faculty of Engineering, Kyushu University, Fukuoka 819-0395, Japan 2WPI, International Institute for Carbon-Neutral Energy Research (I2CNER), Kyushu University, Fukuoka 819-0395, Japan
3Department of Electerical Engineering, Faculty of Engineering, Kyushu University, Fukuoka 819-0395, Japan
Pure Cu (99.99%) is processed by equal-channel angular pressing (ECAP) and by high-pressure torsion (HPT). The electrical resistivity as well as the microhardness increases with an increase in the equivalent strain at an early stage of straining, but saturates to a steady state at the equivalent strains more than³20. At the steady state, the samples processed by ECAP and HPT show a significant increase in the hardness (³270%) but little decrease in the electrical conductivity (³12%) when compared to the annealed state. Transmission electron microscopy confirms that the microstructure does not change at the saturated level with further straining. Evolutions of hardness, electrical conductivity and microstructures are also investigated after post-HPT annealing. [doi:10.2320/matertrans.MD201109]
(Received June 30, 2011; Accepted August 9, 2011; Published September 21, 2011)
Keywords: severe plastic deformation, equal-channel angular pressing, high-pressure torsion, ultrafine grain, electrical conductivity
1. Introduction
Processing via severe plastic deformation (SPD) to achieve ultrafine grained (UFG) materials has been an attractive research topic in last three decades.1,2) Differ-ent SPD methods have been utilized for processing of metallic materials. They are equal-channel angular pressing (ECAP),3,4)high-pressure torsion (HPT),5,6)and accumulative
roll-bonding (ARB).7)The grain size is significantly refined
through the SPD and thus superior mechanical properties are often observed in the SPD-processed metallic materials.111)
High purity Cu is a typical material in many studies in the field of SPD processing.1223)
Pure Cu is the most important representative of electrical engineering materials because of its high electrical con-ductivity. However, a major limitation of pure Cu is that it has low strength and low strength-to-weight ratio. Recent studies have shown that both high strength and high electrical conductivity are attained in metallic materials through the application of different SPD processes,2136) and thus, the SPD processes can be especially attractive for electrical industries. The evolution of mechanical properties and electrical conductivity with strain has been well investigated in pure Cu processed by ECAP2123) and ARB.3234)
However, despite numerous papers regarding the micro-structural features and mechanical property improvement of HPT-processed Cu,1219) there have been no reports on the
evolution of electrical conductivity in Cu after processing by HPT.
In this study, thus, pure Cu is severely deformed by HPT over a wide range of strain and evolutions of microstructures and microhardness are investigated with a special attention on electrical conductivity. The microhardness and electrical conductivity of the ECAP-processed and post-HPT annealed Cu samples are also investigated.
2. Experimental Materials and Procedures
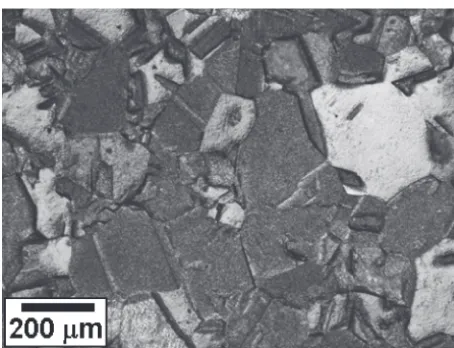
High purity copper (99.99%) was received in the form of a cold-extruded rod with 10 mm diameter and 1250 mm length, and in the form of a cold-rolled plate having dimensions of 10 mm©100 mm©200 mm. The rod was cut to shorter rods with 65 mm length for ECAP processing. The plate was cut to cylinders with 10 mm diameter and 10 mm height and to inner-hollow cylinders with inner and outer diameters of 24 mm and 30 mm using a wire-cutting electrical discharge machine. They were further sliced to discs and rings with thicknesses of 0.8 mm for HPT processing. All samples having the forms of rods, discs and rings were annealed for 1 h at 873 K to give an initial grain size of ³150¯m. Microstructure taken with optical microscopy after annealing is shown in Fig. 1.
ECAP was carried out using the facility as described in Ref. 12). ECAP was conducted using route Bc on the rods at room temperature for eitherN=1, 2, 4, 8, 12 or 20 passes through a die, having a channel diameter of 10 mm, a channel angle of¯=90° and an angle for the outer arc of curvature
Fig. 1 Optical micrographs of sample after annealing at 873 K for 1 h. +Corresponding author, E-mail: Kaveh.edalati@zaiko6.zaiko.kyushu-u.
ac.jp
Special Issue on Advanced Materials Science in Bulk Nanostructured Metals
[image:1.595.313.540.596.770.2]of ²=20°. The equivalent strain, ¾, for ECAP process is determined by the following equation37)
¾¼ Nffiffiffi 3
p 2 cot 2 þ
2
þ cosec 2 þ
2
ð1Þ
HPT was conducted using the facilities as described in Refs. 38, 39) for disc and ring samples. The facilities for HPT consist of upper and lower anvils having a shallow hole of 10 mm diameter and 0.25 mm depth at the center for the disc sample. For the ring sample, the upper and lower anvils have a shallow circular groove with the inner and outer diameters of 24 mm and 30 mm with the groove depth of 0.25 mm around the center. Each sample was placed on the hole or on the groove and the upper and lower anvils were rotated with respect to each other at room temperature with a rotation speed of½=0.5 rpm under a pressure ofP=2 GPa. The rotation was terminated after revolutions of either N=
1/4, 1/2, 3/4, 1, 2, 4, 5, 10, 12, 16 or 20. Disc samples subjected to HPT for 1 and 12 revolutions were annealed for 2 h at 433 K and 513 K. In this study, the values of slippage fraction and thickness reduction during HPT were measured as described earlier.40,41) Since both slippage and thickness reductions during HPT were less than 12%for any numbers of revolutions, the equivalent strain was calculated as8)
¾¼2³rNffiffiffi 3 p
h ð2Þ
where r is the distance from the disc center and h is the thickness of the disc and ring samples.
The initial annealed sample, a disc sample subjected to pressing with 50% thickness reduction, rods subjected to ECAP, disc and ring samples subjected to HPT and disc samples subjected to post-HPT annealing were evaluated in terms of Vickers microhardness, electrical conductivity and microstructures. For the ECAP samples, 10 mm diameter discs were cut at the mid-point of the rods along the direction perpendicular to the longitudinal axis. First of all, all samples were polished to a mirror-like surface and the Vickers microhardness was measured along the radii from the center to edge at 8 different radial directions with 0.5 mm increments. For each hardness measurement, a load of 200 g was applied for 15 s. Second, for electrical conductivity measurements, miniature rods with a 0.5 mm square cross section and 9 mm length were cut from the 10mm diameter discs at 2 mm away from the center, and from the 30 mm diameter discs at 1 mm away from the edge. Four-point electrical conductivity measurements were carried out using different currents in the range of 0100 mA. The electrical resistivity/conductivity was determined by Ohm’s Law by measuring the produced voltage at central part of the miniature rods with 4 mm length. Third, for transmission electron microscopy (TEM), discs with 3 mm diameter were punched from 3.5 mm away from the disc centers. The 3 mm discs were ground mechanically to a thickness of 0.15 mm and further thinned with a twin-jet electro-chemical polisher using a solution of 15% HNO3, 15% C3H5(OH)3 and 70%
CH3OH at 263 K under an applied voltage of 9 V. TEM was
performed at 200 kV for microstructural observation and selected area electron diffraction (SAED) patterns were also taken from a region with 6.3¯m diameter.
3. Results and Discussion
Figure 2 plots the hardness variation with the equivalent strain for Cu rods processed by ECAP using route Bc for various numbers of passes. The hardness increases with increasing equivalent strain at an early stage of straining but saturates to a steady state at high strains where the hardness remains unchanged with further straining. The microhardness at the steady state is 132 Hv. The dependence of the hardness with respect to strain including the hardness level at the steady-state is similar to that reported earlier.12)
The hardness values are plotted against the equivalent strain in Fig. 3 after HPT processing at room temperature for N=1 and 12 revolutions and after post-HPT annealing at 433 K and 513 K for 2 h. The hardness variations of as-deformed samples are essentially the same as the one reported in an earlier paper9) and the steady-state level,
132 Hv, is reached directly following the initial increase with straining. However, following the post-HPT annealing, the hardness initially increases with increasing strain and, after reaching a maximum and decreasing to a minimum, saturates to a constant level. The hardness values at the steady state are 80 Hv and 86 Hv after post-HPT annealing at 433 K and 513 K, respectively. The hardness variations and the appearance of the hardness maximums after post-HPT annealing are similar to the ones reported in pure Al (99.99%)38,39,4244) and pure Mg (99.9%)45) subjected to
HPT at room temperature. It is noted that the temperature of 433 K corresponds to 0.32Tm, whereTmis the melting point,
and 0.32Tm is equivalent to room temperature for Al and
Mg. Thus, this indicates unambiguously that static softening (due to recovery and/or recrystallization) can occur during HPT processing of Cu, Al and Mg as suggested in an earlier paper.46)Now, the major difference is that a hardness minimum appears in Fig. 3 before the steady state. The reasons for this hardness behavior are described below.
Details for the microstructural evolution of Cu during HPT were described in an earlier paper.18) In the early stages of straining, dislocations accumulate and subgrains form with an increasing population within individual grains. Whereas most of grains contain many dislocations before the onset of the steady state, there are certain fractions of grains with a low density of dislocations at the steady state. It was suggested
[image:2.595.320.534.69.224.2]that a dynamic recrystallization, which might have taken place during HPT processing, results in formation of grains with low dislocation density. It is well known that the density of dislocations is substantial in triggering the static softening and recrystallization. It is concluded that the hardness maximum at ¾=³5 in Fig. 3 appear when the dislocations density and stored energy after HPT processing is high enough to trigger the static softening after post-HPT annealing and the hardness minimum appears when the dislocations density and stored energy reaches the highest level after HPT processing.
Despite the fact that the equivalent strain is theoretically zero at the center of disc according to eq. (2), close inspection of Fig. 3 reveals three points: first, the hardness of HPT-processed disc samples at the disc center are higher than that of the starting annealed sample, second, the hardness at the disc center increases with increasing the number of revolutions from N=1 to 12, and third, for sample processed afterN=12, the hardness at the disc center is higher when compared to the areas away from the disc center after post-HPT annealing. These are due to two main reasons:40) first, a small misalignment of the rotation axes between the lower and upper anvils may result in imposing an additional shear strain to the center of the disc, although the alignment was adjusted well within «0.01 mm in this study; second, in practice, hardness measurement at the exact center is difficult but the hardness values are measured within a circular area withr=0.1 mm in radii. Consideringr=0.1, estimations result in¾=0.45 and 5.4 for the disc center after
N=1 and 12 revolutions, respectively.
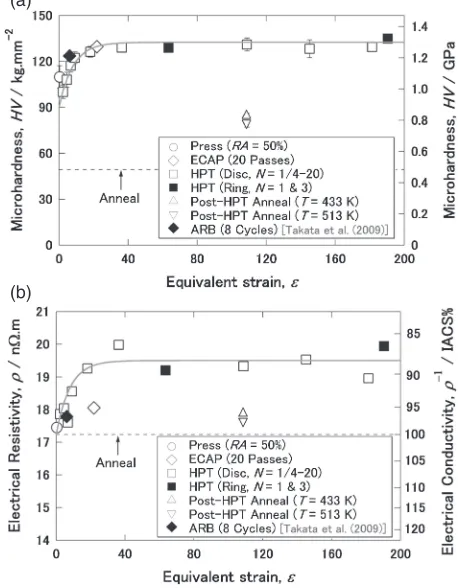
Figure 4 shows the variation of (a) hardness and (b) electrical resisivity/conductivity with respect to the equiv-alent strain. The results were selected from a series of tests: pressing with 50% thickness reduction, ECAP processing after 20 passes, HPT processing using disc specimens after
N=1/4, 1/2, 3/4, 1, 2, 4, 12, 16 and 20 revolutions, HPT
processing using ring specimens after N=1 and 3 revolutions, post-HPT annealing after N=12 revolutions, and ARB processing after 8 cycles. It is noted that the data for ARB were taken from Ref. 34) and the data for HPT were recorded from 2 mm away from the disc centers and 14 mm away from the ring centers. The following five important points are obtained from Fig. 3.
First, both hardness and electrical resistivity values lie on unique single curves when plotted as a function of equivalent strain for samples processed by different methods. Second, the hardness and electrical resistivity increase with an increase in the equivalent strain at an early stage of straining but level off and enter into a steady state at equivalent strains more than ³20 where the values remain unchanged with further straining. Third, the hardness increases significantly (³270%) but the increase in the electrical resistivity is as small as ³12% so that the electrical conductivity decreases slightly at the steady state when compared to the annealed condition. Fourth, the post-HPT annealing leads to a considerable decrease in the hardness but still maintains the hardness level as ³160% when compared to the one at the complete annealed condition. The electrical conductivity improves significantly so that its level is recovered to 97%. Fifth, the presence of the steady state was not reported in the earlier papers after ECAP processing2123) and after ARB
processing3234)when electrical conductivity was plotted as a
function of equivalent strain. It is most probable that the difference should be due to larger strains that are imposed in this study.
TEM micrographs and SAED patterns are shown in Fig. 5 from three samples subjected to different magnitudes of the equivalent strain: (a) ¾=22 after ECAP for 20 passes, (b) ¾=80 after HPT for 5 revolutions, and (c) ¾=160 after HPT for 10 revolutions. These three samples correspond to the observations at the steady state. It is apparent from Fig. 5 that each microstructure consists of small grains with an average size of 200400 nm having high angles of
misor-Fig. 3 Vickers microhardness plotted against equivalent strain for disc samples after HPT for 1 and 12 revolutions and post-HPT annealing for 2 h at 433 K and 513 K.
(a)
(b)
[image:3.595.57.283.71.212.2] [image:3.595.312.541.76.370.2]ientation as evident from the SAED with a well defined ring pattern. Inspection of Fig. 5 reveals that there are grains with a high density of dislocations while some grains contain a low dislocations density. Close examination of the micro-structures reveals that the micromicro-structures are reasonably the same for the three samples, indicating that the microstructure does not change at the steady state with straining. These microstructural features are consistent with the earlier observations.14)
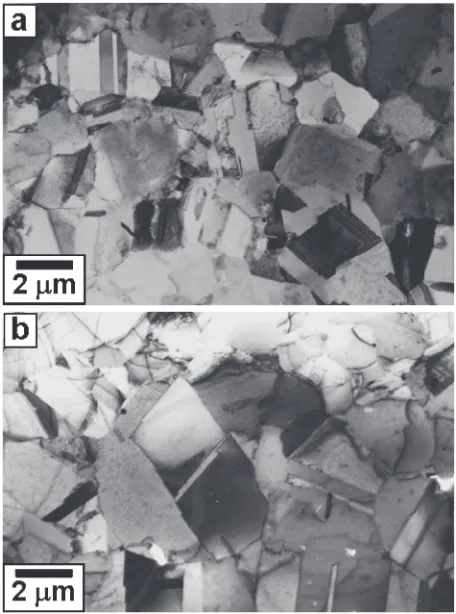
Microstructures are shown in Fig. 6 for the steady state conditions after post-HPT annealing at (a) 433 K and (b) 513 K for 2 h. The microstructures consist of grains with the sizes of 14¯m after annealing at 433 K and of 26¯m after annealing at 513 K, where the grains are free of dislocations. It should be noted that many twins are visible in many grains and they are typical features observed after annealing of deformed metals and alloys with low stacking fault energies.47)It is apparent that there is a high driving force for recrystallization in HPT-processed Cu due to high dislocation density and large area of grain boundaries. It is considered that the appreciable retainment of the higher hardness level but the improvement of the electrical conductivity closer to ³100% after post-HPT annealing should be attributed to static softening and recrystallization.
4. Conclusions
Pure Cu (99.99%) is processed by ECAP and by HPT using disc and ring specimens and the following conclusions were obtained.
(1) Both hardness and electrical resistivity increases with an increase in the equivalent strain at an early stage of straining, but saturates to a steady state at the equivalent strains more than ³20.
(2) Despite a marked increase in the hardness (³270%), the electrical conductivity decreases only by³12% at the steady state when compared to the annealed condition. (3) When the HPT-processed samples are annealed at 433 K and 513 K for 2 h, a maximum and a minimum hardness peaks appears with increasing strain, and this is followed by saturation to a steady state where the hardness remains unchanged with further straining. The hardness level at the steady state decreases when compared to the as-HPT-processed state but the hard-ness level as³160%is still maintained when compared to the annealed condition. The electrical conductivity is improved to more than 97%by the post-HPT annealing.
Acknowledgement
One of the authors (KE) thanks the Japan Society for Promotion of Science (JSPS) for a postdoctoral scholarship. This work was supported in part by a Grant-in-Aid for Scientific Research from the Ministry of Education, Culture, Sports, Science and Technology of Japan in the Innovative
Fig. 5 TEM micrographs and SAED patterns for (a) a rod sample processed by ECAP for 20 passes (¾=22), and disc samples processed by HPT for (b) 5 revolutions (¾=80) and (c) 10 revolutions (¾=160).
[image:4.595.50.286.69.449.2] [image:4.595.313.541.70.377.2]Area“Bulk Nanostructured Metals”, and in part by Kyushu University Interdisciplinary Programs in Education and Projects in Research Development (P&P).
REFERENCES
1) R. Z. Valiev, R. K. Islamgaliev and I. V. Alexandrov: Prog. Mater. Sci. 45(2000) 103189.
2) R. Z. Valiev, Y. Estrin, Z. Horita, T. G. Langdon, M. J. Zehetbauer and Y. T. Zhu: JOM58(2006) 3339.
3) V. M. Segal, V. I. Reznikov, A. E. Drobyshevskiy and V. I. Kopylov: Russ. Metall.1(1981) 99105.
4) R. Z. Valiev and T. G. Langdon: Prog. Mater. Sci.51(2006) 881981. 5) P. W. Bridgman: Phys. Rev.48(1935) 825847.
6) A. P. Zhilyaev and T. G. Langdon: Prog. Mater. Sci.53(2008) 893 979.
7) Y. Saito, N. Tsuji, H. Utsunomiya, T. Sakai and R. G. Hong: Scr. Mater. 39(1998) 12211227.
8) R. Z. Valiev, Y. V. Ivanisenko, E. F. Rauch and B. Baudelet: Acta Mater.44(1996) 47054712.
9) R. Z. Valiev, I. V. Alexandrov, Y. T. Zhu and T. C. Lowe: J. Mater. Res. 17(2002) 58.
10) F. Wetscher, A. Vorhauer, R. Stock and R. Pippan: Mater. Sci. Eng. A 387389(2004) 809816.
11) R. Pippan, S. Scheriau, A. Taylor, M. Hafok, A. Hohenwarter and A. Bachmaier: Annu. Rev. Mater. Res.40(2010) 319343.
12) S. Komura, Z. Horita, M. Nemoto and T. G. Langdon: J. Mater. Res.14 (1999) 40444050.
13) H. S. Kim, S. I. Hong, Y. S. Lee, A. A. Dubravina and I. V. Alexandrov: J. Mater. Process. Technol.142(2003) 334337. 14) X. Z. Liao, Y. H. Zhao, S. G. Srinivasan, Y. T. Zhu, R. Z. Valiev and
D. V. Gunderov: Appl. Phys. Lett.84(2004) 592594.
15) T. Hebesberger, H. P. Stuwe, A. Vorhauer, F. Wetscher and R. Pippan: Acta Mater.53(2005) 393402.
16) A. Mishra, B. K. Kad, F. Gregori and M. A. Meyers: Acta Mater.55 (2007) 1328.
17) A. P. Zhilyaev, S. Swaminathan, A. A. Gimazov, T. R. McNelley and T. G. Langdon: J. Mater. Sci.43(2008) 74517456.
18) K. Edalati, T. Fujioka and Z. Horita: Mater. Sci. Eng. A497(2008) 168173.
19) G. Khatibi, J. Horky, B. Weiss and M. Zehetbauer: Int. J. Fatigue32 (2010) 269278.
20) X. H. An, S. D. Wu, Z. F. Zhang, R. B. Figueiredo, N. Gao and T. G. Langdon: Scr. Mater.63(2010) 560563.
21) S. Han, C. Lim, C. Kim and S. Kim: Metall. Mater. Trans. A36(2005) 467470.
22) A. Habibi, M. Ketabchi and M. Eskandarzadeh: J. Mater. Process. Technol.211(2011) 10851090.
23) F. Higuera, J. A. Munoz and J. M. Cabrera: Mater. Sci. Forum667669 (2011) 713718.
24) K. X. Wei, W. Wei, F. Wang, Q. B. Du, I. V. Alexandrov and J. Hu: Mater. Sci. Eng. A528(2011) 14781484.
25) M. Ashida, T. Hamachiyo, K. Hasezaki, H. Matsunoshita, M. Kai and Z. Horita: J. Phys. Chem. Solids70(2009) 10891092.
26) T. Hamachiyo, M. Ashida, K. Hasezaki, H. Matsunoshita, M. Kai and Z. Horita: Mater. Trans.50(2009) 15921595.
27) L. Zhang, A. Grytsiv, B. Bonarski, M. Kerber, D. Setman, E. Schafler, P. Rogl, E. Bauer, G. Hilscher and M. Zehetbauer: J. Alloy. Compd. 494(2010) 7883.
28) B. D. Long, M. Umemoto, Y. Todaka, R. Othman and H. Zuhailawati: Mater. Sci. Eng. A528(2011) 17501756.
29) D. V. Shangina, N. R. Bochvar and S. V. Dobatkin: Mater. Sci. Forum 667669(2011) 301306.
30) H. Matsunaga, Z. Horita, K. Imamura, T. Kiss and X. Sauvage: Mater. Sci. Forum667669(2011) 307312.
31) Y. Champion, J. P. Couzinie, S. T. Nenez, Y. Brechet, R. K. Islamgaliev and R. Z. Valiev: Mater. Sci. Forum667669(2011) 755759. 32) Y. H. Jang, S. S. Kim, S. Z. Han, C. Y. Lim, C. J. Kim and M. Goto:
J. Mater. Sci.40(2005) 35273529.
33) S. A. Hosseini and H. Danesh-Manesh: Mater. Design30(2009) 2911 2918.
34) N. Takata, S. H. Lee and N. Tsuji: Mater. Lett.63(2009) 17571760. 35) L. Ghalandari and M. M. Moshksar: J. Alloy. Compd.506(2010) 172
178.
36) T. Akita, K. Kitagawa, K. Kita, M. Gotoh, Y. Hirose and N. Tsuji: J. Phys. Conf. Ser.240(2010) 012119.
37) Y. Iwahashi, J. Wang, Z. Horita, M. Nemoto and T. G. Langdon: Scr. Mater.35(1996) 143146.
38) Y. Harai, Y. Ito and Z. Horita: Scr. Mater.58(2008) 469472. 39) K. Edalati and Z. Horita: Mater. Trans.50(2009) 9295.
40) K. Edalati, T. Fujioka and Z. Horita: Mater. Trans.50(2009) 4450. 41) K. Edalati, Z. Horita and T. G. Langdon: Scr. Mater.60(2009) 912. 42) C. Xu, Z. Horita and T. G. Langdon: Acta Mater.55(2007) 203212. 43) M. Kawasaki, B. Ahn and T. G. Langdon: J. Mater. Sci.45(2010)
45834593.
44) M. Kawasaki, R. B. Figueiredo and T. G. Langdon: Acta Mater.59 (2011) 308316.
45) K. Edalati, A. Yamamoto, Z. Horita and T. Ishihara: Scr. Mater. 64 (2011) 880883.
46) K. Edalati, Y. Ito, K. Suehiro and Z. Horita: Int. J. Mater. Res.100 (2009) 16681673.