The Journal of Experimental Biology
ABSTRACT
This study quantified and compared hypoxia tolerance and swim performance among cyprinid fish species from rapid-, slow- and intermediate-flow habitats (four species per habitat) in China. In addition, we explored the effects of short-term acclimation on swim performance, maximum metabolic rate (ṀO2,max) and gill remodelling to detect habitat-associated patterns of plastic response to hypoxia. Indices of hypoxia tolerance included oxygen threshold for loss of equilibrium (LOE50) and aquatic surface respiration (ASR50), and critical oxygen tension for routine metabolic rate (Pcrit). Critical swimming speed (Ucrit) and ṀO2,maxwere measured under normoxic and hypoxic conditions after 48 h acclimation to normoxia and hypoxia, and gill remodelling was estimated after 48 h of hypoxia exposure. Both traditional ANCOVA and phylogenetically independent contrast (PDANOVA) analyses showed that fish species from rapid-flow habitats exhibited lower LOE50 compared with fish from intermediate- and slow-flow habitats. Habitat-specific differences in Pcritand Ucritwere detected using PDANOVA but not traditional ANCOVA analyses, with fish species from rapid-flow habitats exhibiting lower Pcritbut higher Ucritvalues compared with fish from intermediate- and slow-flow habitats. Fish species from rapid-flow habitats were also characterized by less plasticity in swim performance and gill morphology in response to hypoxia acclimation compared with species from slow-flow habitats, but a greater drop in swim performance in response to acute hypoxia exposure. The study detected a habitat-specific difference in hypoxia tolerance, swimming performance and its plasticity among fish from habitats with different flow conditions, possibly because of the long-term adaptation to the habitat caused by selection stress. The PDANOVA analyses were more powerful than traditional statistical analyses according to the habitat effects in both hypoxia tolerance and swimming performance in this study.
KEY WORDS: Hypoxia tolerance, Preferred habitat, Swimming performance, Phenotypic plasticity, Gill morphology
INTRODUCTION
Oxygen availability in aquatic habitats is a major environmental factor that influences the ecology, behaviour and physiology of fish (Martínez et al., 2011). Hypoxia [defined as any level of dissolved oxygen (DO) low enough to negatively impact the behaviour and/or RESEARCH ARTICLE
1Laboratory of Evolutionary Physiology and Behaviour, Chongqing Key Laboratory of Animal Biology, Chongqing Normal University, Chongqing 400047, China. 2College of Resources and Environmental Science, Key Laboratory of Southwest Resource Exploitation and Environmental Disaster Controlling Project of the Education Ministry, Chongqing University, Chongqing 400030, China. *Author for correspondence ([email protected])
Received 4 April 2013; Accepted 14 October 2013
physiology of an organism] occurs naturally in many aquatic systems (Pollock et al., 2007). However, the frequency and extent of hypoxia is increasing associated with anthropogenic activities such as eutrophication and pollution of water bodies (Rabalais et al., 2010). Therefore, it has become increasingly important to understand the mechanisms that fish use to persist and survive under hypoxic conditions and to identify indicators of hypoxia tolerance that can be compared across species and systems. In this study, we use a closely related group of cyprinid fishes from China to explore habitat-associated hypoxia tolerance, relationships among tolerance indices and mechanisms that may contribute to the interspecific patterns observed.
Critical oxygen tension for routine oxygen consumption rate (Pcrit)
is the minimum oxygen level required to sustain routine oxygen consumption rate (ṀO2,rout), and is considered to be an indicator of
an animal’s hypoxia tolerance (Ultsch et al., 1978; Mandic et al., 2009). In addition to Pcrit, the oxygen threshold for the loss of
equilibrium (LOE), which represents the partial pressure of oxygen at which the fish can maintain balance, is also a frequently used indicator of hypoxia tolerance (Barnes et al., 2011; Mandic et al., 2013). Aquatic surface respiration (ASR), whereby fish breathe water from surface film, is a common response of water-breathing fish to extreme hypoxia (Shingles et al., 2005; Sloman et al., 2006). ASR is hypothesised to be triggered by environmental oxygen tensions at which respiratory mechanisms fail to compensate for environmental hypoxia (Takasusuki et al., 1998). Therefore, the oxygen threshold for ASR is another potentially useful hypoxia tolerance indictor in addition to Pcritand LOE.
In many fish species, swimming performance is postulated to be a central determinant of Darwinian fitness (Brett, 1964; Plaut, 2001; Blake, 2004). In fish, the determination of maximum sustainable swimming speed or critical swimming speed (Ucrit) is widely used
to evaluate aerobic swimming performance (Gregory and Wood, 1998; Plaut, 2001; Lee et al., 2003; MacNutt et al., 2004). Aerobic swimming performance may be limited by either oxygen uptake and delivery or the aerobic metabolic capacity of the muscle. Ecologically, decreased swimming performance, which includes both swimming speed and swimming efficiency, in hypoxic water may render animals more vulnerable to predation and may also affect the foraging efficiency of predators (Abrahams et al., 2007). Therefore, the mechanism by which fish can maintain their swimming ability under hypoxic conditions may be closely related to their survival in such an environment.
The ability of fish to maintain their swimming ability under hypoxic conditions may be affected by acclimation to hypoxia, i.e. acclimation may induce a phenotypically plastic response that improves tolerance to hypoxic stress. For example, the maximum metabolic rate (ṀO2,max) and swimming performance of goldfish
(Carassius auratus) improved significantly after acclimation to
Interspecific variation in hypoxia tolerance, swimming
performance and plasticity in cyprinids that prefer different
habitats
The Journal of Experimental Biology
hypoxia for 48 h (Fu et al., 2011). And in several species ofcyprinids, including the crucian carp (Carassius carassius) (Sollid et al., 2003), goldfish (Sollid et al., 2005; Mitrovic et al., 2009) and scaleless carp (Gymnocypris przewalskii) (Matey et al., 2008), hypoxia exposure has been found to result in dramatic changes in gill morphology (Sollid et al., 2003) that reduces the water–blood diffusion distance (Matey et al., 2008).
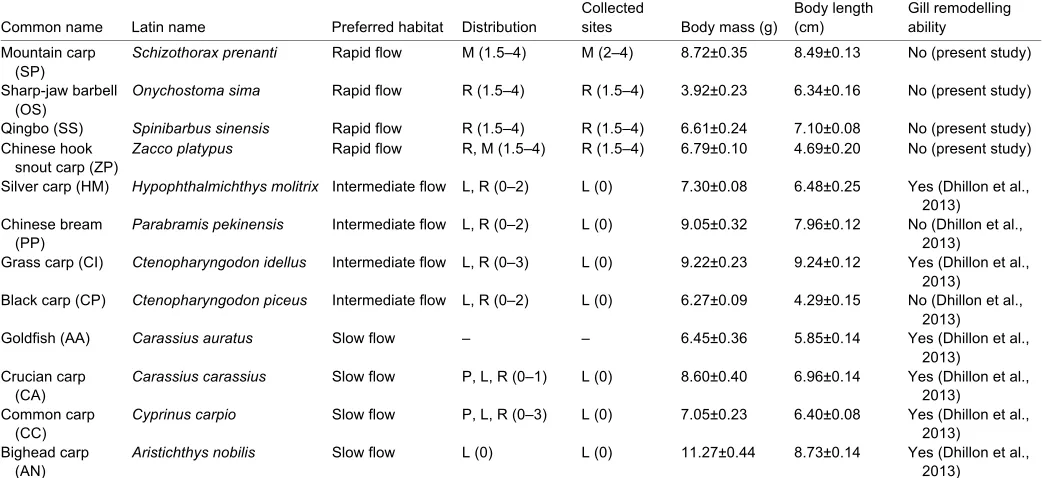
Hypoxia tolerance and physiological plasticity may differ between fish that live in rapid-flow habitats and fish that live in slow-flow habitats. Rapid-flow rivers often exhibit little DO change and generally have high DO levels, whereas some small, isolated bodies of water, such as ponds, exhibit large daily DO fluctuations. The Cyprinidae is one of the largest families of vertebrates in the world. This family has a wide geographic distribution, including mainland Eurasia, Japan, the East Indian Islands, Africa and North America. There are ~532 species of cyprinid within ~132 genera in China, and the phylogenetic relationships among these fish are well documented (Wang, 2005). Because of considerable morphological and physiological diversity, cyprinids exist in a wide variety of habitats (Howes, 1991). Therefore, we investigated the hypoxia tolerance, swimming performance and plastic response to hypoxia in 12 cyprinid species that live in slow-, intermediate- or rapid-flow habitats (Table 1): Schizothorax prenanti (Tchang 1930) (SP), Onychostoma sima(Sauvage & Dabry de Thiersant 1874) (OS), Spinibarbus sinensis (Bleeker 1871) (SS), Carassius auratus (Linnaeus 1758) (AA), Carassius carassius(Linnaeus 1758) (CA), Cyprinus carpio Linnaeus 1758 (CC), Aristichthys nobilis (Richardson 1845) (AN), Hypophthalmichthys molitrix (Valenciennes 1844) (HM), Parabramis pekinensis(Basilewsky 1855) (PP), Ctenopharyngodon idellus(Valenciennes 1844) (CI), Ctenopharyngodon piceus (Richardson 1846) (CP) and Zacco platypus(Temminck & Schlegel 1846) (ZP). The objective of this study was to test whether hypoxia tolerance, gill remodelling ability, swimming performance and plasticity are related to habitat.
To test our hypotheses, we used both traditional statistical analyses and phylogenetically independent contrasts (PIC).
RESULTS
Hypoxia tolerance differences based on habitat ASR50
The effect of species on ASR50was significant, while neither habitat
nor fish length (covariate) were significant (nested ANCOVA; Fig. 1A). The effect of habitat on ASR50was also not significant
when controlling for phylogeny (PIC, P=0.429).
LOE50
Both habitat and species showed significant effects, while body length showed no effect on LOE50(nested ANCOVA; Fig.1A). The
effect of habitat on LOE50was also significant when controlling for
phylogeny (PIC, P=0.004). The LOE50of fish species from
rapid-flow water exhibited significantly higher LOE50values than the
intermediate-flow group, while the latter exhibited significantly higher LOE50values than the species from slow-flow habitats
(one-way ANCOVA, P<0.001; Fig. 1B). Neither AA nor CA showed any sign of LOE50after exposure to DO-free water for 1 h.
The ASR50value was positively related to LOE50in all 12 species
(R2=0.580, P=0.004; Fig. 1C).
Pcritand ṀO2,rest
Pcrit varied from 0.78±0.05 in AN to 3.00±0.38 mg O2l−1in ZP
(Fig. 2A), whereas routine metabolic rate (ṀO2,rout) varied from
29.5±2.1 mg O2kg−1h−1 in PP to 63.6±4.7 mg O2kg−1h−1 in SP
(Fig. 2B). There was no significant difference in either Pcrit or
ṀO2,routamong habitats (nested ANCOVA, P>0.05). However, the
habitat effect was significant for Pcritwhen controlling for phylogeny
(Fig. 2A,B). One-way ANCOVA indicated a significant difference in Pcritbetween the rapid-flow group and the other two groups. The
mean Pcritvalue was positively related to mean ṀO2,routin all 12
species (R2=0.341, P=0.038; Fig. 2C).
Table1. Habitat information and biological characteristics of the 12 fish species used in this study
Common name Latin name Preferred habitat Distribution
Collected
sites Body mass (g)
Body length (cm)
Gill remodelling ability Mountain carp
(SP)
Schizothorax prenanti Rapid flow M (1.5–4) M (2–4) 8.72±0.35 8.49±0.13 No (present study)
Sharp-jaw barbell (OS)
Onychostoma sima Rapid flow R (1.5–4) R (1.5–4) 3.92±0.23 6.34±0.16 No (present study)
Qingbo (SS) Spinibarbus sinensis Rapid flow R (1.5–4) R (1.5–4) 6.61±0.24 7.10±0.08 No (present study)
Chinese hook snout carp (ZP)
Zacco platypus Rapid flow R, M (1.5–4) R (1.5–4) 6.79±0.10 4.69±0.20 No (present study)
Silver carp (HM) Hypophthalmichthys molitrix Intermediate flow L, R (0–2) L (0) 7.30±0.08 6.48±0.25 Yes (Dhillon et al.,
2013) Chinese bream
(PP)
Parabramis pekinensis Intermediate flow L, R (0–2) L (0) 9.05±0.32 7.96±0.12 No (Dhillon et al., 2013)
Grass carp (CI) Ctenopharyngodon idellus Intermediate flow L, R (0–3) L (0) 9.22±0.23 9.24±0.12 Yes (Dhillon et al.,
2013)
Black carp (CP) Ctenopharyngodon piceus Intermediate flow L, R (0–2) L (0) 6.27±0.09 4.29±0.15 No (Dhillon et al.,
2013)
Goldfish (AA) Carassius auratus Slow flow – – 6.45±0.36 5.85±0.14 Yes (Dhillon et al.,
2013) Crucian carp
(CA)
Carassius carassius Slow flow P, L, R (0–1) L (0) 8.60±0.40 6.96±0.14 Yes (Dhillon et al., 2013)
Common carp (CC)
Cyprinus carpio Slow flow P, L, R (0–3) L (0) 7.05±0.23 6.40±0.08 Yes (Dhillon et al., 2013)
Bighead carp (AN)
Aristichthys nobilis Slow flow L (0) L (0) 11.27±0.44 8.73±0.14 Yes (Dhillon et al., 2013)
[image:2.612.46.567.468.707.2]The Journal of Experimental Biology
Ucritdifferences based on habitat Ucrit
In the control group (normoxia), the fish species showed great variation in Ucrit, ranging from 7.05 body lengths (BL) s−1in OS to
3.62 BL s−1in CI (Fig. 3A). Both species and body length showed
significant effects (P<0.001) while habitat showed no significant effect on Ucrit(nested ANCOVA; Fig. 3A). However, the effect of
habitat on Ucrit was shown using phylogenetic analysis (PIC,
P=0.046). The Ucritof the rapid-flow fish species was significantly
higher than the other fish groups (one-way ANCOVA, P<0.001).
Sensitivity to hypoxia
Under hypoxic conditions, all fish species showed significantly lower Ucrit values (P<0.001). The Ucrit value of control fish
decreased by 21–60%, with the percentage reduction being greater in fish from rapid-flow habitats (significant species by condition interaction, P<0.001; Fig. 3B).
Acclimation effect
After 48 h hypoxia acclimation, only CA and AA showed significantly higher Ucritvalues under normoxic conditions, whereas
both SP and PP showed significantly lower Ucritvalues compared
with the control group (P<0.05; Fig. 3). However, when measured under hypoxic conditions, half of the fish species from the intermediate-flow group and all four fish species from the slow-flow group showed significantly higher Ucritvalues compared with the
control fish under hypoxic conditions. Therefore, the hypoxia acclimation had no effect on the Ucritmeasured under hypoxia for
the rapid-flow species, but significantly improved the Ucritmeasured
under hypoxia for the slow-flow species.
ṀO2,maxdifferences based on habitat
ṀO2,max
ṀO2,maxalso showed great variation among the different species. SP
showed the highestṀO2,maxvalue, with 267 mg O2kg−1h−1, whereas
CA showed the lowest value, with 117 mg O2kg−1h−1(Fig. 4A).
However, neither habitat nor body mass showed significant effects
on ṀO2,max (nested ANCOVA; Fig. 4A). The effect of habitat on
ṀO2,maxwas also not significant when controlling for phylogeny
(PIC, P=0.142).
Sensitivity to hypoxia
Under hypoxic conditions, all fish species showed significantly lower ṀO2,maxvalues (P<0.001). The ṀO2,maxvalue of control fish
decreased by 53 to 81%, with the percentage reduction greater in fish from rapid-flow habitats (significant species by condition interaction, P<0.001; Fig. 4B).
Acclimation effect
After 48 h hypoxia acclimation, only CA showed significantly higher
ṀO2,max values under normoxic conditions, whereas AN showed
significantly lower ṀO2,maxvalues compared with the control group
(P<0.05; Fig. 4). However, under hypoxic conditions, half the fish species from the intermediate group and three of four fish species from the slow-flow group showed significantly higher ṀO2,maxvalues
compared with the control fish (P<0.05). Hypoxia acclimation had no effect on the ṀO2,maxfor any of the four rapid-flow fish species.
Gill morphology
All four fish species that were evaluated exhibited no gill morphology changes after hypoxia acclimation, as indicated by the protruding lamella height. The protruding lamella heights were
A
0 0.2 0.4 0.6 0.8 1.0 1.2 1.4
SP OS SS ZP HM PP CI CP AA CA CC AN Species
ASR
50
(mg O
2
l
–1
)
Nested ANCOVA: Habitat effect F2,9=4.08, P=0.055
Species effect F3,3=8.47, P<0.001
Body length effect F1=0.671, P=0.421
PIC: Habitat effect CV=32.15, P=0.429
B
*
*
0 0.1 0.2 0.3 0.4 0.5 0.6 0.7 0.8 0.9 1.0
LOE
50
(mg O
2
l
–1)
a b c
C
0 0.2 0.4 0.6 0.8 1.0 1.2
0 0.1 0.2 0.3 0.4 0.5 0.6 0.7 0.8 LOE50 (mg O2 l–1)
ASR
50
(mg O
2
l
–1)
Nested ANCOVA: Habitat effect F2,9=12.02, P=0.003
Species effect F3,3=80.00, P<0.001
Body length effect F1=2.822, P=0.106
PIC: Habitat effect CV=21.49, P=0.004
SP OS SS ZP HM PP CI CP AA CA CC AN Species
Fig. 1. Hypoxia tolerance indicators and their relationship among the 12
experimental cyprinid species. Oxygen threshold for (A) aquatic surface
The Journal of Experimental Biology
62.1±4.2 μm (N=4 for all four species both before and after hypoxia acclimation) versus 54.5±2.9 μm, 47.0±3.1 versus 37.6±3.3 μm, 51.8±2.0 versus 53.8±1.3 and 75.2±2.1 versus 62.0±3.8 μm in the hypoxia-acclimated and non-acclimated SP, OS, SS and ZP, respectively.DISCUSSION
The primary objective of this study was to answer the question of whether hypoxia tolerance and swimming performance differed in fish species that live in different habitats. Habitat-specific differences in hypoxia tolerance and swimming performance were detected by PIC, while only hypoxia tolerance (as suggested by LOE50) was detected by traditional contrasts in this study, suggesting
that PIC is a more powerful test of habitat than the traditional analyses. The fish species from rapid-flow habitats showed lower hypoxia tolerance but better swimming performance and greater sensitivity to changes in DO compared with fish from slow-flow habitats, as expected. Furthermore, the fish from the slow-flow habitats showed improved swimming and respiratory capacities when measured under hypoxic conditions after hypoxia acclimation, possibly related to changes in gill morphology, whereas none of rapid-flow fish showed any improvement in aerobic swimming performance after hypoxia acclimation.
Hypoxia tolerance and preferred habitat
Habitat-specific differences in hypoxia tolerance as suggested by LOE50and Pcritwere detected by PIC in this study. However, the
habitat-specific difference in Pcritwas not shown by traditional
analyses. The difference between these two methods is that PIC take phylogenetic relationships into account. It is suggested that PIC may be more powerful than traditional nested ANOVA. It has been demonstrated that Pcritis quite changeable and is affected by
routine metabolic rate and, therefore, nutritional status (Hochachka, 1986; Guppy and Withers, 1999), hypoxia acclimation (Fu et al., 2011) and temperature (Barnes et al., 2011). A positive relationship between Pcritand ṀO2,routwas also shown
in the present study (Fig. 3C). Another important reason that Pcrit
may not be an appropriate indicator of hypoxia tolerance is that it neglects the role of anaerobic metabolic capacity in hypoxia tolerance (this is particularly true for both AA and CA in the present study).
An animal’s ability to tolerate environmental fluctuations requires the integration and coordination of behavioural, physiological and biochemical processes (Sloman et al., 2008). Behavioural responses such as ASR under hypoxic conditions may be beneficial for surviving hypoxia; however, the threshold for initiating ASR may be affected by perceived predation risk (Sloman et al., 2008). Although ASR may be predicted to be triggered by environmental DO levels at which the respiratory mechanisms fail to compensate for environmental hypoxia (Takasusuki et al., 1998), other studies have also supported the hypothesis that there is an element of flexibility in the performance of ASR (e.g. Sloman et al., 2008). In the present study, there were no significant differences in the ASR among fish with different preferred habitats. Furthermore, both AA and CA, the champions of anoxia tolerance, showed a relatively higher ASR threshold, suggesting that ASR may not be an appropriate hypoxia tolerance indicator for these two fish species (Fig. 2). This may be because some fish species, such as AA and CA in this study, performed ASR early whereas other fish did not. We can also speculate that ASR may change as a result of predator stress variation. Nevertheless, this study suggested that the LOE might be a better indicator of hypoxia tolerance, whereas Pcritand ASR may not be
A
0 0.5 1.0 1.5 2.0 2.5 3.0 3.5 4.0 4.5
Species
a b b
B
0 10 20 30 40 50 60 70 80 90 100
Species
C
0 0.5 1.0 1.5 2.0 2.5 3.0 3.5 4.0
20 30 40 50 60 70 SP OS SS ZP HM PP CI CP AA CA CC AN
Pcrit
(mg O
2
l
–1
)
Nested ANCOVA: Habitat effect F2,9=2.069, P=0.182
Species effect F3,3=10.00, P<0.001
Body mass effect F1=1.245, P=0.266
PIC: Habitat effect CV=16.19, P=0.049
SP OS SS ZP HM PP CI CP AA CA CC AN
M·O
2
,rout
(mg O
2
kg
–1
h
–1
)
Nested ANCOVA: Habitat effect F2,9=1.006, P=0.403
Species effect F3,3=9.44, P<0.001
Body mass effect F1=2.92, P=0.089
PIC: Habitat effect CV=11.09, P=0.143
M·O2,rest (mg O2 kg–1 h–1) Pcrit
(mg O
2
l
–1
)
Fig. 2. Critical oxygen tension, routine metabolic rate and their
relationship among the 12 experimental cyprinid species. (A) Critical
oxygen tension for routine metabolic rate (Pcrit, mg O2l−1) (A) and (B) routine metabolic rate (ṀO2,rout, mg O2kg−1h−1) of 12 different cyprinid fish species. Shared letters indicate no statistical difference in the trait measured [ANCOVA with habitat as a factor (N=3) and Duncan’s post hoctests] among groups of fish species from different habitat types (rapid flow, open columns; intermediate flow, grained columns; slow flow, filled columns).
The Journal of Experimental Biology
appropriate for some species because of physiological andbehavioural factors.
Swimming performance, gill morphology, plasticity and preferred habitat
Cyprinids living in rapid-flow habitats showed higher Ucritvalues
compared with slow-flow fish species, independent of phylogenetic relationships, which is consistent with our hypothesis. Similar to Pcrit, traditional contrasts showed no significant difference among
fish species from different habitats, again suggesting that PIC was more powerful in terms of detecting the habitat difference than traditional analyses. Furthermore, the swimming performance of the rapid-flow fish was more sensitive to changes in DO. This may reflect more stable and high DO conditions in rapid-flow habitats. By contrast, it may be critical for slow-flow fish species to maintain the majority of swimming performance under hypoxic conditions to survive in such an environment.
We determined whether swimming performance showed adaptive plasticity after hypoxia acclimation and whether such plasticity differed among groups of fish species from different preferred habitats. All four rapid-flow fish species showed no improvement in Ucritafter hypoxia acclimation either under normoxic or hypoxic
conditions. However, in the slow-flow fish species, all four fish species showed improved swimming performance under hypoxic conditions, whereas AA and CA also showed improved swimming performance under normoxic conditions. Similar to swimming performance, the fish species from slow-flow habitats also showed significant gill morphology changes whereas fish species from rapid-flow habitats showed less or no gill plasticity after 48 h hypoxia acclimation. The improved swimming and respiratory capacities after hypoxia acclimation might be partially due to the gill morphological change. Interestingly, we provide evidence here that gill remodelling may not be phylogenetically dependent because closely related fish, such as and PP and CI, showed alternative morphological responses after hypoxia acclimation. We further suggest that swimming performance and gill flexibility are habitat specific as long-term adaptions to the habitat DO condition. Besides morphological changes, physiological mechanisms might also contribute to the improved swimming performance of hypoxia-acclimated fish. It has been found that hypoxia acclimation results in an increase in haemoglobin concentration and blood oxygen carrying capacity (Wells et al., 1989; Silkin and Silkina, 2005), an increase in the number of muscle mitochondria and muscle myoglobin concentration, and a higher capillarization of muscle,
A
*
*
*
*
0 1 2 3 4 5 6 7 8 9 10
B
*
*
*
*
*
*
0 1 2 3 4 5 6
Species
a b b
SP OS SS ZP HM PP CI CP AA CA CC AN Ucrit
(BL
s
–1
)
Nested ANCOVA: Habitat effect F2,9=4.21, P=0.051
Species effect F3,3=15.42, P<0.001
Body length effect F1=31.99, P<0.001
PIC: Habitat effect CV=19.60, P=0.046
SP OS SS ZP HM PP CI CP AA CA CC AN
Fig. 3. Critical swimming speed varied among habitats and between
tested conditions. Ucrit(BL s−1) of the control (open columns) and 48 h
hypoxia-acclimated (filled columns) cyprinid fish species measured under (A) normoxic and (B) hypoxic conditions. Shared letters indicate no statistical difference in the trait measured [ANCOVA with habitat as a factor (N=3) and Duncan’s post hoctests] among groups of fish species from different habitat types. Asterisks indicate a significant difference in Ucritbetween the hypoxia-acclimated and non-hypoxia-acclimated fish (t-test, *P<0.05). The results of nested ANCOVA according to different preferred habitats and species (nested within habitat) and PIC (we only compared control fish measured under normoxic conditions) are given. Data are means ± s.e.m.
A
c,d b
d,e d
a
e d
d,e
b,c c,d c,d
b
*
*
0 50 100 150 200 250 300 350 400
B
*
*
*
*
*
0 20 40 60 80 100 120
Species
SP OS SS ZP HM PP CI CP AA CA CC AN
M·O
2
,max
(mg O
2
kg
–1
h
–1
)
Nested ANCOVA: Habitat effect F2,9=0.685, P=0.529
Species effect F3,3=9.46, P<0.001
Body mass effect F1=0.004, P=0.949
PIC: Habitat effect CV=10.19, P=0.095
SP OS SS ZP HM PP CI CP AA CA CC AN
Fig. 4. Maximum metabolic rate varied among habitats and between
tested conditions.ṀO2,max(mg O2kg−1h−1) of the control (blank column) and
The Journal of Experimental Biology
which improves the extraction and utilization of circulating oxygenstores at low DO levels (Sänger, 1993).
The acclimation effect on Ucritwas more profound when fish were
tested at low DO levels. Increased oxygen uptake capacity, which may have been elicited by hypoxia acclimation, may not result in increased swimming performance under normoxic conditions because the limiting factor is not likely to be the availability of oxygen. However, when measured under hypoxia, slow-flow fish showed significant swimming plasticity whereas rapid-flow fish did not.
In conclusion, this study clearly demonstrated that there was a phylogenetically independent habitat-specific difference in both hypoxia tolerance and swimming performance among fish from habitats with different flow conditions. This difference may reflect responses to flow regime and associated differences in DO among habitats. Rapid-flow fish showed poor hypoxia tolerance but stronger swimming performance than the slow-flow fish, as expected. The slow-flow fish also displayed significant gill morphology changes and improvement in swimming performance after hypoxia acclimation, whereas rapid-flow fish showed no such ability. Furthermore, the swimming performance of the slow-flow fish was less sensitive to changes in DO compared with the rapid-flow fish. The differences in sensitivity and plasticity of swimming performance in the fish from habitats with different flow conditions may be due to differences in oxygen fluctuation among the different habitats. Our results also suggest that PIC might be more powerful than traditional statistical approaches when detecting habitat differences in both swimming performance and hypoxia tolerance.
MATERIALS AND METHODS
Experimental fish and holding conditions
Juveniles of the 12 cyprinid species (Schizothorax prenanti, Onychostoma sima, Spinibarbus sinensis, Carassius auratus, Carassius carassius,
Cyprinus carpio, Aristichthys nobilis, Hypophthalmichthys molitrix,
Parabramis pekinensis, Ctenopharyngodon idellus, Ctenopharyngodon piceusand Zacco platypus) were either collected by local fishermen or caught by hook-and-line angling from a local river or lake, except goldfish, which were bought from a local market in Chongqing City in southwest China. Based on our data on local fishery catchment and water velocity where fish were collected, we classified the 12 species into three groups: rapid flow, intermediate flow and slow flow (Table 1). The fish were maintained in a re-circulating-water rearing system at Chongqing Normal University for at least 2 weeks prior to experimentation. During this time, the temperature of the de-chlorinated freshwater was maintained at 15.0±0.5°C and the oxygen content was maintained above 10 mg l−1. The
photoperiod was 12 h:12 h light:dark. One-tenth of the water was replaced daily with freshwater to maintain good water quality. Throughout the experimental period, the fish were fed daily to satiation with commercial forage until 48 h before the experimental trials. Fish were used only once in any experimental trial. All procedures were conducted in accordance with the national animal regulations.
Measurement of hypoxia indicators ASR50and LOE50
To quantify hypoxia tolerance, we determined the oxygen tension at which individual fish reached ASR50thresholds and LOE50thresholds during the
same experiment. Briefly, for a given species, three groups of 10 individual fish were transferred from the holding tank to a 30 l tank and held under continuous slow-flow-through conditions (for maintenance of water quality) for 4 h prior to the experiment. At the start of the experiment, a mesh screen was placed below the waterline to prevent the fish from accessing the water–air interface. Inflowing water was shut off and nitrogen gas was introduced into the tank to rapidly decrease DO from normoxic levels of ~10 mg l−1to 5 mg l−1, 2.5 mg l−1and then 1.2 mg l−1. Thereafter, the oxygen
tension was decreased in the same step-wise manner but in smaller steps of
0.1 mg l−1to a final DO level of 0 mg l−1. Fish were held for 1 h intervals at
each DO level and the change in DO between steps required less than 1 min. At each DO level, the total number of attempts of ASR and LOE were counted over 20 successive 3 min intervals. An attempt to perform ASR of individual fish was defined as the point where the fish made contact with the mesh surface suspended below the water–air interface and the ASR50
value of any fish group was defined as the point at which five of 10 individual fish made contact with the mesh surface suspended below the water–air interface for three consecutive observations. The elapsed time between ASR of the first and the fifth fish was 40 to 80 min in all species except goldfish and crucian carp that showed relatively large variation (1 to 4 h). LOE of individual fish was defined as the failure of the fish to maintain dorsoventral orientation and the LOE50value of any fish group was defined
as the DO point at which five of 10 individual fish failed to maintain a dorsoventral orientation for three consecutive observations. The elapsed time between LOE of the first and the fifth fish was 20 to 60 min in all experiment fish species except goldfish and crucian carp, which showed no LOE.
Determination of ṀO2,routand Pcrit
After 48 h fasting, 15 fish were randomly selected from each experimental group and placed in 160 ml respirometers for measurement of ṀO2,routand Pcrit(Zhang et al., 2010). The fish were allowed to recover from transfer to the respirometer for 4 h. During this time, continuously aerated water flowed (3 cm s−1) through the respirometer. Subsequently, the respirometer was
closed and ṀO2,routwas measured over a range of water DO values as the fish depleted the oxygen within the closed respirometer, beginning at ~95% saturation and decreasing to 1% saturation with a duration of 90 to 120 min. If the fish showed movements such as struggling and moving back and forth during the experiment, the data from the trial were discarded. To measure DO, the circulating water from the respirometer was drawn from the respirometer by a peristaltic pump, forced past a DO probe (HQ20, Hach Company, Loveland, CO, USA) housed in a sealed thermostated chamber, and then returned to the respirometer. The temperature of the system was maintained at 15±0.2°C.
The following formula was used to calculate the ṀO2,rout(mg kg−1h−1) of
individual fish:
ṀO2,rout= ([O2]k– [O2]k+1) V/ (t× Mb) , (1)
where [O2]kis the oxygen concentration (mg l−1) at time point kand [O2]k+1
is the oxygen concentration (mg l−1) at the next time point. These values
were calculated according to the O2solubility coefficient in water at the
corresponding temperature and pressure. Vis the total volume (l) of the respirometer minus the volume of the fish, tis the interval (h) between time points kand k+1, and Mbis the body mass (kg) of the fish. To account for effects of body size, the ṀO2,routwas adjusted to a standard body mass of 1 kg using a mass exponent of 0.75 (Reidy et al., 2000).
The Pcritis the point at which ṀO2,routcould no longer be maintained with a further reduction in the water O2 tension and was estimated for the
individual fish with the two-segment linear model described by Yeager and Ultsch (Yeager and Ultsch, 1989).
Acclimation to hypoxia
After the 2 week habituation period, the fish were fasted for 48 h, and 60 fish of similar size were randomly selected and divided into the hypoxia acclimation group and control acclimation group. The water temperature was maintained at 15°C. Thirty fish were transferred to a 120 l exposure chamber in which hypoxia was achieved by covering the surface of the water with translucent plastic and bubbling nitrogen into the water (Matey et al., 2008). The DO was reduced from aerated values of 10 to 0.3 mg l−1
over 1 h and was then maintained at 0.3 mg l−1for 48 h. During this time,
the water DO was continuously monitored using a DO probe.
Measurement of Ucrit
After 48 h acclimation to hypoxic or normoxic (control group) conditions, 20 fish were selected from each group and subjected to a critical swimming speed (Ucrit) test in either normoxic water (10 mg l−1, N=10) or hypoxic
The Journal of Experimental Biology
normoxic swimming conditions and from 1 to 1.2 mg l−1 for hypoxicswimming conditions.
A Brett-type swimming tunnel respirometer with a swim chamber with 19.87 cm2cross-sectional area was used to measure the Ucrit(total volume 3.5 l)
(for details, see Li et al., 2010; Pang et al., 2010) of the fish. The fish were individually transferred into the swim tunnel and allowed to recover in either normoxic or hypoxic water for 1 h (Fu et al., 2011). The water temperature in the swim chamber was controlled at 15±0.2°C. The water velocity was 3 cm s−1during the habituation period. The water velocity was increased in
5 cm s−1increments every 30 min until the fish became fatigued. Fatigue was
defined as the time at which the fish failed to move off the rear honeycomb screen of the swim chamber for 20 s (Lee et al., 2003). The Ucritwas calculated for the individual fish using Brett’s equation (Brett, 1964) as follows:
Ucrit= v+ (t/ T) Δv, (2)
where vis the fastest speed at which the fish swam for the entire time period (cm s−1), Δvis the velocity increment (5 cm s−1), Tis the prescribed period
of swimming per speed (30 min) and tis the length of time that the fish swam at the final speed (min). The swim tunnel was designed to switch between a closed mode and an open mode. The closed mode was for respirometry, and the open mode was to replenish the oxygen levels. In the open mode, the respirometer was supplied with 15°C water supplied from a 350 l reservoir tank at a flow rate of 500 ml min−1. For the normoxic
conditions, the water in the reservoir tank was fully aerated (10 mg l−1),
whereas for the hypoxic conditions, the surface of the reservoir tank was covered with translucent plastic and the water bubbled with nitrogen to achieve a nominal water DO of 1 mg l−1.
In the closed mode, the tunnel was isolated from the reservoir tank and water was recirculated within the system. A small volume of water was drawn from the sealed respirometer by a peristaltic pump, forced past a DO probe housed in a sealed temperature-controlled chamber, and then returned to the respirometer. The oxygen concentration (mg l−1) was recorded once every
2 min. The ṀO2(mg kg−1h−1) of the individual fish while swimming was
calculated from the depletion of oxygen according to the following equation:
ṀO2= 60mV/ Mb, (3)
where mis the slope (mg l−1min−1), i.e. the decrease in the water DO per
minute, Vis the total volume of the respirometer (3.5 l) minus the volume of the fish and Mbis the body mass (kg) of the fish. The slope was obtained through linear regression between time (min) and water DO (mg l−1). Only
slopes with an r2 >0.95 were considered for the analyses. During Ṁ O2
measurements, DO was never allowed to drop by more than 0.25 mg l−1in
either the normoxic or hypoxic Ucritdeterminations. ṀO2,maxwas defined as the maximal ṀO2during the Ucrittest. The metabolic rate was adjusted to a standard body mass of 1 kg using a mass exponent of 0.75 (Reidy et al., 2000).
Gill morphology
The gill morphology of only four fish species was evaluated, S. prenanti, O. sima, S. sinensisand Z. platypus, because the gill morphology change that was elicited by hypoxia acclimation of the other eight species has previously been performed by our laboratory (Dhillon et al., 2013) (Table 1).
After 48 h acclimation to hypoxic or control conditions, four fish from each group were immediately euthanised using neutralised tricaine methanesulphonate (MS-222, 50 mg l−1) and terminally sampled. The second
gill arch from the right side of each fish was removed, rinsed and immediately fixed in cold Karnovsky’s fixative for scanning electron microscopy (SEM) (at the Third Military Medical University, Chongqing, China).
The middle part of each fixed gill arch (5 mm) with up to 20 filaments in both the anterior and posterior rows was used for SEM. All fixed gill tissues were rinsed in phosphate-buffered saline and post-fixed in 1% osmium tetroxide for 1 h. The gill tissues were dehydrated in ascending concentrations of ethanol from 30% to 100%, critical-point dried with liquid CO2, mounted on stubs, sputter-coated with gold-palladium, and examined
with a Hitachi S 3400 scanning electron microscope (Hitachi High-Technologies Europe, Krefeld, Germany) at an accelerating voltage of 15 kV. The protruding lamella height was measured to estimate changes in the gill morphology.
Data analysis
SPSS Statistics 17 (IBM, Armonk, NY, USA) was used for data analysis. P -values <0.05 were considered statistically significant, and all data are presented as means ± s.e.m.
The effects of habitat and species (nested within habitat) on hypoxia tolerance and swimming performance (we only tested the swimming performance of control group measured under normoxic conditions) were determined by a nested analysis of covariance [ANCOVA; with body size (length or mass) used as the covariate]. One-way ANCOVA followed by a
post hocDuncan’s multiple-comparisons test was used to detect differences among habitats. The effect of species and DO (oxygen concentration in which the trait was measured), and their interaction on Ucritand ṀO2,maxwas
tested by two-way ANCOVA. The effect of hypoxia acclimation on Ucritand
Latin name
Carassius auratus AA
Carassius carassius CA Slow flow
Onychostoma sima OS Rapid flow Cyprinus carpio CC Slow flow
Parabramis pekinensis PP Intermediate flow Hypophthalmichthys molitrix HM Intermediate flow Aristichthys nobilis AN Slow flow
Ctenopharyngodon idellus CI Intermediate flow
Ctenopharyngodon piceus CP
Zacco platypus ZP
Schizothorax prenanti SP Rapid flow
Spinibarbus sinensis SS Rapid flow
Intermediate flow
Rapid flow Slow flow Habitat type Species abbreviation
Fig. 5. Phylogenetic relationship among the 12 experimental cyprinid species.The hierarchical topology tree was built based on data from Wang (Wang,
The Journal of Experimental Biology
ṀO2,max was detected using t-tests. For the 12 fish species, Pearson
correlation was used to examine the relationship between ASR50and LOE50,
and Pcritand ṀO2,rout.
We also conducted phylogenetically independent ANOVAs, which tested for differences in hypoxia tolerance and swimming performance (for the control group measured under normoxia) among species inhabiting environments under different flow conditions. We used the PDSIMUL and PDANOVA programs (Garland et al., 1993) to perform PICs. Using these programs, we simulated trait evolution as Brownian motion with the means and variances of the simulations set to the means and variances of the original data. We performed 1000 simulations, producing a null distribution of F-statistics against which the F-value of one-way ANOVA from the actual data could be compared to assess the statistical significance (i.e. we determined how different the observed patterns were from those expected via genetic drift alone). We constructed a best-estimate phylogenetic hypothesis for this group of species based on previous morphological and molecular studies (Fig. 5). All branch lengths were set as equal to one.
Competing interests
The authors declare no competing financial interests.
Author contributions
S.-J.F. conceived and designed the experiments. C.F., G.-J.Y., X.P., A.-J.Z. and S.-J.F. performed the experiments. Z.-D.C. and S.-J.F. analyzed the data. S.-J.F. wrote the paper.
Funding
This study was funded by the National Science Foundation of China (NSFC 31172096), the Key Project of Natural Science Foundation of CQ
(cstc2013jjB20003) and the Research Project of Chongqing Education Committee (KJ130624) granted to S.-J.F.
References
Abrahams, M. V., Mangel, M. and Hedges, K.(2007). Predator–prey interactions and changing environments: who benefits? Philos. Trans. R. Soc. B362, 2095-2104.
Barnes, K. R., King, H. and Carter, C. G.(2011). Hypoxia tolerance and oxygen regulation in Atlantic salmon, Salmo salarfrom a Tasmanian population. Aquaculture
318, 397-401.
Blake, R. W.(2004). Fish functional design and swimming performance. J. Fish Biol.
65, 1193-1222.
Brett, J. R.(1964). The respiratory metabolism and swimming performance of young sockeye salmon. Can. J. Fish. Aquat. Sci.21, 1183-1226.
Dhillon, R. S., Yao, L., Matey, V., Chen, B. J., Zhang, A. J., Cao, Z. D., Fu, S. J., Brauner, C. J., Wang, Y. S. and Richards, J. G.(2013). Interspecific differences in hypoxia-induced gill remodeling in carp. Physiol. Biochem. Zool.86, 727-739.
Fu, S. J., Brauner, C. J., Cao, Z. D., Richards, J. G., Peng, J. L., Dhillon, R. and Wang, Y. X.(2011). The effect of acclimation to hypoxia and sustained exercise on subsequent hypoxia tolerance and swimming performance in goldfish (Carassius auratus). J. Exp. Biol.214, 2080-2088.
Garland, T., Dickerman, A. W., Janis, C. M. and Jones, J. A.(1993). Phylogenetic analysis of covariance by computer simulation. Syst. Biol.42, 265-292.
Gregory, T. R. and Wood, C. M.(1998). Individual variation and interrelationships between swimming performance, growth rate, and feeding in juvenile rainbow trout (Oncorhynchus mykiss). Can. J. Fish. Aquat. Sci.55, 1583-1590.
Guppy, M. and Withers, P.(1999). Metabolic depression in animals: physiological perspectives and biochemical generalizations. Biol. Rev. Camb. Philos. Soc.74, 1-40.
Hochachka, P. W. (1986). Defense strategies against hypoxia and hypothermia. Science231, 234-241.
Howes, G. J.(1991). Systematics and biogeography: an overview. In Cyprinid Fishes: Systematics, Biology and Exploitation(ed. I. J. Winfield and J. S. Nelson), pp. 1-33. London: Chapman and Hall.
Lee, C. G., Farrell, A. P., Lotto, A., MacNutt, M. J., Hinch, S. G. and Healey, M. C.
(2003). The effect of temperature on swimming performance and oxygen consumption in adult sockeye (Oncorhynchus nerka) and coho (O. kisutch) salmon stocks. J. Exp. Biol.206, 3239-3251.
Li, X. M., Cao, Z. D., Fu, S. J. and Peng, J. L.(2010). The effect of exercise training on the metabolic interaction between digestion and locomotion in juvenile darkbarbel catfish (Peltebngrus vachelli). Comp. Biochem. Physiol.156A, 67-73.
MacNutt, M. J., Hinch, S. G., Farrell, A. P. and Topp, S.(2004). The effect of temperature and acclimation period on repeat swimming performance in cutthroat trout. J. Fish Biol.65, 342-353.
Mandic, M., Todgham, A. E. and Richards, J. G.(2009). Mechanisms and evolution of hypoxia tolerance in fish. Proc. R. Soc. B276, 735-744.
Mandic, M., Speers-Roesch, B. and Richards, J. G.(2013). Hypoxia tolerance in sculpins is associated with high anaerobic enzyme activity in brain but not in liver or muscle. Physiol. Biochem. Zool.86, 92-105.
Martínez, M. L., Raynard, E. L., Rees, B. B. and Chapman, L. J.(2011). Oxygen limitation and tissue metabolic potential of the African fish Barbus neumayeri: roles of native habitat and acclimatization. BMC Ecol.11, 2.
Matey, V., Richards, J. G., Wang, Y., Wood, C. M., Rogers, J., Davies, R., Murray, B. W., Chen, X. Q., Du, J. and Brauner, C. J.(2008). The effect of hypoxia on gill morphology and ionoregulatory status in the Lake Qinghai scaleless carp, Gymnocypris przewalskii. J. Exp. Biol.211, 1063-1074.
Mitrovic, D., Dymowska, A., Nilsson, G. E. and Perry, S. F.(2009). Physiological consequences of gill remodeling in goldfish (Carassius auratus) during exposure to long-term hypoxia. Am. J. Physiol.297R, 224-234.
Pang, X., Cao, Z. D., Peng, J. L. and Fu, S. J.(2010). The effects of feeding on the swimming performance and metabolic response of juvenile southern catfish, Silurus meridionalis, acclimated at different temperatures. Comp. Biochem. Physiol.155A, 253-258.
Plaut, I.(2001). Critical swimming speed: its ecological relevance. Comp. Biochem. Physiol.131A, 41-50.
Pollock, M. S., Clarke, L. M. J. and Dubé, M. G.(2007). The effects of hypoxia on fishes: from ecological relevance to physiological effects. Environ. Rev.15, 1-14.
Rabalais, N. N., Dĺaz, R. J., Levin, L. A., Turner, R. E., Gilbert, D. and Zhang, J.
(2010). Dynamics and distribution of natural and human-caused hypoxia. Biogeosciences7, 585-619.
Reidy, S. P., Kerr, S. R. and Nelson, J. A.(2000). Aerobic and anaerobic swimming performance of individual Atlantic cod. J. Exp. Biol.203, 347-357.
Sänger, A. M.(1993). Limits to the acclimation of fish muscle. Rev. Fish Biol. Fish.3, 1-15.
Shingles, A., McKenzie, D. J., Claireaux, G. and Domenici, P. (2005). Reflex cardioventilatory responses to hypoxia in the flathead gray mullet (Mugil cephalus) and their behavioral modulation by perceived threat of predation and water turbidity. Physiol. Biochem. Zool.78, 744-755.
Silkin, Y. A. and Silkina, E. N.(2005). Effect of hypoxia on physiological-biochemical blood parameters in some marine fish. J. Evol. Biochem. Physiol.41, 527-532.
Sloman, K. A., Wood, C. M., Scott, G. R., Wood, S., Kajimura, M., Johannsson, O. E., Almeida-Val, V. M. and Val, A. L.(2006). Tribute to R. G. Boutilier: the effect of size on the physiological and behavioural responses of oscar, Astronotus ocellatus, to hypoxia. J. Exp. Biol.209, 1197-1205.
Sloman, K. A., Mandic, M., Todgham, A. E., Fangue, N. A., Subrt, P. and Richards, J. G. (2008). The response of the tidepool sculpin, Oligocottus maculosus, to hypoxia in laboratory, mesocosm and field environments. Comp. Biochem. Physiol.
149A, 284-292.
Sollid, J., De Angelis, P., Gundersen, K. and Nilsson, G. E.(2003). Hypoxia induces adaptive and reversible gross morphological changes in crucian carp gills. J. Exp. Biol.206, 3667-3673.
Sollid, J., Weber, R. E. and Nilsson, G. E.(2005). Temperature alters the respiratory surface area of crucian carp Carassius carassiusand goldfish Carassius auratus. J. Exp. Biol.208, 1109-1116.
Takasusuki, J., Fernandes, M. N. and Severi, W.(1998). The occurrence of aerial respiration in Rhinelepis strigosaduring progressive hypoxia. J. Fish Biol.52, 369-379.
Ultsch, G. R., Boschung, H. and Ross, M. J.(1978). Metabolism, critical oxygen tension, and habitat selection in darters (Etheostoma). Ecology59, 99-107.
Wang, X. Z. (2005). Molecular Phylogeny of the East Asian Cyprinids (Pisces: Cypriniformes).Wuhan: Institute of Hydrobiology, Chinese Academy of Sciences.
Wells, R. M. G., Grigg, G. C., Beard, L. A. and Summers, G.(1989). Hypoxic responses in a fish from a stable environment: blood oxygen transport in the antarctic fish Pagothenia borchgrevinki. J. Exp. Biol.141, 97-111.
Yeager, D. P. and Ultsch, G. R.(1989). Physiological regulation and conformation: a basic program for the determination of critical points. Physiol. Zool.62, 888-907.