Relations
Liming Xu
International Doctoral Innovation Centre
University of Nottingham Ningbo China
Ningbo, Zhejiang, China [email protected]
Dave Towey
∗AIOP Group, School of Computer Science
University of Nottingham Ningbo China
Ningbo, Zhejiang, China [email protected]
Andrew P. French
School of Computer ScienceUniversity of Nottingham Nottingham, UK
Steve Benford
School of Computer ScienceUniversity of Nottingham Nottingham, UK
Zhi Quan Zhou
School of Computing and Information Technology
University of Wollongong Wollongong, NSW, Australia
Tsong Yueh Chen
Dept. of Computer Science andSoftware Engineering Swinburne University of Technology
Hawthorn, VIC, Australia [email protected]
ABSTRACT
We report on a novel use of metamorphic relations (MRs) in ma-chine learning: instead of conducting metamorphic testing, we use MRs for the augmentation of the machine learning algorithms themselves. In particular, we report on how MRs can enable en-hancements to an image classification problem of images containing hidden visual markers (“Artcodes”).
Working on an original classifier, and using the characteristics of two different categories of images, two MRs, based on separa-tionandocclusion, were used to improve the performance of the classifier. Our experimental results show that the MR-augmented classifier achieves better performance than the original classifier, algorithms, and extending the use of MRs beyond the context of software testing.
CCS CONCEPTS
•Software and its engineering→Software testing and de-bugging; •Computing methodologies→Supervised learn-ing by classification;Bagging;
KEYWORDS
Metamorphic testing, metamorphic relations, supervised classifica-tion, Artcodes, random forests
ACM Reference Format:
Liming Xu, Dave Towey, Andrew P. French, Steve Benford, Zhi Quan Zhou, and Tsong Yueh Chen. 2018. Enhancing Supervised Classifications with Metamorphic Relations. InProceedings of ACM Conference (Conference’17). ACM, New York, NY, USA, 8 pages. https://doi.org/10.1145/nnnnnnn.nnnnnnn
1
INTRODUCTION
Over the past two decades, machine learning techniques have been increasingly adopted by the research community to solve a range ∗Corresponding author.
Conference’17, July 2017, Washington, DC, USA 2018. ACM ISBN 978-x-xxxx-xxxx-x/YY/MM. . . $15.00 https://doi.org/10.1145/nnnnnnn.nnnnnnn
of practical problems. For researchers in the machine learning and software testing communities, building accurate learning models and verifying their quality are major topics. Due to the nature of machine learning programs, test oracles (mechanisms to determine if software behaviour is correct) are generally hard to define. Meta-morphic testing (MT) has been used to alleviate the oracle problem in testing machine learning software [25, 31, 32]. Machine learning techniques have also been used to identify metamorphic relations (MRs) [17]. MT has been used to further analyse classification re-sults of machine learning systems [4].
In the literature, MRs have been used in software verification and validation, and to assess the quality of software [34] — in this paper, we report on expanding the existing role of MRs to use as a kind ofpost adjustorto a machine learning program, to build a more accurate learning model. Compared to the reported use of MT in [4], in this paper, MR is used to adjust the both the inputs and outputs of a machine learning system. To the best of our knowledge, this is the first time MRs have been extended to such a use. Using an example of the Artcodes classification problem [33] — similar to QR codes [30], Artcodes are visual codes where bespoke designs can be scanned — we identify MRs for each category of inputs, and use them to augment the original classifier, improving its performance. The rest of this paper is organised as follows. Section 2 gives a brief explanation of metamorphic relations. Section 3 describes the Artcode classification. Section 4 presents the details of the augmented classifier. The experimental evaluation of the MR-augmented classifier’s performance is given in Section 5. Finally, Section 6 concludes the paper.
2
METAMORPHIC RELATIONS
Background
imagery
Recognisable
foreground
region
blob
Code - 1.1.2.3.5
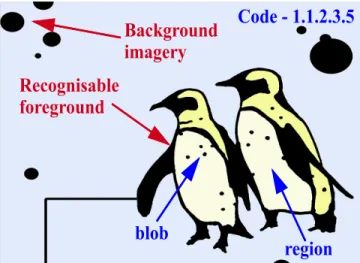
Figure 1: Illustration of the components of an Artcode.
tested systems [8, 9, 19]. Central to MT is a set of metamorphic relations (MRs), which are expected relations among the inputs and outputs of multiple executions of the intended program’s function-ality. Instead of examining the behaviour or output for an individual input, MT checks the SUT against selected MRs, with violations of an MR indicating the presence of a fault.
An example MR for a database management system is that the system should return the same results for a query with the search condition “A and B” and a query with the search condition “B and A”.
3
ARTCODE CLASSIFICATION
Artcodes1(Figure 1) are human-designable topological visual mark-ers, developed based on work in D-touch [11]. These computer-readable visual codes are embedded into images, allowing a designer to create codes that are machine-readable and meaningful to hu-mans. They combine the visibility of the QR codes and the secrecy of these “invisible” markers [2, 23]. As an augmented reality artefact, Artcodes can adorn everyday objects with decorative patterns that enhance their beauty while triggering digital interactions when scanned — interested readers are referred to Benford et al. [3] for more details of Artcodes applications.
An Artcode includes two parts: arecognisable foregroundand somebackground imagery, as shown in Figure 1. The recognisable part of an Artcode contains a closed boundary that is split into several regions (usually five), with each region containing one or moreblobs– solid objects disconnected from the region edge, as shown in Figure 2. Additionally, background imagery can be added to the core part of an Artcode to enhance the aesthetics, but only if the background does not break the Artcode’s topological structure. Moreover, Artcodes allow forredundancy, where multiple Artcodes with the same topology (but different geometry) can appear in an Artcode image. More information about Artcodes can be found, for example, in the work of Meese et al. [23].
1https://www.artcodes.co.uk/
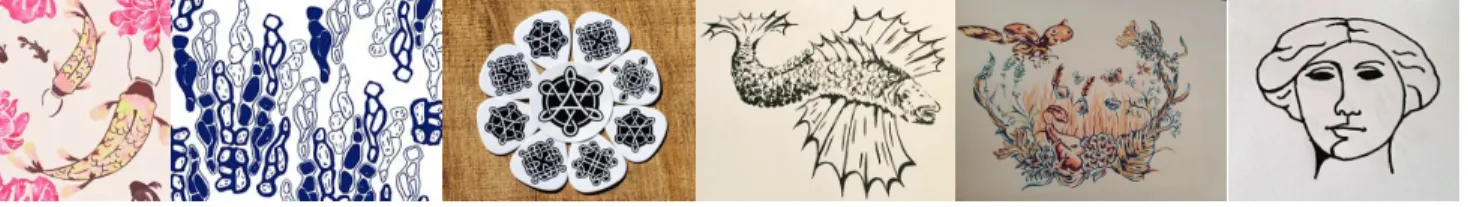
As can be seen from the examples in Figures 2 and 3, visually, there is no obvious difference in geometrical shape or appearance between Artcodes and non-Artcodes. The geometrical variations associated with Artcodes are very different to, and more relaxed than, those of other well-known markers, such as QR codes [30], or ARTags [13]. Identification of the presence of Artcodes is not possible through visual inspection alone (as may be the case for QR codes). To trigger people’s scan action and read the digital materials embedded in the Artcodes, it is necessary to detect their presence in the images or video sequence. This issue is referred toArtcode classificationordetection[33].
Artcode classification is a binary classification problem, classi-fying an input image or video sequence as either containing an Artcode or not — labelledArtcodeornon-Artcodeclasses, in this study. The Artcode class follows the topological definition of Art-codes, whereas thenon-Artcodeclass comprises images that do not conform to these topological rules.
4
AUGMENTED CLASSIFIER
Typically, the first step with conventional classifiers involves creat-ing feature vectors thatdistinctivelydescribe each class. Machine learning models can then be used to predict the class of individual inputs. To date, to the best of our knowledge, no attempt has been made to make use of the metamorphic properties or MRs inherent in classification problems to enhance or rectify the classification outputs. Inspired by the various successes of MT, we examined the Artcode classification domain to identify MRs which we then used to augment and enhance the original classifier.
The MRs were identified through observation of the impact on classification results among different classes (or labels, e.g. Artcode or non-Artcode) when feeding in predefined inputs. In particular, the MRs allowed us to express probabilistically the likelihood of a modified input being Artcode or not based on the original classifier’s classification (after performing the operations). This use of MRs in classification is different from that usually found in MT, which examines for MR violations to decide whether or not faults exist in the SUT; in contrast, our use of MRshelps make a probabilistic classification decisionas to whether the input is an Artcode or not. In the rest of this section, we describe the non MR-augmented classifier (the original classifier) that we used for Artcodes clas-sification. We then explain how to augment this classifier with metamorphic relations identified from the classification model and input categories.
4.1
Original classifier
For Artcode classification, we built a classifier based on the shape of orientation histograms (SOH) [33] of input images and ran-dom forests [5]. The classifier makes use of SOH feature vectors, which describe the symmetry and smoothness of the orientation histogram [15] of input images. Random forests were then trained using these feature vectors.
Figure 2: Artcode examples from the Artcodes Dataset.
Figure 3: Non-Artcode examples from the Artcodes Dataset
(a) Separation masks (b) Occlusion masks
Figure 4: Separation and occlusion masks
describing the geometry or structure of fixed objects, SOH is used to describe the topological structure of images through analysis of the symmetry and smoothness of the orientation histogram. The SOH is constructed by quantifying these two aspects of the orientation histogram using similarity measurements such as procrustes [24] or Chi-squared (χ2) distance [26].
After calculation of the SOH feature vector of each image, ran-dom forests were trained and used to predict the newly input image. As an ensemble learning method, a random forest has a number of attractive features. It is accurate, robust, and interpretable, and with little tuning required [5]. The effect of overfitting is seldom an issue, and it only requires a small amount of parameter tuning – the original classifier only tunes one parameter, the number of decision trees (nTrees) in the forests. Therefore, it is an appropriate method to be used in Artcode classification.
4.2
Metamorphic relations
As described in Section 3, Artcodes are composed of a number of connected regions. Each region is an independent entity that con-tains several solid blobs, and therefore has a complete topological structure. Additionally, an Artcode image might contain several independent Artcodes, which means that parts of Artcode images are likely to be complete regions or Artcodes themselves. In other words, parts of Artcodes are “simplified” Artcodes which will be classified as “Artcodes” by the original classifier with a relatively high probability. On the other hand, non-Artcode images (ideally) should not have those characteristics: parts of non-Artcode images do not have the predefined topology, and they will be treated as “non-Artcodes” by the original classifier. Therefore, parts of Artcode images are more likely to be classified as “Artcodes” than parts of
non-Artcode images. Based on this observation, and the character-istics of the original classifier, we identified two MRs:Separation andOcclusion.
MR1-Separation.Separation involves splitting the input im-age uniformly into a number of sections, orblocks. For example, Figure 4(a) presents separation masks to generate four uniform blocks by intersecting them with input images. This MR is based on the observation that the blocks of Artcodes could be classified as “Artcode” with a higher probability than the blocks of non-Artcode images. If we select the number of blocks appropriately, this differ-ence in the total probability of all blocks may provide more clues for classification. MR1-Separation can be formulated as:
n X
i=1
Pr(BiSa)≥
n X
i=1
Pr(BiSn) (1) wherenis the number of image blocks; Pr() is the probability to be classified as Artcode by the original classifier; andBiS
a and BiSn denote theith block of the Artcode and non-Artcode image generated after MR-Separation, respectively.
MR2-Occlusion.Occlusion is similar to Separation, but the image blocks are not separated uniformly — blocks with overlapped areas are permitted. As shown in Figure 4(b), four occlusion masks are provided to intersect with the input image and output the image blocks outlined by white regions. Based on this, we have:
m X
i=1
Pr(BiOa)≥
m X
i=1
Pr(BOni ) (2) Occluded images generally keep half of the properties of the input images: half Artcode images have a high probability to be classified as “Artcode” by the original classifier, occluded images of non-Artcodes are still as likely to be labeled as “non-Artcode.”
Pr(BOai )≥Pr(BiSa) (3) wheremis the number of masks;BiOa = ∩(Ia,Mi)andBOni =
Original Classifier
SOH feature
vector
Classifiers e.g., RF, SVM
Input image
Occlusion - split input image into m overlapping blocks Separation - uniformly split input image into n blocks
Image blocks Total Probability Calculation
Prediction vector P
Rectified by thresholds T1 and T2 Weight
vector W
Output Class:
Artcode or non-Artcode Layer 1 - Follow-up input generation Layer 2 - Prediction Layer 3 - Rectification
B1
Bn
B1
Bm Image transformations
T = <P,W>
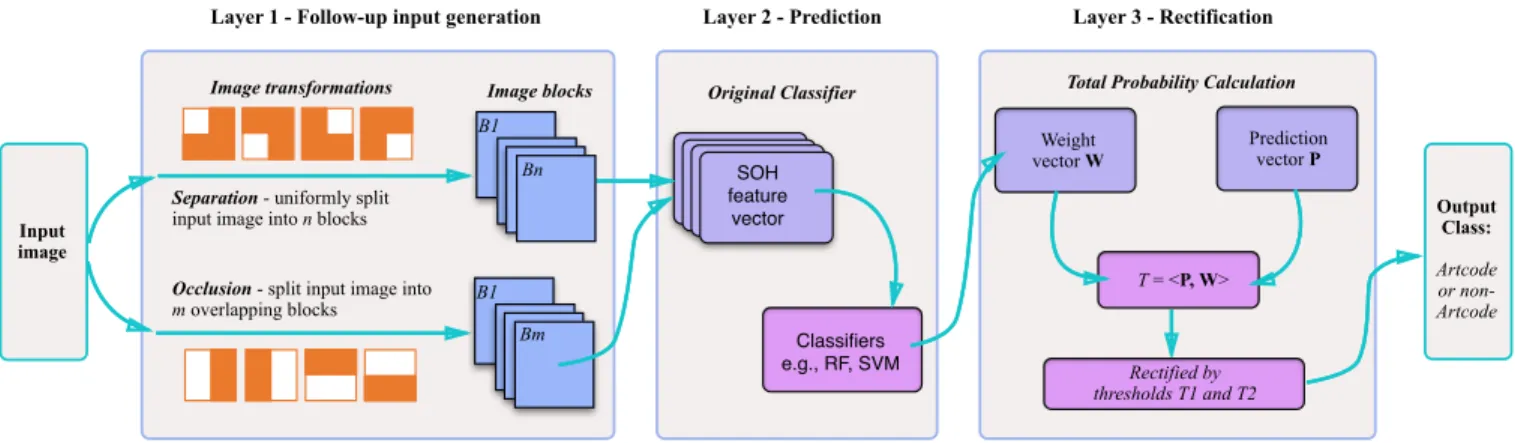
Figure 5: The MR-augmented classifier framework. This framework includes three stages: Follow-up input generation, Pre-diction, and Rectification. Follow-up input generation involves splitting the input image into blocks based on the two MRs; Prediction makes predictions of these image blocks using the original classifier; and Rectification involves the calculation of the total probability (p) of belonging to the Artcode, and then rectifies the predictions of the original classifier on the basis of thepvalue and the two predefined thresholdst1andt2.
ith block of the Artcode and non-Artcode images generated after MR-Occlusion, respectively.
We next explain how to use these relations to enhance the clas-sification performance.
4.3
MR-augmented classifier
Unlike most deterministic software, classification is based on statis-tics, or is learned from prior experience. Given an input, the output of the classifier is a probabilistic classification of belonging to a class or not. In other words, after execution of the classifier, we only learn the probability of an input to be classified as a partic-ular class or not. Therefore, to enable incorporation of the MRs described above, we designed an augmented classifier integrating the identified MRs, and adding an adjustor (or rectifier) to the orig-inal classifier. As shown in Figure 5, the augmented classifier first separates the input image into a number of blocks following the rules of MR1-Separation and MR2-Occlusion, and then predicts the label for each block using the original classifier, producing the prediction vector. As defined in Equations 1, 2 and 3, the probability of each class generated by separation and occlusion is different, and therefore we give differentweightsto them, thereby constructing a weight vector, which has the same dimensionality as the prediction vector. Given a prediction vectorv=(c1, ...,cN)and weight vector
w =(w1, ...,wN), where eachci is the predicted class of theith
block according to the original classifier;wiis the weight assigned to theith block; andNis the dimensionality of both vectors (and is equal to the total amount of blocks in separation and occlusion), the inner product ofvandw(p=v·w=PN
i=1ci×wi) is the
prob-ability of belonging to the Artcode class (pvalue). The augmented classifier predicts the class of the input depending on the value of
pand the given thresholdst1andt2, using the following decision
rules: ifp≥t2, then it is Artcode; ifp<t1, then it is non-Artcode;
otherwise, the input retains the original classifier’s predicted class.
5
EXPERIMENTAL EVALUATION
5.1
Dataset
In order to study the Artcodes classification problem, we created a dataset containing 47 Artcode and 116 non-Artcode images. The non-Artcode images (comprising logos, drawings, and graphics) were all created by humans, and were deliberately selected such that they would appear very similar to actual Artcode images. This means that this dataset is very challenging for Artcodes classifi-cation. Because Artcodes are manually created by designers, the number of available Artcodes is currently small, but work is ongo-ing to extend the dataset.
5.2
Cross validation
Cross-validation is a commonly used model validation technique for assessing how a learning model will generalize to a dataset [12, 18]. One of the main reasons for using cross-validation rather than con-ventional validation (partitioning the dataset into two sets of 70% for training and 30% for testing) is that there is not sufficient data available to partition into separate training and test sets without losing significant modeling or testing capability. In these cases, a fair way to properly estimate model prediction performance is to use cross-validation [29]. We usedk-fold cross-validation, which in-volves randomly partitioning a dataset intokequally-sized subsets, and keeping one single subset as the validation data for testing the trained model, and using the remainingk−1 subsets as training data. The cross-validation process is then repeatedktimes (thefolds). Considering the limited number of samples in the Artcodes dataset, a 5-fold cross-validation was used to ensure sufficient training and testing set sizes for the performance evaluation.
5.3
Experimental setting
10 20 40 60 80 100 120 140150
nTrees
0 0.2 0.4 0.6 0.8
Precision
Augmented Original
(a) Precision
10 20 40 60 80 100 120 140150
nTrees
0 0.2 0.4 0.6 0.8
Recall
Augmented Original
(b) Recall
10 20 40 60 80 100 120 140150 nTrees
0.5 0.6 0.7 0.8 0.9
Accuracy
Augmented Original
(c) Accuracy
10 20 40 60 80 100 120 140150 nTrees
0 0.1 0.2 0.3 0.4 0.5 0.6
F2 measure
Augmented Original
(d) F2measure
10 20 40 60 80 100 120 140150
nTrees -0.2
0 0.2 0.4 0.6
MCC
Augmented Original
(e) Matthews correlation coefficient (MCC)
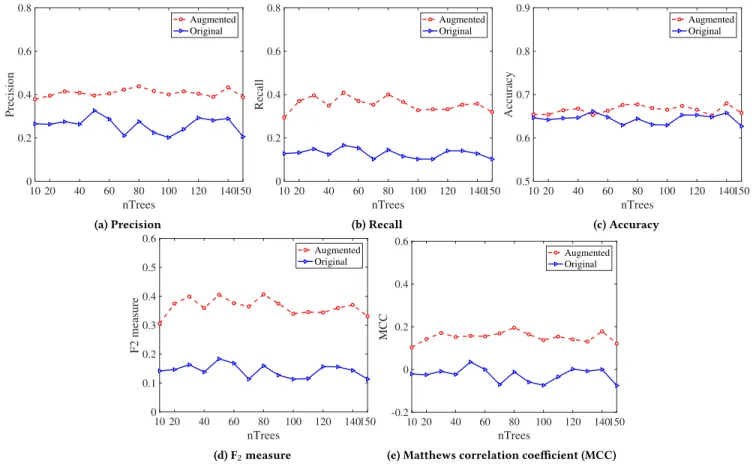
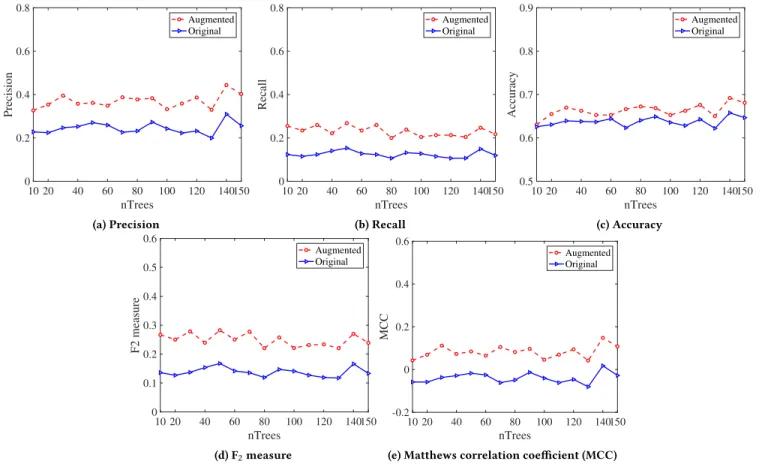
Figure 6: Performance comparison between the original and MR-augmented classifier with differentnT reesvalues andt1,t2=
0.2.
Table 1: Confusion matrix
Predicted
Artcode non-Artcode
Actual Artcode True Positive (TP) False Negative (FN) non-Artcode False Positive (FP) True Negative (TN)
MR-augmented classifier with the original classifier presented in Section 4.1. Because random forests are used in the classifier, the performance exhibits a certain level of variation on each execution due to the random variable selection from the feature vector. Ten runs of cross-validation were therefore conducted to calculate the average performance.
Considering the imbalance of the dataset (with more non-Artcode images) we selected five performance metrics to provide an infor-mative view of the augmented classifier’s performance:Precision, Reall,Accuracy,F2measure, andMCC(Matthews correlation
coeffi-cient) [22]. These five measures are calculated based on a confusion matrix (Table 1). A confusion matrix, also known as an error matrix, is a specific table layout that allows visualization of the performance of an algorithm — each row represents the instances in an actual class while each column represents the instances in a predicted class (or vice versa) [27].
Precision= T P
T P+F P (4)
Recall = T P
T P+F N (5)
Accuracy= T P+T N
T P+F P+F N+T N (6)
Accuracy (as defined in Equation 6) is the overall proportion of correct predictions, for both the Artcodes and non-Artcodes class, and is a simple way of describing a classifier’s performance on a given dataset. However, Accuracy is sensitive to the dataset’s imbalance. F2measure is a special case of the Fβmeasure:
Fβ= (1+β
2)·Precision·Recall
β2·Precision+Recall (7)
whereβ = 2. As shown in Equations 4 and 5, Precision is the proportion of true positives among the all predicted positives, and Recall is the proportion of true positives over the total amount of actual positives. The F2measure uses a weighted average of
Precision and Recall to evaluate the classification effectiveness, giving twice as much importance to recall as to precision.
Compared with Accuracy, the F2measure provides more insight
10 20 40 60 80 100 120 140150
nTrees
0 0.2 0.4 0.6 0.8
Precision
Augmented Original
(a) Precision
10 20 40 60 80 100 120 140150
nTrees
0 0.2 0.4 0.6 0.8
Recall
Augmented Original
(b) Recall
10 20 40 60 80 100 120 140150 nTrees
0.5 0.6 0.7 0.8 0.9
Accuracy
Augmented Original
(c) Accuracy
10 20 40 60 80 100 120 140150 nTrees
0 0.1 0.2 0.3 0.4 0.5 0.6
F2 measure
Augmented Original
(d) F2measure
10 20 40 60 80 100 120 140150
nTrees -0.2
0 0.2 0.4 0.6
MCC
Augmented Original
(e) Matthews correlation coefficient (MCC)
Figure 7: Performance comparison between the original and MR-augmented classifier with differentnT rees values andt1 =
0.15,t2=0.3.
between the observed and predicted classifications, incorporating true and false positives and negatives.
MCC=p T P·T N−F P·F N
(T P+F P)(T P+F N)(T N+F P)(T N+F N) (8)
MCC is generally regarded as one of the best measures for clas-sifier performance evaluation [27], and remains effective even if the dataset is imbalanced. The tuning parameters — the number of decision trees (nTrees) in the random forests, and the thresholdst1
andt2— were studied in the experiment, as was their impact on
the classifier.
The values oft1andt2are strongly related to the given values
in the weight vector, and, according to Equation 3, the weights of blocks generated by Occlusion are greater than those for Separation. We separated the input images uniformly into four blocks, and overlapped with four occlusion masks, and thus had 8-dimensional prediction and weight vectors. Assuming we assignxto Pr(BOai )
and Pr(BiO
n)andyto Pr(B i
Sa)and Pr(B i
Sn)(x >y), as the total
amount of weight vector is 1, then we havex+y=0.25,(x >y). Any combinations of values ofx andysatisfying this condition can be used as the weights. For computational simplicity, in this experiment, we assigned both Pr(BiSa)and Pr(BiSn)a value of 0.1,
and Pr(BiOa)and Pr(BiOn)both a value of 0.15, which gave the
resulting weight vector:
w=(0.1,0.1,0.1,0.1,0.15,0.15,0.15,0.15)
To simplify calculations, we also used 1 and 0 in the prediction vectorpto represent the “Artcode” and “non-Artcode” classes, re-spectively.
5.4
Experimental results
All performance metric values reported are the average values calculated from ten executions ofk-fold cross-validation [18]. As explained in Section 5.2, because of the limited number of samples in the Artcodes dataset, a 5-fold cross-validation was used to en-sure sufficient training and testing set sizes for the performance evaluation. Two combinations of the thresholdst1andt2combined
with different numbers of nTrees were used to study the classifier’s tuning parameters. In all graphs in Figures 6 and 7, higher values indicate better performance.
For various numbers of nTrees and fixed thresholdst1andt2, the
augmented classifier outperforms the original classifier in terms of all five metrics. The augmented classifier performs better in terms of both precision (Figures 6(a) and 7(a)) and recall (Figures 6(b) and 7(b)) than the original classifier, with an average of about 10-15% improvement for both threshold combinations. As shown in Fig-ures 6(c) and 7(c), for both threshold combinations, the augmented classifier has slightly better Accuracy than the original classifier, about 2-3% improvement on average. Although the MR-augmented classifier shows improved performance with the Artcodes class, the small percentage of artcodes in the dataset does not contribute strongly to the overall evaluation of Accuracy, which is influenced by both true positives and true negatives.
In contrast, F2measure and MCC are more informative
mea-sures of overall performance, even when the dataset is imbalanced. As shown in Figures 6(d)(e) and 7(d)(e), the augmented classifier obtains better values (approximately 15-20% improvement) than the original for different numbers of nTrees, showing an overall improved performance of the MR-augmented classifier. However, due to the imbalance of the dataset, the MCC values for the two classifiers are relatively low.
Overall, the MR-augmented classifier achieves improved per-formance according to the five evaluation metrics. This improved performance is sensitive to the threshold values fort1andt2, but
not to nTrees. The impact of nTrees on the classifier’s performance is relatively small, but larger numbers of nTrees require more time to train the classifier and make the classification predictions. Thus, careful selection of the tuning parameter values is necessary to ensure the performance improvement of the original classifier.
6
CONCLUSION
In this paper, we have reported on a study using metamorphic rela-tions (MRs) to improve binary classification in machine learning. To the best of our knowledge, this is the first use of MRs in such an application. Two MRs were identified based on properties of the input data and the usage of the classification model, and an augmented classifier using these two MRs was designed to show the applicability of the technique. Experimental evaluation showed the performance improvement across certain aspects of the orig-inal classifier, demonstrating the potential to apply MT theories and techniques to machine learning applications. The experimental evaluation also showed the importance of the tuning parameters
t1andt2on the performance of the augmented classifier. Our
fu-ture work will include further examination of other parameters, including the number of blocks in the separation and occlusion MRs, the given values of the weight vector, and the adaptive values of thresholdst1andt2.
Although this has been a preliminary study, the results are very promising, and clearly demonstrate the potential for MR-augmentation of classifiers. More practical and theoretical work will be necessary to fully investigate this new research direction, including more case studies examining application of MRs to other well-known machine learning problems, such as face and object detection.
ACKNOWLEDGMENTS
The authors acknowledge the financial support from the Inter-national Doctoral Innovation Centre, Ningbo Education Bureau, Ningbo Science and Technology Bureau, and the University of Nottingham. This work was supported by grants from the UK Engineering and Physical Science Research Council (Grant No. EP/L015463/1), the National Natural Science Foundation of China (Grant No. 71471092) and the Ningbo Science and Technology Bu-reau (Grant No. 2014A35006).
REFERENCES
[1] Earl T. Barr, Mark Harman, Phil McMminn, Muzammil Shahbaz, and Shin Yoo. 2015. The Oracle Problem in Software Testing: A Survey.IEEE Transactions on Software Engineering41, 5 (2015), 507–525.
[2] Steve Benford, Adrian Hazzard, and Liming Xu. 2015. The Carolan guitar: a thing that tells its own life story.Interactions22, 3 (April 2015), 64–66.
[3] Steve Benford, Boriana Koleva, Anthony Quinn, Emily-Clare Thorn, Kevin Glover, William Preston, Adrian Hazzard, Stefan Rennick-Egglestone, Chris Greenhalgh, and Richard Mortier. 2017. Crafting Interactive Decoration.ACM Transactions on Computer-Human Interaction (TOCHI) Comput.-Hum. Interact.24, 4, Article 26 (August 2017), 39 pages.
[4] Wing Kwong Chan, Jeffrey C. F. Ho, and T. H. Tse. 2010. Finding failures from passed test cases: Improving the pattern classification approach to the testing of mesh simplification programs.Software Testing, Verification and Reliability20, 2 (2010), 89–120.
[5] Leo Breiman. 2001. Random forests.Machine learning45, 1 (2001), 5–32. [6] Tsong Yueh Chen, Shing Chi Cheung, and Shiu Ming Yiu. 1998. Metamorphic
testing: a new approach for generating next test cases.Technical Report HKUST-CS98-01, Dept. of Computer Science, Hong Kong Univ. of Science and Technology (1998).
[7] Tsong Yueh Chen, Fei-Ching Kuo, Huai Liu, Pak-Lok Poon, Dave Towey, T. H. Tse, and Zhi Quan Zhou. 2018. Metamorphic testing: A review of challenge and opportunities. 51, 1 (2018), 4:1-4:27. ACM Computing Surveys.
[8] Tsong Yueh Chen, Fei-Ching Kuo, Wenjuan Ma, Willy Susilo, Dave Towey, Jeffrey Voas, and Zhi Quan Zhou. 2016. Metamorphic testing for cybersecurity.Computer 49, 6 (2016), 48–55.
[9] Tsong Yueh Chen, Fei-Ching Kuo, Dave Towey, and Zhi Quan Zhou. 2015. A revisit of three studies related to random testing.SCIENCE CHINA Information Sciences58, 5, Article 52104 (2015), 052104:1–052104:9 pages.
[10] Tsong Yueh Chen, T. H. Tse, and Zhi Quan Zhou. 2003. Fault-based testing without the need of oracles.Information and Software Technology45, 1 (2003), 1–9.
[11] Enrico Costanza and Jeffrey Huang. 2009. Designable visual markers. In Proceed-ings of the SIGCHI Conference on Human Factors in Computing Systems. ACM, 1879–1888.
[12] Pierre A. Devijver and Josef Kittler. 1982.Pattern recognition: A statistical approach. Prentice Hall, London, UK.
[13] Mark Fiala. 2005. ARTag, a fiducial marker system using digital techniques. In Proceedings of 2005 IEEE Computer Society Conference on Computer Vision and Pattern Recognition (CVPR’05), Vol. 2. IEEE, San Diego, CA, USA, 590–596. [14] William T. Freeman and Edward H. Adelson. 1991. The design and use of steerable
filters.IEEE Transactions on Pattern analysis and machine intelligence13, 9 (1991), 891–906.
[15] William T. Freeman and Michal Roth. 1995. Orientation histograms for hand gesture recognition. InInternational workshop on automatic face and gesture recognition, Vol. 12. 296–301.
[16] Darryl C. Jarman, Zhi Quan Zhou, and Tsong Yueh Chen. 2017. Metamorphic Testing for Adobe Data Analytics Software. InProceedings of the 2nd International Workshop on Metamorphic Testing (MET ’17, in conjunction with ICSE 2017 ). IEEE Press, Piscataway, NJ, USA, 21–27.
[17] Upulee Kanewala and James M Bieman. 2013. Using machine learning techniques to detect metamorphic relations for programs without test oracles. InProceedings of the 24th International Symposium on Software Reliability Engineering (ISSRE’13). IEEE, Pasadena, CA, USA, 1–10.
[18] Ron Kohavi. 1995. A study of cross-validation and bootstrap for accuracy estima-tion and model selecestima-tion. InProceedings of the 14th international joint conference on Artificial intelligence (IJCAI’95), Vol. 2. Morgan Kaufmann Publishers Inc., Montreal, Quebec, Canada, 1137–1143.
[20] Mikael Lindvall, Dharmalingam Ganesan, Ragnar Árdal, and Robert E. Wiegand. 2015. Metamorphic Model-based Testing Applied on NASA DAT: An Experience Report. InProceedings of the 37th International Conference on Software Engineering (ICSE’15), Vol. 2. IEEE, Florence, Italy, 129–138.
[21] Huai Liu, Fei-Ching Kuo, Dave Towey, and Tsong Yueh Chen. 2014. How Effec-tively does Metamorphic Testing Alleviate the Oracle Problem?IEEE Transactions on Software Engineering40, 1 (Jan 2014), 4–22.
[22] Brian Matthews. 1975. Comparison of the predicted and observed secondary structure of T4 phage lysozyme.Biochimica et Biophysica Acta (BBA)-Protein Structure405, 2 (1975), 442–451.
[23] Rupert Meese, Shakir Ali, Emily-Clare Thorne, Steve Benford, Anthony Quinn, Richard Mortier, Boriana Koleva, Tony Pridmore, and Sharon L. Baurley. 2013. From codes to patterns: designing interactive decoration for tableware. In Proceed-ings of the SIGCHI Conference on Human Factors in Computing Systems (CHI’13). ACM, Paris, France, 931–940.
[24] Jürgen Moser. 1965. On the volume elements on a manifold.Transactions of the American Mathmatical. Society.120, 2 (1965), 286–294.
[25] Christian Murphy, Gail Kaiser, Lifeng Hu, and Leon Wu. 2008. Properties of Ma-chine Learning Applications for Use in Metamorphic Testing. InProceedings of the 20th International Conference on Software Engineering and Knowledge Engineering (SEKE’08). Redwood City, CA, USA, 867–872.
[26] Karl Pearson. 1900. X. On the criterion that a given system of deviations from the probable in the case of a correlated system of variables is such that it can be reasonably supposed to have arisen from random sampling. The London, Edinburgh, and Dublin Philosophical Magazine and Journal of Science50, 302 (1900), 157–175.
[27] David M. W. Powers. 2011. Evaluation: From precision, recall and f-measure to roc., informedness, markedness & correlation.Journal of Machine Learning Technologies2, 1 (2011), 37–63.
[28] Sergio Segura, Gordon Fraser, Ana Sanchez, and Antonio Ruiz-Cortés. 2016. A Survey on Metamorphic Testing.IEEE Transactions on Software Engineering42 (2016), 805–824.
[29] Giovanni Seni and John Elder. 2010. Ensemble methods in data mining: improving accuracy through combining predictions.Synthesis Lectures on Data Mining and Knowledge Discovery2, 1 (2010), 1–126.
[30] D Wave. 2015. Information technology automatic identification and data capture techniques QR code bar code symbology specification.International Organization for Standardization, ISO/IEC18004 (2015).
[31] Xiaoyuan Xie, Joshua Ho, Christian Murphy, Gail Kaiser, Baowen Xu, and Tsong Yueh Chen. 2009. Application of metamorphic testing to supervised classifiers. InProceedings of the 9th International Conference on Quality Software (QSIC’09). IEEE, Jeju, Korea, 135–144.
[32] Xiaoyuan Xie, Joshua WK Ho, Christian Murphy, Gail Kaiser, Baowen Xu, and Tsong Yueh Chen. 2011. Testing and validating machine learning classifiers by metamorphic testing.Journal of Systems and Software84, 4 (2011), 544–558. [33] Liming Xu, Andrew P. French, Dave Towey, and Steve Benford. 2017. Recognizing
the Presence of Hidden Visual Markers in Digital Images. InProceedings of the on Thematic Workshops of ACM Multimedia 2017 (Thematic Workshops ’17). ACM, Mountain View, California, USA, 210–218.