arXiv:1808.00530v1 [astro-ph.GA] 1 Aug 2018
OMEGA – OSIRIS Mapping of Emission-line Galaxies in A901/2:
IV. – Extinction of Star-Formation Estimators with Inclination
Christian Wolf
1,2, Tim Weinzirl
3, Alfonso Arag´on-Salamanca
2,3, Meghan E. Gray
3,
Bruno Rodr´ıguez del Pino
4, Ana L. Chies-Santos
5, Steven P. Bamford
3,
Asmus B¨ohm
6, Katherine Harborne
3,71Research School of Astronomy and Astrophysics, Australian National University, Canberra ACT 2611, Australia, E-mail: [email protected]
2Australian Research Council (ARC) Centre of Excellence in All-Sky Astrophysics (CAASTRO)
3School of Physics and Astronomy, The University of Nottingham, University Park, Nottingham, NG7 2RD, UK
4Centro de Astrobiolog´ıa, INTA-CSIC, Madrid, Spain
5Departamento de Astronomia, Instituto de Fsica, Universidade Federal do Rio Grande do Sul, Porto Alegre, R.S, Brazil
6Department of Astrophysics, University of Vienna, T¨urkenschanzstr. 17, 1180 Vienna, Austria
7International Centre for Radio Astronomy (ICRAR), The University of Western Australia, Crawley, WA 6009, Australia
draft 3 August 2018
ABSTRACT
We study the effect of inclination on the apparent brightness of star-forming galaxies in spec-tral passbands that are commonly used as star-formation indicators. As diagnostics we use mass-to-light ratios in three passbands: the UV continuum at 280 nm, the Hαemission line, and the FIR 24µ-band. We include a study of inclination trends in the IR/UV ratio (“IRX”) and the IR/Hαratio. Our sample comprises a few hundred galaxies from the region around the clusters Abell 901/902 with deep data and inclinations measured from outer disks inHubble Space Telescopeimages. As a novelty, the Hα- and separately the NII-emission are measured by tunable-filter imaging and encompass galaxies in their entirety. At galaxy stellar masses abovelogM∗/M⊙ & 10we find trends in the UV and Hαmass-to-light ratio that suggest
an inclination-induced attenuation from face-on to edge-on of ∼ 1mag and ∼ 0.7mag in UV and Hα, respectively, implying that star-formation rates of edge-on galaxies would be underestimated by∼2.5×in UV and∼2×in Hα. We find the luminosities in UV and Hα to be well correlated, but the optical depth of diffuse dust that causes inclination dependence appears to be lower for stars emitting at 280 nm than for gas clouds emitting Balmer lines. For galaxies withlogM∗/M⊙.9.7, we find no measurable effect at>0.1mag. The absence of
an inclination dependence at 24µconfirms that the average galaxy is optically thin in the FIR.
Key words: galaxies: general – galaxies: clusters: general – galaxies: star formation – dust,
extinction – infrared: galaxies – ultraviolet: galaxies
1 INTRODUCTION
The appearance of galaxies is largely determined by their luminous components, i.e. stars and ionised gas clouds. A second factor is extinction of galaxy light due to dust inside them, where geometry and amount of dust determine how a galaxy appears from different viewing angles. Star-forming disk galaxies are the most common type of galaxy, and they contain a fair amount of dust, mostly in a disk thinner than the stellar disk (Xilouris et al. 1999), at least in galaxies that are large enough to be ordered by significant rotation (Dalcanton et al. 2004).
Disk galaxies viewed edge-on usually display impressive dust bands that clearly obscure much of a galaxy’s stars and gas clouds, while those seen face-on show their dust more as a filigree pattern woven subtly into their spiral arms. This difference in prominence
Many details of the spatial distribution between luminous components and absorbing dust are important for the appear-ance of a galaxy in different spectral passbands, as discussed e.g. by Popescu et al. (2011). However, the viewing angle of a galaxy, or inclination, is still an obvious primary ordering pa-rameter that can be easily measured. Hence, several past works have considered the effect of inclination on the apparent sizes, concentration, brightness and colour of galaxies (e.g. Holmberg 1958; Giovanelli et al. 1994; Tully et al. 1998; Masters et al. 2003; Driver et al. 2007; Cho & Park 2009; Maller et al. 2009; Masters et al. 2010; Wild et al. 2011; Devour & Bell 2016, 2017; Battisti et al. 2017). It is found that the inclination of a galaxy affects estimates of its physical properties, such as the popu-lation mix and total mass of its stars (see review by Conroy 2013); when considering samples of galaxies it causes an under-estimation of the average cosmic matter density (e.g. Driver et al. 2007); it complicates attempts to understand galaxy evolution from comparisons with simulations (e.g. Somerville & Primack 1999; McKinnon et al. 2017); and it causes apparently random, flux-limited samples of galaxies to suffer from selective incompleteness that even affects cosmological studies; finally, measurements of the star-formation rate are affected by inclination (Morselli et al. 2016; Leslie et al. 2018).
On the other hand, changes in galaxy appearance with in-clination are an opportunity to learn about the dust itself. A first step towards a more structured picture of dust is a two-component model (e.g. Lonsdale Persson & Helou 1987; Charlot & Fall 2000; Tuffs et al. 2004) with diffuse dust and clumpy dust: diffuse cirrus-like dust pervades the disk of the Milky Way and other galaxies with a high fill factor at low density, while high-density dust clumps enshroud the birth clouds of stars with high optical depth but mod-erate and constantly evolving covering factors as the radiation from the new-born stars blows away the dust within less than ten million years.
Most observations to date appear consistent with this two-component picture (e.g. Wild et al. 2011), including the fact that Balmer emission from star-forming regions is more extinguished than the stellar continuum of older stars by a factor of two or more (Kennicutt 1983; Calzetti et al. 1994; Yip et al. 2010; Hao et al. 2011; Wild et al. 2011) due to high optical depth of the dusty birth clouds. When galaxies are inclined in the two-component model, the line-of-sight through cirrus becomes longer and the op-tical depth of dust larger; however, the total extinction of new-born stars embedded in birth clouds increases less in relative terms than the extinction of older stars, whose face-on extinction by the low-density cirrus is expected to be mild. As the extinction of stars de-pends not only on inclination but also age, the effective attenuation curves of the integrated stellar population in a galaxy may change with inclination. Effective attenuation curves are light-weighted and thus susceptible to changes in the apparent mix of stellar popu-lations in the integrated light of a galaxy, even when the local com-position and extinction law of the dust is constant throughout the galaxy (Calzetti et al. 1994; Wild et al. 2011; Battisti et al. 2017).
Previous studies have shown that dust opacity in galaxy disks has (i) a radial dependence, where centres are more extin-guished than outskirts of disks (Valentijn 1994; Peletier et al. 1995; Holwerda et al. 2005; Tacchella et al. 2017); (ii) a type depen-dence, where early-type spirals have higher opacities than late-type disks (de Vaucouleurs et al. 1991; Han 1992; Masters et al. 2010); (iii) a luminosity dependence, where the mean extinction of the disk increases towards more luminous galaxies (Giovanelli et al. 1995; Tully et al. 1998; Masters et al. 2003), but turns over at
the highest luminosities, where the specific star formation rate drops (Masters et al. 2010; Devour & Bell 2016); and (iv) spi-ral arms are more opaque than inter-arm regions (Beckman et al. 1996; White et al. 2000; Holwerda et al. 2005). Cho & Park (2009) found that extinction changes with concentration of the galaxy, and Grootes et al. (2013) note that the central face-onB-band dust opti-cal depth in a galaxy is correlated with its mean stellar mass surface density.
Previous work has mostly addressed the effects of inclination on the appearance of galaxies in the stellar continuum light of UV-optical and near-infrared passbands. Generally, it is observed that measuring additional extinction as galaxy orientation changes from face-on to edge-on is easier than assessing total extinction, although approaches exist for the latter (e.g. Driver et al. 2007). For instance, Masters et al. (2010) find that the average extinction added from face-on to edge-on in the passbands of Sloan Digital Sky Survey (SDSS, York et al. 2000) ranges from 0.4 mag ini-band to 0.7 mag inu-band for the integrated light of a galaxy, and Devour & Bell (2016) find similar values but can distinguish trends with mass and star formation. Studies of integrated light of course average over a range of behaviour from negligible extinction in the outer parts to high obscuration in galaxy centres. Some work has considered trends in the extinction of Balmer lines, but such data was mostly drawn from SDSS fibre spectra, which concentrate on small central areas in galaxies and thus fail to represent their disks (e.g. Yip et al. 2010; Wild et al. 2011; Battisti et al. 2017).
In this paper, we look specifically at the inclination-dependence of total galaxy luminosity in passbands that are used as star-formation indicators, notably the UV 280 nm continuum, the integrated Hα-line luminosity and the far-infrared continuum in theSpitzer24µband. Specifically, the 24µluminosity is a star-formation indicator that should be largely independent of inclina-tion, such that the ratio of UV-to-IR and Hα-to-IR luminosity can directly reflect UV- and Hα-extinction.
We work with a comparatively small sample of a few hundred galaxies, but compared to SDSS our spatial resolution is larger, and also our multi-band images have vastly deeper surface brightness sensitivity; this allows fitting the outer disk contours as opposed to relying on inner axis ratios that are more easily biased by bulges and bars; finally, our deep Hαand [NII] line imaging captures Hα
light from across the entire galaxy disk, thus matching the Hα -footprint consistently to the other passbands and avoiding aperture biases. We use a volume-limited sample of galaxies around a cluster at a fixed distance (redshiftz≈0.16) and thus avoid a dispersion of K corrections within the sample.
In Section 2, we describe our multi-wavelength data and the sample, including inclination biases in stellar-mass determination. In Section 3 we measure the slopes of ourM∗/Lbandratios in UV,
Hαand FIR versus stellar mass and inclination, and consider in particular the infrared excess over UV and Hα. This is followed by a discussion and summary. We adopt a flatΛcold dark matter cos-mology withΩΛ = 0.7andH0= 70km s−1Mpc−1, which fixes
the luminosity distance to our target cluster atDL = 791Mpc. We use Vega magnitudes throughout the paper, and a bolometric luminosity for the Sun ofL⊙,bol= 3.823×1033erg s−1.
2 DATA
This work brings together data from several wavelengths and obser-vatories, while it focuses on one particular galaxy cluster system at
study how the brightness of star-forming disk galaxies is affected by inclination, and thus combine measurements of galaxy inclina-tion and stellar mass with measures of mass-to-light (M∗/L) ratios in different spectral passbands. Our interest lies primarily in pass-bands used as star-formation rate indicators. We include:
(i) luminosities observed in the UV continuum at rest-frame 280 nm, which is emitted mostly by young stars of< 100Myr age and which may have migrated away from their birth regions but still reside in the thin star-forming disk of a galaxy;
(ii) the Hα-emission line, which mostly originates from star-forming regions with very young stars of<10Myr age surrounded by ionised gas (HII regions), but includes a significant component of diffuse interstellar gas; Popescu et al. (2011) suggest that 60% of UV photons escape the clumpy dust around HII regions, and Calzetti (2013) suggest that these could ionise gas within 1 kpc of the star-forming region;
(iii) the far-infrared continuum at24µ, which is emission from dust heated mostly by young stars, but partially by intermediate-age stars (Calzetti 2013, and references therein); by mass most of the dust is in a diffuse component, while a fraction of perhaps<15% is clumpy and enshrouds star-forming regions (Grootes et al. 2013).
We restrict the analysis to normally star-forming galaxies, where these measurements are not affected by light from active galactic nuclei (AGN). We identify and deselect AGN using their [NII]/Hαline ratio, and we separate dust-poor red-sequence galax-ies from normally dusty star-forming galaxgalax-ies with optical SEDs.
2.1 Data sources
This cluster system was initially observed in detail by the survey Classifying Objects by Medium-Band Observations in 17 bands (COMBO-17, Wolf et al. 2003, 2004), which provided photomet-ric redshifts for most of the cluster galaxies with a precision of
δz < 0.005, on the order of the velocity dispersion of the indi-vidual sub-clusters and smaller than some of the velocity differ-ences between them. From this data, Wolf et al. (2005) selected a largely complete sample of 795 cluster members down to a luminosity of MV = −17. COMBO-17 provides luminosities for several passbands obtained by SED fitting. The COMBO-17 SEDs are corrected for foreground extinction by interstellar dust (AR = 0.1476). Measurements of the rest-frame 280 nm pass-band atz ∼ 0.16required minor extrapolation as the bluest ob-served filter is centred on a rest frame wavelength of 310 nm; this is expected to change the estimates of L280 by less than 1–2%.
All objects in the cluster sample have reliably measured rest-frame 280 nm luminosities, as the sample cut does not exploit the depth of the COMBO-17 imaging.
Wolf et al. (2005) also presented a colour-colour diagram to isolate the true red sequence from star-forming galaxies across their whole range of colour, and showed how in some colour indices star-forming galaxies can be even redder than quiescent galaxies with old populations (see also Masters et al. 2010). As a result, they dis-tinguish between quiescent and dust-poorold redgalaxies and sim-ilarly red but moderately star-forming and moderately dusty galax-ies, which they calleddusty redto contrast them against truly old red cases. In this work, old red galaxies are removed from the sam-ple as they are expected to have little dust and star formation.
Observations withSpitzerallowed the study of obscured star formation in the cluster galaxies from MIPS 24µdata (Bell et al. 2007; Gallazzi et al. 2009; Wolf et al. 2009). Sources are detected to a flux limit of 58 mJy, corresponding to a star-formation rate of
0.14M⊙/yr (Bell et al. 2007), but we expect the sample to be only ∼30% complete at this level, while 80% completeness is reached at 93 mJy. Given a PSF of∼6′′FWHM, or 18 kpc at the cluster distance, galaxies are mostly unresolved in the 24µimages, but are thus also not susceptible to size and inclination biases in detection. Bell et al. (2004) estimated stellar masses for COMBO-17 galaxies using the prescription of Bell & de Jong (2001). Based on that the cluster sample is complete atlogM∗/M⊙ & 8.75 for a Chabrier (2003) initial mass function (IMF). The COMBO-17 SEDs underlying these mass estimates are, however, constructed from central-aperture (∼4.5kpc) SED measurements that are cor-rected for aperture losses using a single deep (R5σ = 26)R-band image from COMBO-17. This implies that the mass-to-light ra-tios are biased in large galaxies with colour gradients; specifically, they are probably overestimated by.0.25dex in spiral galaxies of logM∗/M⊙>11(Wolf et al. 2009). In this paper, we use stellar mass itself first as an ordering parameter for the galaxy population, where a stretch of the scale at the massive end is inconsequential for our analysis. The Hα-selection explained below also eliminates the most massive galaxies that are most affected by this problem from the analysis. We also use mass-to-light ratios as a crucial diagnostic for extinction, so that biases in their derivation are important, and we will discuss these in Sect. 2.4.
The field was then observed with theHubble Space Telescope (HST) in the F606W filter, and covered by 80 tiles of theAdvanced Camera for Surveys(ACS), as part of theSpace Telescope Abell 901/2 Galaxy Evolution Survey(STAGES, Gray et al. 2009). All galaxies in the cluster sample are well-detected in the&2,000sec HST exposures and show light profiles to a surface brightness of
µV606 = 26.5 mag arcsec−2. The superior spatial resolution of
∼0.1′′supplies morphological detail at a resolution of 300 pc. In this work the HST data are used to measure disk inclinations and apertures to re-derive multi-band photometry.
More recent observations of the Hα and [NII] emission lines were obtained by the OSIRIS Mapping of Emission-line Galaxies in A901/2 survey (OMEGA, Chies-Santos et al. 2015; Rod´ıguez del Pino et al. 2017). These were carried out with the Optical System for Imaging and low Resolution Integrated Spec-troscopy(OSIRIS) instrument (Cepa et al. 2013) on the 10.4 m Gran Telescopio Canarias (GTC) and cover ∼ 70% of the COMBO-17 area. The data set consists of Fabry-P´erot narrow-band images with 14 ˚A FWHM, from which low-resolution emission-line spectra were constructed with up to 48 wavelength points for each galaxy. Spectral fluxes are measured in galaxy-specific apertures of 2.5×the size of the galaxy semi-major axis in the HST/F606W image. Within the cluster sample defined above, OMEGA detected 439 galaxies with an Hαflux offHα > 3× 10⁻¹⁷
erg/s/cm2 and an Hαequivalent width of WHα > 3 A˚ (Rod´ıguez del Pino et al. 2017). The separately measured [NII ]-line allows us to type galaxies into star-forming vs. AGNs. We note that we have no data on the Hβ-line, which is often used to estimate extinction on Balmer line-emitting gas.
Since the compilation of Gray et al. (2009), updates have been made to the Spitzer data set (adding 14 objects by improved cross-matching) and the OMEGA data were only obtained later. We also rederived improved total UV luminosities to match the total fluxes measured in the 24µand Hαimages.
2.2 Galaxy inclinations
pass-band of observation. While stars are expected to radiate mostly isotropically, they are viewed through lines-of-sight traversing dif-ferent parts of their galaxy. As a galaxy’s inclination dictates the column density of dust along that line-of-sight, it determines how much light is absorbed from young stars and star-forming regions. Large edge-on galaxies, e.g., are seen through the longest line-of-sight of extinguishing dust and typically appear very red in UV-optical colours, irrespective of their star-formation rate.
We define galaxy inclination i to be the angle between a galaxy’s disk plane and the plane of the sky, such that face-on galaxies havei = 0◦
. Assuming an axisymmetric, infinitesimally thin disk, the inclination angle is related to the ratio of semi-minor axis to semi-major axis (b/a) bycosi=b/a, but Hubble (1926) already accounted for the thickness of a galaxy from an intrinsic axis ratioqusing the equation
cosi= s
(b/a)2−q2
1−q2 . (1)
We follow the literature, which has long usedloga/bas an ordering parameter for inclination (e.g de Vaucouleurs et al. 1991; Giovanelli et al. 1994; Masters et al. 2010), and has measured dust extinction by fitting the slopeγin the expressionAband = a+
γloga/b, whereAbandis the total attenuation of light in a
pass-band. We take the intrinsic thickness of galaxy disks into account by capping the axis ratio atloga/b= 0.8, equivalent to an average axis ratio of edge-on galaxies ofq≈0.16(similar to Maller et al. 2009), while measured values range from 0.1 to 0.22 for Sd to Sa galaxies (Unterborn & Ryden 2008; Masters et al. 2010).
A standard way to measure galaxy inclination is to fit el-lipses to a photometric image (e.g. Jedrzejewski 1987). We use the IRAFellipsetask with a fixed centre to determine the ellipticity and position angle of the outer galaxy disc at a surface brightness ofµV606,AB = 26.5 mag arcsec−2 (for details see Maltby et al.
2012). This approach minimises bias from bulges on the inclina-tion measurement except for nearly edge-on viewing angles, where the bulge may appear wider than the outer disk itself.
2.3 Sample definitions
In this work, we consider galaxy luminosities and especially mass-to-light ratios in three different passbands as a function of galaxy mass and inclination. However, the detections in these passbands come with different limits and are made in different footprints. The data for the UV continuum at 280 nm cover the widest area and has the deepest detection limits. The Hαdata covers∼70% of that area and have detection limits such that 439 out of 795 galaxies have both UV and Hαdetections.
Fig. 1 shows this sample in the left panel, together with two lines approximating completeness limits: the horizontal line at an Hαluminosity oflogLHα/(erg s−1) = 39.72represents a com-pleteness limit corresponding to a line flux of7×10−17erg/s/cm2
at the luminosity distance of A901/2 (DL = 791Mpc), below which the number counts of Hα-detections turn over. We cut the sample at an Hαequivalent width ofWHα = 3A, approximated˚ by a diagonal line, below which the line detection itself is unreli-able. This cut effectively excludes only red-sequence galaxies with little star formation.
From the Hαsample of 439 galaxies we reject 47 objects that are either flagged with large errors or are classed as red-sequence galaxies (’old red’) based on the COMBO-17 SED, which means that their Hαand UV emission is unlikely to originate from
young stars and star formation. Next we reject 77 galaxies, whose [NII]/Hαline ratios suggest that they are likely affected by either nuclear activity or environmentally induced shocks, following the WHAN diagram of Cid Fernandes et al. (2011). We identify these objects on the basis of the OMEGA line-fit, and consider galax-ies as possible AGN when the Bayesian fit probability is over 90% thatlog[NII]/Hα >−0.4(see Rod´ıguez del Pino et al. 2017); the likely AGN mostly show lower specific Hαluminosity. This leaves 315 galaxies in the combined UV/Hαsample; the middle panel of Fig. 1 shows their UV luminosities.
Out of these 315 galaxies, 297 are contained in the footprint of the 24µdata (see right panel of Fig. 1); this includes 109 detections above 58 mJy arranged in a star-forming main sequence of galaxies, that appears to be complete atlogM∗/M⊙&9.75, where we find 74 objects, with the most massive galaxy having an estimated mass oflogM∗/M⊙= 11.28. In the following, we use two samples:
• an IR-complete higher-mass sample with 74 galaxies selected bylogM∗/M⊙>9.75andlogLIR/L⊙,bol >9.16that roughly
corresponds toSFRIR&0.14M⊙/yr; and
• a UV-complete lower-mass sample with 172 galaxies selected bylogM∗/M⊙= [8.75,9.75], drawn from a slightly larger area.
We note that inclination-dependent incompleteness of our sample should not affect the isotropic IR- and deep UV-data, but they could affect Hαdetections of highly inclined galaxies at the lower-mass sample limits; however, previous works have found only little overall extinction in low-mass galaxies (Tully et al. 1998; Masters et al. 2010), so this effect is not expected to be significant.
2.4 Mass-to-light ratios and star formation
Most of the analysis in this paper concerns trends of dust extinction with galaxy inclination, which could be inferred in two ways: first by measuring inclination trends of luminosity in an extinguished passband relative to a not extinguished one, and second by measur-ing inclination trends in the mass-to-light ratio of galaxies. We will first do the latter, although it is less reliable, because we can apply it to both the low-mass and the high-mass sample; then we come back to the former, which is the better measure, but for us works only in the high-mass sample.
Using a sample at fixed luminosity distance and ignoring a meanM∗/Lband ratio for face-on galaxies,M/L-trends can be
measured from (i) apparent total fluxes in the relevant passbands and (b) stellar masses. Total fluxes are moderately straight-forward to measure, although inclination can affect surface brightness and thus sensitivity to total light. We avoid biases from surface bright-ness changes by using consistent, large apertures in Hαand UV (the unresolved 24µimages are independent of inclination).
The stellar mass, however, is derived from an estimate of the
M∗/LV ratio that is based on the dust-extinguished optical SED from the inclined galaxy. We estimate stellar mass using the method of Bell & de Jong (2001), although the reliability of their approach has been debated: for dust extinction withRV = 3, their masses are supposed to be correct in an optically thin extinction scenario, where the loss of light is exactly compensated by an increase in the inferredM∗/LV ratio due to reddening. However, as the colour of a galaxy is light-weighted, so is theM∗/LV ratio, and heavily absorbed galaxy components behind optically thick dust will fail to be taken into account in both light and mass.
Figure 1.Sample of star-forming galaxies in the cluster Abell 901/2 used in this paper.Left:Hα-line luminosity vs. stellar mass; the main sample (dark points) is complete at line fluxes>7×10⁻¹⁷erg/s/cm2, corresponding to a luminosity oflogL
Hα/(erg s−1) = 39.72(horizontal line) atDL= 791Mpc; it is
also complete atWHα>3A (diagonal line). Light symbols mark objects removed from the sample because of AGN or shock contribution to their emission˚
lines.Centre:UV 280 nm luminosity of the main sample.Right:IR luminosity fromSpitzerdata with detection limits atlogLIR/L⊙,bol= 9.16.
Figure 2.Cumulative stellar-mass histograms of galaxies in inclination bins for the low-mass sample (left) and the all IR-detected galaxies with
logLIR/L⊙,bol >9.16(right). The IR-detected sample shows signs of mass underestimation at higher inclination.
Empirically, Driver et al. (2007) argue that Bell & de Jong (2001) masses are fine up toi 6 60◦, but underestimated towards edge-on, by up to ∆ logM ≈ 0.2 or 0.4 dex for disks and bulges, respectively, based on their Fig. 13. Maller et al. (2009) compare mass histograms of face-on and edge-on galaxies and find that Bell & de Jong (2001) masses are the least biased among a choice of three varieties; while they tend to be slightly underestimated for edge-on galaxies, the difference in their histograms is well below 0.1 dex.
Our first attempt to estimate mass biases at high inclination uses cumulative stellar-mass histograms of sub-samples in bins of inclination. For a randomly oriented sample of galaxies, these his-tograms should be similar if there is no inclination bias in the mass determination. Fig. 2 shows mass histograms of our lower-mass sample and of the full IR-detected galaxy sample that we expect to radiate approximately isotropically; for the full IR-sample we drop the mass cut that makes the higher-mass sample so we can see if we lose objects due to underestimated mass. We combine inclinations up to∼71◦
orloga/b <0.5into a single bin (solid line) after not finding trends when subdividing into further bins. There is a clear signature that galaxies atloga/b >0.7(i&80◦
) have underesti-mated masses, while in the range ofloga/b= [0.6,0.7]the situa-tion is less clear. We proceed with two versions of the sample, one with inclinations limited tologa/b <0.6and one without limits. The limit reduces the higher-mass sample from 74 to 67 galaxies, and the lower-mass sample from 172 to 149 galaxies.
It is also possible to search for inclination biases by including in our analysis a passband in which we expect galaxies to radiate
isotropically. Any inclination bias in determiningM∗/LV would manifest with full strength as an inclination trend in theM∗/Lband
ratio of such a passband. Here, we use the far-infrared 24µband, as we expect the dust emission from the galaxy disk to be optically thin and intrinsically isotropic.
Finally, with 24µemission likely to be optically thin or not extinguished, we consider trends in UV-to-IR and Hα-to-IR ratios to eliminate mass biases entirely from the inclination trends, and get the most reliable trends in UV- and Hα-extinction, but only for the high-mass sample.
Several methods for estimating star-formation rates (SFR) assume a linear dependence on a passband luminosity, although there are non-linear SFR calibrations (e.g. Calzetti et al. 2007; Davies et al. 2016; Brown et al. 2017). Linear calibrations have been proposed for all three passbands used in this paper (for re-views see Kennicutt & Evans 2012; Calzetti 2013). For linear es-timators, the mass-to-light ratio is proportional to inverse specific star-formation rate. Hence, the ordinate axes in Figs. 3 to 5 could be labelled with SSFR−1
bandinstead ofM∗/Lband. We use the latter as
it makes no assumption on the SFR calibration. In either case, any trend ofM∗/Lbandratio with inclination causes an equally strong
trend in SFR estimates with inclination. Our findings could thus be used to correct SFR estimates from these passbands, where galaxy inclination is known, which could help to tighten relationships be-tween SFR and other galaxy parameters.
Assuming the SFR calibrations previously used by Bell et al. (2005); Gray et al. (2009) and Rod´ıguez del Pino et al. (2017), our sample has detection limits of (SFRUV,SFRHα,SFR24µ) = (0.013,0.010,0.140) M⊙yr−1 and 90%-completeness limits of (0.020,0.023,0.25) M⊙yr−1, although Hαlimits are higher for high-mass, low-EW galaxies.
3 RESULTS
In this section, we investigate the mass-to-light ratio of galaxies in the passbands UV 280 nm, Hαand IR 24µas a function of mass and inclination. TheM∗/Lbandratios depend not only on
inclina-tion, but also on two further parameters, which add scatter to any trends with inclination:
(i) There is a pronounced trend ofM∗/Lbandratio with stellar
mass of the galaxy. The mean colour and meanM∗/Lbandratio of
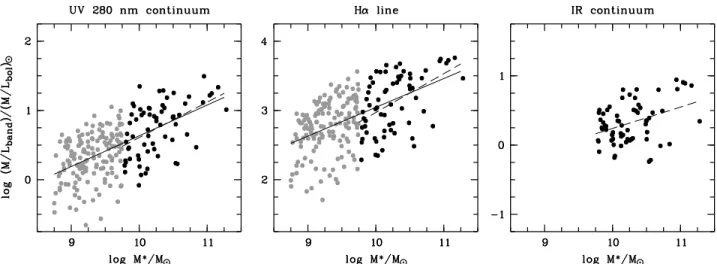
Figure 3.Trends of mass-to-light ratio with galaxy stellar mass in three bands: UV 280 nm continuum (left), Hα-emission line (centre) and IR 24µ(right). Dark symbols represent the IR-complete high-mass sample withlogM∗/M⊙= [9.75,11.25]andlogLIR/L⊙,bol>9.16, which corresponds roughly to SFR>0.14M⊙/yr; light symbols represent the Hα- and UV-complete low-mass sample withlogM∗/M⊙= [8.75,9.75]. Lines are regression fits to the
combined samples (solid) and higher-mass-only samples (dashed).
of a mass trend in mean stellar age and specific star-formation rate (the so-called star-forming main sequence, e.g Noeske et al. 2007; Schiminovich et al. 2007; Wuyts et al. 2011). In addition, the mean dust column density of a galaxy may be a function of mass, which Masters et al. (2010) have actually measured. In the follow-ing, we make no assumption on the relative importance of stellar population vs. dust factors for the trend, but return to this point in Sect. 4. Hence, we first determine trends with mass and then try to control for them when investigating the inclination dependence of
M∗/Lbandratio residuals relative to the mean at a given mass.
(ii) The M∗/Lband ratio also depends on the specific
star-formation rate of an individual galaxy, i.e. its deviation from the star-forming main-sequence, which adds further scatter to
M∗/Lbandratios in a galaxy sample. We will later suppress this
source of scatter by investigating per-galaxy light-to-light ratios (a.k.a. colours) from pairs of passbands; these have no dependence on the star-formation rate itself, if the two passbands are both lin-ear predictors of SFR; in this case, they convey instead only how light in different bandpasses is extinguished to a different degree depending on the inclination.
We remind the reader here that optical continuum passbands such asugrizare not linear predictors of star-formation rate, while the three passbands studied by us have all been used as linear SFR predictors before, despite certain limitations.
Overall, we model the observed M∗/Lband ratios in each
passbandias a linear relationship of the form:
logM∗/Li=αi+βilogM∗/M⊙+γiloga/b . (2)
We will obtain linear fits to observed passband luminosity ratios, logLi/Lj, with the same parametrisation, whereβi/j quantifies the mass dependence andγi/jthe inclination dependence.
3.1 Mass dependence in mass-to-light ratios
First, we investigate trends in the mass-to-light ratio vs. stellar mass for our three passbands (see Fig. 3) and in this case choose to elim-inate high-inclination objects withloga/b > 0.6ori & 75◦
. In UV and Hαwe have two samples available for lower and higher masses, which we consider both independently and in combination,
Table 1.Slope valuesβifrom linear fits to trends in mass-to-light ratio with
stellar mass. The IR passband is only complete in the higher-mass sample.
higher-mass sample combined sample
passband βi rms βi rms
UV 280 0.511±0.113 0.34 0.444±0.041 0.33
Hα 0.561±0.122 0.37 0.415±0.045 0.36
IR 24µ 0.309±0.092 0.27
while the IR has only the higher-mass sample. We obtain linear re-gression fits and list the resulting slopes in Tab. 1. Using only a par-tial mass range leads to weaker constraints due to reduced leverage and makes the fits more influenced by outliers near the ends of the mass range.
Using the largest possible sample in each case, we find slopes of(βUV, βHα, βIR) = (0.444,0.415,0.309)and1σ-uncertainties
of 0.041, 0.045 and 0.092, respectively. Using only the higher-mass sample nearly triples the uncertainty in UV and Hαto∼0.12while making the slopes steeper. However, in Fig. 3 we note six galaxies with relatively highM∗/Lbandratio at the highest masses, which
increase the slope estimates in the higher-mass-only fit. At these high masses the star-forming main-sequence is sparsely populated, and these galaxies are instead probably already transitioning to the red sequence; hence, we prefer the combined fit. The purpose of this regression fit is to take out most of the nuisance variation in
M∗/Lcaused by mass in order to make the inclination study more sensitive. Hence, uncertainties in the slopeβwon’t appear as biases in the inclination study but only as a sub-dominant source of noise.
3.2 Inclination dependence in mass-to-light ratios
Next we determine trends of mass-to-light ratio with inclination in our three passbands, after removing the mass dependence by sub-tractingβi×(logM∗/M⊙−10). We obtain linear regression fits and list the slopes in Tab. 2.
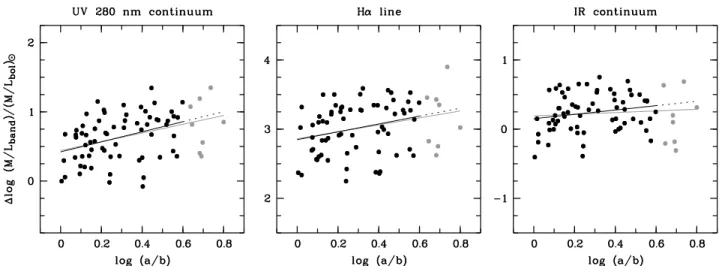
In the higher-mass sample we find a strong trend in UV with
de-Figure 4.Trends of mass-to-light ratio with galaxy inclination in the high-mass sample oflogM∗/M⊙>9.75andlogLIR/L⊙,bol>9.16, after removing the mass trend: significant trends are seen in UV 280 nm continuum (left) and Hα-emission line (centre), but not in IR (right). Dark symbols and fits are inclination-restricted, while light symbols are highly inclined galaxies and light fits include all galaxies.
Figure 5.Trends of mass-to-light ratio with galaxy inclination at low mass oflogM∗/M⊙= [8.75,9.75]after removing a trend with mass, in passbands
UV 280 nm continuum (left) and Hα-emission line (centre), followed by UV-to-Hαratio (right). No significant trends are found. Dark symbols and fits are inclination-restricted; light symbols are highly inclined galaxies, which are not used in the fit but match its extrapolation.
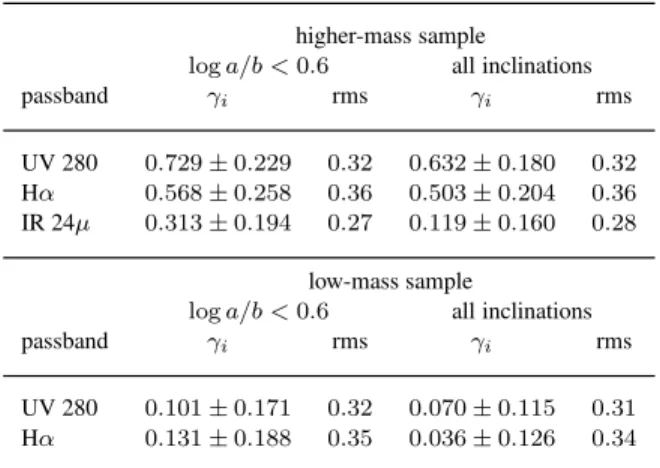
Table 2.Slope valuesγiof trends in mass-to-light ratio with inclination:
linear fits are obtained for a sample withloga/b <0.6and a sample with-out limits. The IR is only available for the higher-mass sample.
higher-mass sample
loga/b <0.6 all inclinations
passband γi rms γi rms
UV 280 0.729±0.229 0.32 0.632±0.180 0.32
Hα 0.568±0.258 0.36 0.503±0.204 0.36
IR 24µ 0.313±0.194 0.27 0.119±0.160 0.28
low-mass sample
loga/b <0.6 all inclinations
passband γi rms γi rms
UV 280 0.101±0.171 0.32 0.070±0.115 0.31
Hα 0.131±0.188 0.35 0.036±0.126 0.34
clines by about 10 to 15% due to the underestimated masses of the added galaxies. In the IR continuum band we still find a slope of ∼0.3at1.5σsignificance, which disappears when including high-inclination galaxies.
At first sight, the absence of a significant trend in the IR band is reassuring, since we claimed this to be radiating optically thin and isotropically, such that any inclination trend should be reflect-ing biases in determinreflect-ing the stellar masses as opposed to intrin-sic galaxy properties. We already know that the masses of high-inclination galaxies are underestimated, suggesting that better mass estimates might reveal a positive trend in theM∗/LIRratio at>2σ
significance. This is a hint that either the 24µ-emission underly-ing our LIR measurement is not isotropic but slightly optically
thick and reduced, when a galaxy is viewed edge-on, or that stellar masses are biased such that they get overestimated with inclination atloga/b <0.6, which corresponds to an axis ratio of4 : 1or a viewing angle of∼75◦
for a thin disk.
In the lower-mass sample we find best-fitting slopes of∼0.1 with uncertainties larger than that, in both UV and Hα(see Fig. 5). The formal slopes have signs in the expected direction with extinc-tion slightly increasing with inclinaextinc-tion, but the effects are weak and statistically insignificant. The low-mass sample ranges from approximately the mass of the Small Magellanic Cloud to that of the Large Magellanic Cloud, two satellites to the Milky Way; galax-ies of that mass have irregular shapes and unreliable inclination val-ues, but low-mass galaxies appearing with large axis ratios will still be mostly highly inclined and not intrinsically elongated, and so we conclude that there is no evidence for significant dust column den-sities in galaxies oflogM∗/M⊙ = [8.75,9.75]that would affect their luminosity or measured star-formation rate as a function of inclination.
3.3 Extinction changes from face-on to edge-on orientation
We could now directly estimate how much dust extinction changes from face-on to edge-on geometry in the UV- and Hα-passbands, but we still intend to refine the fits and remove a potential bias in theM∗/LV estimates. The trend with inclination inM∗/LIR
is less than2σ-significant, but it is still justified to eliminate this slope, and indeed the scatter introduced by the second nuisance parameter, the star-formation rate, by considering per-galaxy light-to-light ratios from a pair of passbands. Assuming that, at a given
Table 3.Slope valuesγi/jof inclination trends in band-to-band light ratios:
linear fits are obtained for a sample without inclination limits. The IR is only available for the higher-mass sample.
higher-mass sample low-mass sample
passband γi/j rms γi/j rms
IR/UV +0.485±0.176 0.31
IR/Hα +0.361±0.174 0.31
UV/Hα −0.124±0.087 0.15 −0.037±0.066 0.18
stellar mass, the IR-luminosity is a reliable measure of SFR, then the ratio of IR-to-UV or IR-to-Hαluminosity reflects the UV- and Hα-specific extinction levels per galaxy. These ratios may have dif-ferent normalisations at difdif-ferent stellar mass of a galaxy, but such trends will only increase scatter when plotted against inclination and not bias any trends. Here, we use the whole range of inclina-tions as the underestimation of stellar masses at high inclinainclina-tions has no influence.
The results are shown in Fig 6 and listed in Tab. 3. The slopes of the light-to-light ratios in a pair are consistent with the differences of the slopes in the twoM∗/Lband ratios involved,
as is of course expected. So, there is a noticeable trend with in-clination in the IR-to-Hα ratio and a clear trend in the IR-to-UV ratio, a variant of which is also known as IRX or infrared excess (Meurer et al. 1999; Grasha et al. 2013). The uncertainties and scatter are smaller than those of the M∗/L trends them-selves. In particular, we see from the UV-to-Hαratio that these two bandpasses are strongly correlated on a per-galaxy basis, con-straining the trend to γUV/Hα ≈ −0.124with a small error of ∼0.08dex. As expected, the lower-mass sample shows no notice-able trend in the UV-to-Hαratio, with a formal slope estimate of
γUV/Hα,lowM=−0.037±0.066(see also right panel in Fig. 5).
If the low-significanceM∗/LIRtrend with inclination in the
IR is introduced by an inclination bias affecting the mass-to-light ratio from optical broad-band photometry, then we can now de-termine how much the dust column density increases in the UV and Hαpassbands as an average disk galaxy turns from face-on to edge-on orientation. We take the inclination range from face-on to edge-on to be given by∆ loga/b= 0.8and use the slopesγIR/UV
andγIR/Hαto determine the extra factor of UV- and Hα-light that is extinguished by the edge-on line-of-sight. In units of magnitudes, the additional extinction is then
∆0.8Aband= 2.5×0.8×γIR/band (3) ∆0.8AUV = 0.97±0.35 (4) ∆0.8AHα = 0.72±0.35. (5)
Assuming a Fitzpatrick (1999) extinction law withRV = 3.1, we findRUV = 6.02andRHα = 2.36and derive the additional reddening due to inclination to be∆0.8E(B−V)UVstars= 0.16± 0.06for the UV-emitting stars and∆0.8E(B−V)Hαgas= 0.3± 0.15for the Hα-emitting gas regions. This means that we find the diffuse dust column shielding Hα-emitting gas to be twice as large as that shielding the UV-emitting stellar population. While the large errors on the IR-ratio trends suggest a low significance, the better determined trend of the UV-to-Hαratio reduces the error on the ∆0.8E(B−V)difference between the two populations to 0.07
and makes it a2σ-difference.
in-clude the face-on part of extinction. It is assumed that especially the Hα-emitting gas regions are embedded in clumpy dense local dust clouds (Kennicutt 1983; Tuffs et al. 2004), which could well be locally isotropic on average. We assume that the inclination de-pendence stems from a diffuse dust component in the galaxy disk and that only this component leads to deeper optical depth from longer lines-of-sight when a galaxy is inclined.
4 DISCUSSION
4.1 Stellar-mass estimates
A study of inclination effects based on mass-to-light ratios depends crucially on their freedom from inclination biases. The literature contains conflicting statements on the reliability of mass-to-light ratios from Bell & de Jong (2001): Maller et al. (2009) consider their masses to be the least biased among a choice of three alterna-tives, and describe them as essentially unbiased even at the highest inclinations; in contrast, Driver et al. (2007) consider them to be unbiased ati <60◦
, but find them to be biased at higher inclina-tions. Our results appear in between, as we find these masses ac-ceptable up tologa/b= 0.6, which isi >75◦
, or indeedi≈80◦ for an intrinsic thickness ofq = 0.18. At higher inclinations, all the way to the edge-on case ati= 90◦
, we find an underestimation of the mass by potentially up to a factor of∼2.
This underestimation can be explained by attenuation lev-els that increase faster than the reddening at the highest inclina-tions, such that the declining apparent brightness of the galaxy is not sufficiently compensated by an increased mass-to-light ratio. Xilouris et al. (1999) noted that dust disks have larger scale lengths than stellar disks in galaxies and may extend beyond the edges of the visible stellar disks; if that were the case, such dust would not contribute while inclination changes from face-on toi&80◦
, but its effect, although presumably weak, could kick in edge-on, when it is moved into the lines-of-sight to the thick disk of a galaxy.
4.2 Attenuation of stellar continuum and line-emitting gas
Our measurement for the attenuation of the UV stellar contin-uum at 280 nm from face-on to edge-on can be best compared with the results in the SDSSu-band by Masters et al. (2010) and in the GALEX FUV-band by Leslie et al. (2018): Masters et al. (2010) found an extinction contribution going from face-on to edge-on of ∆Au = 0.7 in the SDSS u-band. Our value of ∆A280= 0.97translates into∆Au= 0.68, if we assume a Milky Way extinction law withRV = 3.1. We note that Masters et al. (2010) find an attenuation curve, going from ∆Au = 0.7 to ∆Ai = 0.4, that is greyer than a Milky Way extinction law, but still consistent with ∆A280 ≈ 1within the errors. The
re-sults are equally compatible with the slope measurements for the SDSS u-band by Devour & Bell (2016). Leslie et al. (2018) find
γFUV = 0.79±0.09with a different parametrisation of
inclina-tion, suggesting∆AFUV = 1.97±0.2, where we would expect ∆AFUV = 1.29±0.45if we assume a Fitzpatrick (1999)
attenu-ation curve withRFUV= 8.02.
In contrast, our results are incompatible with the trends sug-gested by Maller et al. (2009). On this matter, Devour & Bell (2016) present an excellent discussion suggesting that all our stud-ies are consistent in terms of data, but lead to inconsistencstud-ies due to the analysis, and we have nothing to add to their assessment.
Our value for the attenuation from face-on to edge-on in Hα
is∆AHα = 0.72. This means that the 280 nm-emitting stars are attenuated by less diffuse dust than the Balmer line-emitting gas, most likely with a factor of∆E(B−V)stars≈0.52×∆E(B−
V)Hα, but the deviation from equality is only significant at the 2σ level. We note, that for the overall extinction ratio Calzetti et al. (2000) reportE(B −V)stars = 0.41×E(B−V)Hα in star-bursting galaxies, but this combines the diffuse and the clumpy dust and refers to the population of stars more generally.
In a simplistic two-component model with a thin disk of dif-fuse dust and isotropic clumps of thick dust around star-forming re-gions, we would naively expect no difference in the∆E(B−V)of stars and gas caused by inclination, although the face-onE(B−V) values for the two would be very different. This result is indeed found by Yip et al. (2010), whose Fig. 16 shows no inclination trend in the ratio of the equivalent width between Hα and Hβ
within the errors; this is consistent with the stellar continuum changing with inclination by the same attenuation curve as the Balmer emission lines as this will keep line equivalent widths un-changed1.
Still, a marginally higher extinction for the gas could be plau-sible in a mixed gas-dust-star geometry (and would be consistent with Yip et al. 2010), where more stars than gas are seen with low or no attenuation; this would be the case, if either gas is in a thin-ner disk than the stars and some stars are above the dusty volume and thus less attenuated. An alternative explanation stems from the nature of our cluster sample, which includes some galaxies with more centrally concentrated star formation than is typical in field samples. The loss of star formation in the outer parts of the disks might have gone hand in hand with a loss of gas and dust, such that the outer stellar disks in our galaxies are actually seen with lower-than-typical attenuation that is mixed into our integral values representing galaxies as a whole.
Inclination trends in the attenuation of the line-emitting gas have also been measured by Battisti et al. (2017), who find a mild inclination trend in Balmer decrement, but they consider mostly low-mass galaxies (logM∗/M⊙<10), and study only the central regions of galaxies through fibre spectra. Interpreting and compar-ing their results is challenged by the fact that the dust line-of sight in fibre spectra increases with inclination not only by1/(cosi), but by more as the fibre footprint on the galaxy becomes ellipti-cal and finally cylindriellipti-cal within the galaxy plane once an edge-on view is reached: thus face-on only the dust within the fibre aperture contributes, while towards edge-on a whole cylinder across the full diameter of the galaxy moves into the fibre aperture.
4.3 Trends in far-infrared emission
In this paper we use the far-infrared luminosity as a reference mea-surement that we expect to be minimally affected by inclination. We find indeed no significant trend in theM∗/LIR-ratio with
in-clination. The same is found by Leslie et al. (2018), who studied WISE W4 data for low-redshift field galaxies in the SDSS.
Due to the restricted dynamic range in mass we find only a
1 Note, that the discussion in Yip et al. (2010) is misled by a confusion of
weak trend of theM∗/LIR-ratio with mass, which is furthermore
dominated by a few massive galaxies that have high ratios above trend in all passbands we consider. These are likely to have their masses oflogM∗/M⊙≈11estimated correctly, while having un-usually low luminosities in the star-formation indicators because they have moved off the star-forming main sequence already.
Masters et al. (2010) and Devour & Bell (2016) have used a much larger parent sample, which allowed a careful analysis of the highest-mass end of the disk galaxy distribution atlogM∗/M⊙≈ 11. They found that the declining star formation is accompanied also by a declining dust density, although this is inferred from the visual extinction and not the infrared emision. The reason is most likely that dust gets produced in the context of star formation, but it also gets destroyed rapidly afterwards and disappears with time if not replenished by sufficient star formation. However, discussions of the life of dust are beyond the scope of this paper.
According to Calzetti et al. (2007) and Calzetti (2013) a very good star-formation indicator is the sum of star formation seen in Hαand 24µ, as it captures both unobscured star formation and dust-reprocessed light from obscured star formation. In the context of our inclination study, we note that such an indicator still shows an inclination trend, as the isotropically emitting 24µ-band is com-bined with the inclination-dependent Hα. While the combined indi-cator is intended to be a best-case estimate in an ensemble average, it will of course still overestimate individual star-formation rates in face-on galaxies and underestimate them at high inclination.
4.4 Trends of dust extinction with mass
Brinchmann et al. (2004) and Garn & Best (2010) measured the mass-dependency of Hαextinction for SDSS galaxies. Unfortu-nately, we are not able to measure trends with mass independently, e.g. using our24µdata, because the luminosity at24µdepends not only on star-formation rate but also on mass itself, as evidenced by non-linear calibrations for star-formation rate as a function of 24µ luminosity; this non-linearity has been studied in great de-tail and probably results from a mass dependence of metallicity and dust-star geometry (e.g. Calzetti et al. 2007; Davies et al. 2016; Brown et al. 2017). If we use a mean calibration from Brown et al. (2017) to convert 24µ-luminosity into predicted dust-corrected Hα -luminosity, and derive extinction by comparison with the observed Hα-luminosity, then we find results compatible with those of Brinchmann et al. (2004) and marginally lower than Garn & Best (2010), but the uncertainties are too large to be conclusive.
4.5 Impact of the galaxy cluster on the results
A valid question is, whether the results we find for our sample of cluster galaxies resembles properties of field galaxies or not. Tully et al. (1998) have used cluster samples before, but their disk galaxies from the relatively low-density Ursa Major and Pisces Clusters are expected to be similar to field spirals. The properties of Abell 901/2, our cluster, are more similar to those of the Virgo Cluster than Ursa Major and Pisces; indeed, B¨osch et al. (2013) found that in A901/2 many of the red spirals in particular have more centrally concentrated and more asymmetric emission-line disks than field spirals. Differences in the radial distribution of young stars, compared to field spirals, propagate into differences in the integrated effect of dust and inclination on star-formation indica-tors. Our sample contains roughly half-and-half galaxies that are inside and outside of the projected virial radius of the four sub-clusters in the Abell 901/2 system (see e.g. Heymans et al. 2008;
Weinzirl et al. 2017), but projection effects alone will wash out clear signatures.
Qualitatively, we expect that ram-pressure stripping or ther-mal evaporation could have removed some gas and dust from the outer disks of galaxies, especially those that are now seen as less star-forming as a consequence. This effect has been shown to be present in A901/2 by B¨osch et al. (2013), and the affected galaxies would now show less average extinction on their stellar population. How the persisting, more centrally located star-forming regions are extinguished in comparison to normal galaxies is not obvious. Cen-tral attenuation in normal galaxies is known to be higher than at-tenuation in outer disks, but ram pressure could have changed the dust-star geometry and models are not refined enough to reliably investigate populations of transitioning galaxies that are not in a known equilibrium configuration.
5 SUMMARY
We have studied the effect of inclination on the apparent brightness of normally star-forming galaxies in three spectral passbands com-monly used as star-formation indicators. As diagnostics we used mass-to-light ratios in the passbands: UV continuum at 280 nm, the Hαemission line, and the far-infrared continuum in theSpitzer 24µ-band. Our dataset is modest in size, with a few hundred galax-ies, but novel in its quality: compared to the SDSS, the imaging data are extremely deep in surface-brightness sensitivity, and inclination is measured from the outer disk contours in deep, high-resolution images observed with theHubble Space Telescope. Crucially, the Hαemission line is measured via tunable-filter imaging and en-compasses galaxies in their entirety, as opposed to fibre spectra that obtain only central measurements at low redshift. The sam-ple should have no selection biases, except that edge-on galaxies with low star formation are under-represented because of the re-quirements for Hα-detection.
Our sample is drawn from a volume centred on a few galaxy clusters, and hence the properties of some galaxies might be af-fected by the cluster evolution. Differences between these galax-ies and field samples are difficult to quantify, but the most likely difference is that our sample includes galaxies with reduced star formation in their outer disks.
We split our sample into a low-mass bin atlogM∗/M⊙ = [8.75,9.75], which is only complete in UV and Hαdetections, and a high-mass bin atlogM∗/M⊙>9.75that is complete in all three bands forLIR/L⊙&9.4. We find no indication of significant bi-ases in the stellar masses at inclinations up toi.80◦
, except for edge-on galaxies in the higher-mass bin oflogM∗/M⊙ >9.75, which appear underestimated; hence, we ignore this inclination range where mass enters the analysis.
In the higher-mass mass sample we find clear inclination trends of the mass-to-light ratio in the UV continuum from young stars and the Hαemission line from ionised gas regions, suggest-ing the presence of diffuse dust in the galaxy disks, which leads to increasing optical depths with increasing inclination. We estimate a dimming of the average massive disk galaxy from face-on to edge-on by∼ 1mag in the 280 nm passband and∼ 0.7mag in Hα. This implies that star-formation rates measured in UV 280 and Hα
would be underestimated in nearly edge-on galaxies by a factor of 2.5 and 2, respectively. We find no trend in the IR continuum, sug-gesting that dust emission is largely optically thin and isotropic in our sample.
contin-uum at 280 nm may be seen through lower optical depth in diffuse dust than Hα-emitting gas, but the significance is only2σ. This finding is irrespective of differences in mean or face-on extinction of the two populations. While it is well-known that Hα-emitting gas is typically more obscured than stars, our paper concerns only dust effects that manifest themselves with changing inclination, and hence describe the diffuse dust in a two-component model that also includes high-opacity dust clumps around star-forming regions.
The low-mass sample shows no measurable dependence in the brightness of a galaxy on inclination, which is consistent with the view that normally star-forming galaxies with < 5billion solar masses have typically low column densities in diffuse dust, such that they are mostly optically thin. They may still have clumpy dust at high column density associated with their star-forming regions, but such dust is expected to have a more locally isotropic distribu-tion, which does not lead to inclination-dependent effects and thus cannot be measured with the approach in this paper.
In a forthcoming paper we will study trends in the total extinc-tion of Balmer lines in the Abell 901/2 sample, using data from the PAnoramic Paschen-Alpha Survey (PAPAS, Wolf et al., in prepa-ration). That work will use the ratio of the Hαand the Paschen-α
line, and thus measure total extinction and its dependence on mass, inclination and star-formation rate.
ACKNOWLEDGEMENTS
CW acknowledges support from the ARC Laureate Fellowship FL0992131. AAS acknowledges the support from the Australian Research Council Centre of Excellence for All-sky Astrophysics (CAASTRO), through project number CE110001020, for a visit during which part of this paper was written. KH acknowledges the Royal Astronomical Society for financial support through an un-dergraduate research bursary. Based on observations made with the Gran Telescopio Canarias, installed in the Observatorio del Roque de los Muchachos of the Instituto de Astrof´ısica de Canarias, in the island of La Palma. The GTC reference for this programme is GTC2002-12ESO. Access to GTC was obtained through ESO Large Programme 188.A-2002. B.R.P acknowledges financial sup-port from the Spanish Ministry of Economy and Competitiveness through grant ESP2015-68964.
REFERENCES
Battisti, A. J., Calzetti, D., & Chary, R.-R. 2017, ApJ, 851, 90 Beckman, J. E., Peletier, R. F., Knapen, J. H., Corradi, R. L. M.,
& Gentet, L. J. 1996, ApJ, 467, 175
Bell, E. F. & de Jong, R. S. 2001, ApJ, 550, 212 Bell, E. F., Wolf, C., et al. 2004, ApJ, 608, 752
Bell, E. F., Papovich, C., Wolf, C., et al. 2005, ApJ, 625, 23 Bell, E. F., Zheng, X. Z., Papovich, C., Borch, A., Wolf, C. &
Meisenheimer, K., 2007, ApJ, 663, 834
Bertin, E. & Arnouts, S. 1996, A&A Suppl., 117, 393 B¨osch, B., B¨ohm, A., Wolf, C., et al. 2013, A&A, 549, A142 Borch, A., Meisenheimer, K., Bell, E. F., et al. 2006, A&A, 453,
869
Brinchmann, J., Charlot, S., White, S. D. M., et al. 2004, MNRAS, 351, 1151
Brown, M. J. I., Moustakas, J., Kennicutt, R. C., et al. 2017, ApJ, 847, 136
Calzetti, D., Kinney, A. L. & Storchi-Bergmann, T. 1994, ApJ, 429, 582
Calzetti, D., Armus, L., Bohlin, R. C., et al. 2000, ApJ, 533, 682 Calzetti, D. 2001, PASP, 113, 1449
Calzetti, D., Kennicutt, R. C., Engelbracht, C. W., et al. 2007, ApJ, 666, 870
Calzetti, D. 2013, Secular Evolution of Galaxies, ed. by J. Falc´on-Barroso & J. H. Knapen, Cambridge University Press, p. 419 Catchpole, R. M., Whitelock, P. A., & Glass, I. S. 1990, MNRAS,
247, 479
Cepa J. et al., 2013, Astrophysics and Space Science Proceedings, Highlights of Spanish Astrophysics V. Springer-Verlag, Berlin, p. 15
Chabrier, G. 2003, ApJL, 586, L133
Charlot, S., & Fall, S. M. 2000, ApJ, 539, 718
Chies-Santos, A. L., Rodr´ıguez del Pino, B., Arag´on-Salamanca, A., et al. 2015, MNRAS, 450, 4458
Cho, J., & Park, C. 2009, ApJ, 693, 1045
Cid Fernandes, R., Stasi´nska, G., Mateus, A., & Vale Asari, N. 2011, MNRAS, 413, 1687
Conroy, C. 2013, ARAA, 51, 393 Cunow, B. 1992, MNRAS, 258, 251
Dalcanton, J. J., Yoachim, P., & Bernstein, R. A. 2004, ApJ, 608, 189
Davies, L. J. M., Driver, S. P., Robotham, A. S. G., et al. 2016, MNRAS, 461, 458
de Vaucouleurs, G., de Vaucouleurs, A., Corwin, H. G., Jr., Buta, R. J., Paturel, G. & Fouque, P., 1991, Third Reference Catalogue of Bright Galaxies (New York: Springer)
Devour, B. M., & Bell, E. F. 2016, MNRAS, 459, 2054 Devour, B. M., & Bell, E. F. 2017, MNRAS, 468, L31
Disney, M., Davies, J., & Phillipps, S. 1989, MNRAS, 239, 939 Driver, S. P., Popescu, C. C., Tuffs, R. J., et al. 2007, MNRAS,
379, 1022
Fitzpatrick, E. L., 1999, PASP, 111, 63
Gallazzi, A., Bell, E. F., Wolf, C., et al. 2009, ApJ, 690, 1883 Garn, T. & Best, P. N. 2010, MNRAS, 409, 421
Giovanelli, R., Haynes, M. P., Salzer, J. J., Wegner, G., Da Costa, L. N. & Freudling, W., 1994, AJ, 107, 2036
Giovanelli, R., Haynes, M. P., Salzer, J. J., et al. 1995, AJ, 110, 1059
Grasha, K., Calzetti, D., Andrews, J. E., Lee, J. C., & Dale, D. A. 2013, ApJ, 773, 174
Gray, M. E., Wolf, C., Barden, M., et al. 2009, MNRAS, 393, 1275
Grootes, M. W., Tuffs, R. J., Popescu, C. C., et al. 2013, ApJ, 766, 59
Han, M. 1992, ApJ, 391, 617
Hao, C.-N., Kennicutt, R. C., Johnson, B. D., et al. 2011, ApJ, 741, 124
Heymans, C., Gray, M. E., Peng, C. Y., et al. 2008, MNRAS, 385, 1431
Holmberg, E. 1958, Meddelanden fran Lunds Astronomiska Ob-servatorium Serie II, 136, 1
Holwerda, B. W., Gonzalez, R. A., Allen, R. J., & van der Kruit, P. C. 2005, AJ, 129, 1396
Hubble, E. P., 1926, ApJ, 64, 321
Jedrzejewski, R. I. 1987, MNRAS, 226, 747 Kennicutt, R. C., Jr. 1983, ApJ, 272, 54 Kennicutt, R. C., Jr. 1998, ARAA, 36, 189
Leslie, S. K., Sargent, M. T., Schinnerer, E., et al. 2018, arXiv:1801.03501
Lonsdale Persson, C. J., & Helou, G. 1987, ApJ, 314, 513 Maller, A. H., Berlind, A. A., Blanton, M. R. & Hogg, D. W. 2009,
ApJ, 691, 394
Maltby, D. T., Gray, M. E., Arag´on-Salamanca, A., et al. 2012, MNRAS, 419, 669
Masters, K. L., Giovanelli, R. & Haynes, M. P. 2003, AJ, 126, 158 Masters, K. L., Nichol, R., Bamford, S., et al. 2010, MNRAS, 404,
792
McKinnon, R., Torrey, P., Vogelsberger, M., Hayward, C. C., & Marinacci, F. 2017, MNRAS, 468, 1505
Meurer, G. R., Heckman, T. M., & Calzetti, D. 1999, ApJ, 521, 64 Morselli, L., Renzini, A., Popesso, P., & Erfanianfar, G. 2016,
MNRAS, 462, 2355
Noeske, K. G., Weiner, B. J., Faber, S. M., Papovich, C., Koo, D. C., Somerville, R. S., et al. 2007, ApJ, 660, L43
Papovich, C. & Bell, E. F. 2002, ApJL, 579, L1
Papovich, C., Dole, H., Egami, E., et al. 2004, ApJS, 154, 70 Peletier, R. F., Valentijn, E. A., Moorwood, A. F. M., et al. 1995,
A&A, 300, L1
Popescu, C. C., Tuffs, R. J., Dopita, M. A., Fischera, J., Kylafis, N. D., & Madore, B. F., 2011, A&A, 527, 109
Rodr´ıguez del Pino, B., Arag´on-Salamanca, A., Chies-Santos, A. L., Weinzirl, T., et al. 2017, MNRAS, 467, 4200
Schiminovich, D., Wyder, T. K., Martin, D. C., Johnson, B. D., Salim, S., Seibert, M., Treyer, M. A., et al. 2007, AJ, 115, 2264 Somerville, R. S., & Primack, J. R. 1999, MNRAS, 310, 1087 Tacchella, S., Carollo, C. M., Forster Schreiber, N. M., et al. 2017,
ApJ, in press, arXiv:1704.00733
Tuffs, R. J., Popescu, C. C., V¨olk, H. J., Kylafis, N. D., & Dopita, M. A. 2004, A&A, 419, 821
Tully, R. B., & Fisher, J. R. 1977, A&A, 54, 661
Tully, R. B., Pierce, M. J., Huang, J.-S., Saunders, W., Verheijen, M. A. W. & Witchalls, P. L., 1998, AJ, 115, 2264
Unterborn, C. T. & Ryden, B. S. 2008, ApJ, 687, 976 Valentijn, E. A. 1990, Nature, 346, 153
Valentijn, E. A. 1994, MNRAS, 266, 614
Weinzirl, T., Arag´on-Salamanca, A., Gray, M. E., et al. 2017, MN-RAS, 471, 182
White, R. E., III, Keel, W. C., & Conselice, C. J. 2000, ApJ, 542, 761
Wild, V., Charlot, S., Brinchmann, J., et al. 2011, MNRAS, 417, 1760
Wolf, C., Arag´on-Salamanca, A., Balogh, M., et al. 2009, MN-RAS, 393, 1302
Wolf, C., Gray, M. E. & Meisenheimer, K. 2005, A&A, 443, 435 Wolf, C., Meisenheimer, K., Rix, H.-W., et al. 2003, A&A, 401,
73
Wolf, C., Meisenheimer, K., Kleinheinrich, M. et al., 2004, A&A, 421, 913
Wuyts, S., Labbe, I., Franx, M., Rudnick, G., van Dokkum, P. G., Fazio, G. G., F¨orster-Schreiber, N. M., Huang, J., et al., 2011, ApJ, 742, 96
Wuyts, S., F¨orster-Schreiber, N. M., Van Der Wel, A., Magnelli, B., Guo, Y., Genzel, R., Lutz, D. et al., 2011, ApJ, 742, 96 Xilouris, E. M., Byun, Y. I., Kylafis, N. D., Paleologou, E. V., &
Papamastorakis, J. 1999, A&A, 344, 868
Yip, C.-W., Szalay, A. S., Wyse, R. F. G., et al. 2010, ApJ, 709, 780