Monotonic Direct Simple Shear Tests on Sand under
Multidirectional Loading
Yao Li, S.M.ASCE
1; Yunming Yang
2; Hai-Sui Yu, M.ASCE
3; and Gethin Roberts
4Abstract:Stress–strain responses of Leighton Buzzard sand are investigated under bidirectional shear. The tests are conducted by using the
variable direction dynamic cyclic simple shear (VDDCSS). Soil samples are anisotropically consolidated under a vertical normal stress and horizontal shear stress and then sheared in undrained conditions by applying a horizontal shear stress acting along a different direction from the consolidation shear stress. The influence of the orientation and magnitude of the consolidation shear stress is investigated in this study. There have been only a few previous studies on soil responses under bidirectional shear, of which most studies do not consider the impact of the magnitude of the consolidation shear stress. They are compared with current studies, indicating both similarities and differences. Generally, all test results indicate that a smaller angle between thefirst and second horizontal shear stress leads to more brittle responses with higher peak strengths, and a larger angle leads to more ductile responses. In addition, the consolidation shear tends to make soil samples denser, and both the magnitude of consolidation shear stress and its direction influence the following stress–strain responses of soil samples. DOI: 10.1061/(ASCE)GM.1943-5622.0000673.This work is made available under the terms of the Creative Commons Attribution 4.0 International license, http://creativecommons.org/licenses/by/4.0/.
Introduction
Studying soil behavior under shear stress is an important research topic in soil mechanics (Ishihara 1993; Sassa and Sekiguchi 2001;Yang and Yu 2013;Toyota et al. 2014;Guo et al. 2014). Commonly used testing facilities are hollow cylinder and direct simple shear apparatuses. A large number of experimental data are available by using these facilities under various loading con-ditions. However, there is one salient limitation in these experi-ments: there is only one shear stress exerted on a soil sample. In most geotechnical engineering applications, soil is often sub-jected to the shear stress along multiple directions, such as in embankments under an earthquake strike and in the foundations of breakwater. There is a static shear stress acting along the slope caused by gravity in embankments, and an earthquake strike gen-erates another shear stress that is generally not in line with the slope direction. The incident, reflected, and refracted waves also generate multiple dimensional shear stresses on soil under break-water. Those complex loading conditions cannot be simulated using the traditional simple shear and hollow cylinder appara-tuses, which can only exert one shear stress in soil samples.
To better understand soil behavior under multiple shears, a few researchers developed in-house bidirectional direct simple shear apparatuses, in which two shear stresses can be exerted on a soil specimen independently from orthogonal directions. However, the types of soil tested and experimental data are very limited. To the authors’knowledge, dynamic loading tests are mainly conducted on sand, such as Fuji, Sacramento River, Monterey, and Toyoura sands (Ishihara and Yamazaki 1980;Boulanger et al. 1993;Boulanger and Seed 1995;Kammerer 2002;Matsuda et al. 2011). Static loading tests are mainly conducted on clay, such as Boston blue clay, Young Bay mud, and Mexico Gulf clay (DeGroot et al. 1993;Biscontin 2001;Rutherford 2012). In these static loading tests on clay, soil specimens are first sheared under drained conditions along one direction, which is also called the consolidation shear stress, fol-lowed by undrained shear along different directions. There is a clear trend in these stress–strain responses, which is distinctly dependent on the angle between thefirst drained shear stress direction and the second undrained shear stress direction. A smaller angle leads to a higher strength and more brittle response. However, in these static loading tests, generally only one consolidation shear is considered in soil specimens, and the soil studied is mainly clay.
Similar apparatuses are also used in the investigation of inter-face behavior between structural and geologic material and joints in rocks. Fakharian and Evgin (1993,1996) tested soil and metal interface under monotonic and cyclic loading using a device that exerted static and cyclic loading in vertical and two horizontal directions. Desai and Rigby (1997) and Toufigh et al. (2014) tested soil-structural interfaces using a cyclic multi-degree-of-freedom device (CYMDOF-P). The CYMDOF-P can apply static and cyclic loading under direct and simple shear deformations with pore-water pressure measurement. When using CYMDOF-P, three motions can be added between two samples, including vertical loading, shear loading, and rotation perpendicular to the shearing direction.
In this paper, the stress–strain responses of Leighton Buzzard sand, which is British standard sand, are investigated under static loading by using the bidirectional direct simple shear apparatus. The investigation is comprehensive because different levels of 1Ph.D. Research Student, Dept. of Civil Engineering, International
Doctoral Innovation Centre, Univ. of Nottingham Ningbo, 199 Taikang East Rd., Ningbo 315100, China. E-mail: [email protected]
2Associate Professor, Dept. of Civil Engineering, Univ. of Nottingham Ningbo, 199 Taikang East Rd., Ningbo 315100, China (corresponding author). E-mail: [email protected]
3Professor, Nottingham Center for Geomechanics, Univ. of Nottingham United Kingdom, University Park, Nottingham NG7 2RD, U.K. E-mail: [email protected]
4Professor, Dept. of Civil Engineering, Univ. of Nottingham Ningbo, 199 Taikang East Rd., Ningbo 315100, China. E-mail: gethin.roberts@ nottingham.edu.cn
Note. This manuscript was submitted on July 14, 2015; approved on February 11, 2016; published online on April 19, 2016. Discussion period open until September 19, 2016; separate discussions must be submitted for individual papers. This paper is part of the International Journal of Geomechanics, © ASCE, ISSN 1532-3641.
consolidation shear are considered, as well as different angles between consolidation shear direction and the second undrained shear direction. The apparatus used is called the variable direction dynamic cyclic simple shear (VDDCSS), which is manufactured
by Global Digital Systems (GDS) Instruments Ltd. (Hampshire, U.K.). This is thefirst commercially available bidirectional direct simple shear apparatus.
Simple Shear Tests
Testing Facility
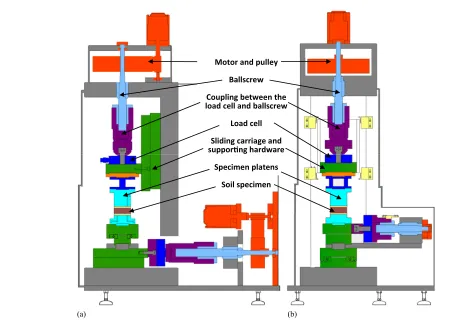
[image:2.612.44.292.95.339.2]The VDDCSS is controlled (and data acquired) via firmware and software written specifically for the VDDCSS by GDS Instruments. Stress control and strain control with user-defined specifications are available. Fig.1shows the apparatus in which two orthogonal shear stresses can independently be applied on a soil specimen. Fig.2shows the schematic diagram of the opera-tion mechanism. Three electromechanical actuators are used on the VDDCSS instead of additional pressure controllers, hydraulic power packs, or control boxes, which make the equipment operate more stably. One actuator applies vertical (normal) stress to the cylindrical soil specimen, whereas the other two actuators apply horizontal (shear) stresses to the specimen. The secondary shear actuator that acts at 90° to the primary shear actuator enables the VDDCSS to perform simple shear tests in any horizontal direc-tion, as shown in Fig.2. The three electromechanical actuators are controlled via three synchronized entry-level dynamic control system (ELDCS) units. The control loop for the actuator control runs at 500 Hz. All the actuators are encoder controlled with high accuracy, and each actuator can be controlled using position or load control. The position control is performed using a voltage (motor rotational velocity)-based proportional integral derivative
Fig. 1. The VDDCSS: (a) overall picture; (b) prepared soil specimen; (c) specimen under undrained shearing
Motor and pulley
Ballscrew
Coupling between the load cell and ballscrew
Load cell
Sliding carriage and supporng hardware
Specimen platens
Soil specimen
(a) (b)
Fig. 2. Schematic diagram of operation mechanism: (a)x,z-plane; (b)y,z-plane
[image:2.612.49.507.389.712.2](PID) control. The load control is performed using current motor torque–based PID control.
The vertical axis includes one 5-kN pancake load cell for con-trolling and measuring vertical load, and its axial force accuracy is typically smaller than 0.1% of full range. One LVDT, ranging from−2.5 toþ2.5 mm, is used for measuring vertical displace-ment (primary transducer for measuredisplace-ment), along with the motor encoder for measuring the vertical displacement. The nom-inal accuracy of the LVDTs with signal conditioning included is60.15% of full range. Each horizontal axis includes one 2-kN pancake load cell at the bottom for controlling and measuring horizontal load and one LVDT for measuring horizontal displace-ment (primary transducer for measuredisplace-ment), along with the motor encoder for measuring horizontal displacement. It also includes a62-kN two-axis platform-type shear load cell, located directly above the specimen top-cap, used as the primary mea-surement for horizontal loads. Shear load meamea-surements have the resolution of 0.1 N. The horizontal LVDT has a range from−10 toþ10 mm for shear displacement measurement.
A cylindrical specimen 70 mm in diameter and 17 mm in height is used in tests, which gives a high diameter-to-height ratio to mini-mize the nonuniformity of stress and strain in the specimen
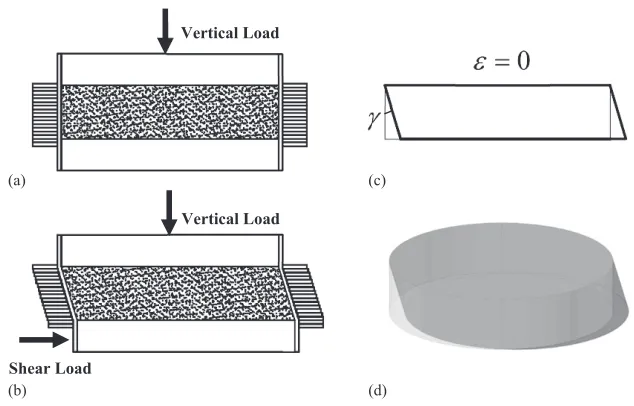
(Boulanger and Seed 1995;Kim 2009;Matsuda et al. 2004). A stack of low-friction Teflon-coated rings (each ring is 1 mm high) is placed outside the membrane of the specimen. The rings are stiff enough to ensureK0conditions. The details of a specimen are shown in Fig.3. Undrained loading tests are performed under constant vol-ume condition. In a constant volvol-ume test, the height and diameter of the specimen are constant, and the bottom of the sample moves in the shearing direction with afixed rate while the top of the specimen isfixed, as shown in Fig.4. A change of vertical stress in a dry speci-men is assumed equivalent to the excess pore-water pressure gener-ated when a saturgener-ated specimen is tested under true undrained condi-tions (Feda 1971;Moussa 1973;Finn 1985;Dyvik et al. 1987).
Testing Material and Procedure
Leighton Buzzard sand (Fraction B) is tested. It has sub-rounded particles and contains mainly quartz with some car-bonate material. The grading curve of the soil is shown in Fig. 5. Its maximum and minimum void ratios are 0.79 and 0.46, respectively. Its mean diameter (D50) is 0.82 mm, and effective grain size (D10) is 0.65 mm with a uniformity coeffi-cient (D60/D10) at1.38 (Alsaydalani and Clayton 2014). It is British standard sand and has been extensively studied by numerous research institutes including the Nottingham Centre
Teflon Coated Rings
Rubber Membrane
Top Plate
Bottom Plate O-ring
Drainage Specimen
Porous Disc
[image:3.612.45.294.298.459.2]O-ring
Fig. 3. Sectional details of a specimen in VDDCSS
Vertical Load Vertical Load
Shear Load
(a)
(b)
(c)
[image:3.612.337.547.318.454.2](d)
Fig. 4. Schematic of a specimen: (a) at consolidation; (b) under an undrained shear stress; (c) strain state under an undrained shear stress; (d) deforma-tion of a specimen in 3D
Fig. 5. Grading curve of Leighton Buzzard sand (Fraction B)
[image:3.612.146.463.497.700.2]for Geomechanics (NCG), Nottingham, U.K. (Cai 2010; Yang 2013). Samples are prepared by the dry deposition technique (Ishihara 1993). Weighed sand isfilled into a membrane using a funnel with zero drop height to obtain the loosest possible relative density. The funnel is first placed at the center of the
bottom of an empty mold, and then sand is poured into the mold through the funnel with a constantflow rate. To maintain the zero drop height, the funnel is carefully moved upward dur-ing the process. A higher density is achieved by tappdur-ing the side of the mold in a uniform and consistent way. Samples are consolidated to an initial confining pressure of 200 kPa for 30 min. Measured vertical displacement is used to calculate the relative density after consolidation. The relative density (Dr) after consolidation is controlled approximately at 48% unless specified otherwise.
A static shear stress is exerted on a specimen during consolida-tion, followed by the second undrained shear stress, until failure of the sample, as shown in Fig.6. Depending on the tests, the direction of the consolidation shear stress varies at different tests, from 0° to 180° with an interval of 30°. The second undrained shear is always along thex-direction, and the shearing rate is at 0.01 mm/min. In the following test results, the shear strain means along thex-direction unless specified otherwise. Two different magnitudes of shear stress during consolidation are considered at all directions, which give a
0°
30°
60°
90°
180°
150°
120°
Y
Consolidation Undrained
Shear Stress Shear Stress
[image:4.612.59.276.107.208.2]X
Fig. 6. Stress paths on soil samples including thefirst consolidation shear stress followed by undrained shear
Fig. 7. Undrained responses of shear stress and pore-water pressure with shear strain under different relative densities and normal pressure: (a) shear stress; (b) pore-water pressure
[image:4.612.85.489.253.699.2]ratio to the initial vertical stress, the consolidation shear ratio (CSR), at 0.05 and 0.1, respectively. In addition, the largest CSR of 0.15 is also imposed along the directions of 0° and 180°. Details of the performed tests are summarized in Table1. All tests are termi-nated after the effective vertical stress drops below 10% of the ini-tial vertical stress. This is because the existence of shear stress pre-vents the effective vertical stress from reaching zero (Ishihara and Yamazaki 1980;Kammerer 2002).
Test Results
Monotonic Tests with K0Consolidation
To examine the general behavior of Leighton Buzzard sand, the samples are sheared to failure under undrained conditions without the consolidation shear stress under different relative densities and vertical pressures. Two relative densities,Dr= 48 and 68%, and two vertical normal pressures, 100 and 200 kPa, are considered. Fig.7 shows the responses of shear stresses and equivalent pore-water pressures with the shear strain. It shows that increasing relative den-sity and normal pressure increases the soil strength. In addition, the figure shows that the shear stress experiences a considerable drop after its peak value, and its pore-water pressure constantly increases even for the dense sand. It indicates that this type of sand is contrac-tion dominant under simple shear loading.
Tests with Shear Reversal
The first set of tests with 0° and 180° of the consolidation shear stresses are conducted. Fig.8shows the responses of shear stress and pore-water pressure under different CSRs at 0.05, 0.1, and 0.15, together with the response without the consolidation shear stress. Fig. 8(a) indicates that the responses at 0° consolidation shear stresses feature a higher strength and more brittleness than that without the consolidation shear stress. This feature is more evident with increasing CSR. The CSR of 0.15 leads to the most brittle response and the highest strength, followed by CSRs of 0.1 and 0.05. In contrast, the responses with 180° consolidation shear stresses feature more ductility than that without the consolidation shear stress, and the ductility increases with increasing CSR. In addition, the shear strengths for 180° consolidation shear stresses are all higher than that without the consolidation shear stress.
Fig.8(b)shows the development of equivalent pore-water pres-sures with the shear strain. There is a continuous increase of
pore-water pressures throughout all tests, indicating contraction domi-nance in drained counterpart conditions, similar to the tests without the consolidation shear stress. It also indicates that there is a connec-tion between rates of pore-water pressure increase and degrees of ductility shown in Fig.8(a). Its increasing rate in the tests with 180° consolidation shear stresses is much lower than that with 0° consoli-dation shear stresses and without the consoliconsoli-dation shear stress, especially during the early stage of tests. For the former, the early stage of tests is actually unloading to zero shear stress. The lower increasing rate of pore-water pressure is consistent with the more ductility of the stress–strain responses in the tests with 180° consoli-dation shear stresses. This is caused by the shear strain developed during unloading that increases the shear strain. In contrast, the increasing rate of pore-water pressure in the tests with 0° consolida-tion shear stresses is higher than that without the consolidaconsolida-tion shear stress. Even within the same type of tests, the increasing rate of pore-water pressure is consistent with the degree of ductility. For instance, in the tests with 0° consolidation shear stresses, the increasing rate for the CSRs of 0.15 and 0.1 is larger than that for the CSR of 0.05. Correspondingly, the ductility of the former is smaller than the latter. It is the same in the tests with 180° consolida-tion shear stresses; the order of increasing rate for the CSR is 0.15, 0.1, and 0.05, and the order of ductility is reversed.
Tests with Various Directions of the Consolidation Shear Stress
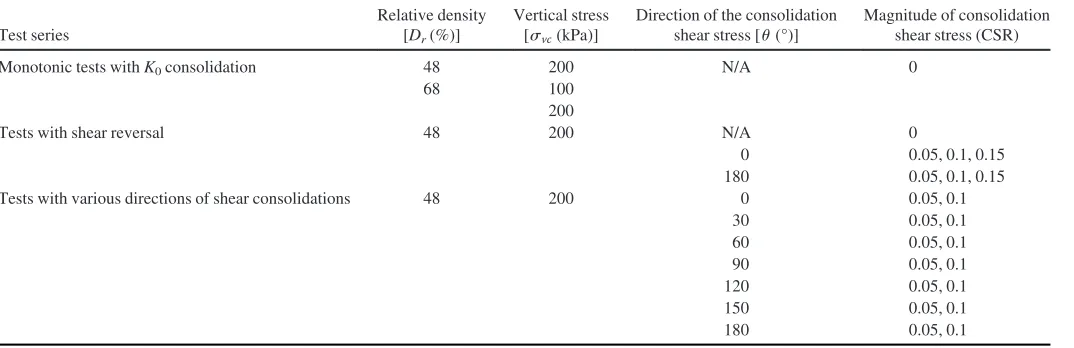
[image:5.612.44.581.49.223.2]Tests under the CSRs of 0.05 and 0.1 are conducted assuming dif-ferent orientation of the consolidation shear stresses. Fig. 9(a) shows the shear stress and shear strain curves under the CSR of 0.05 since the start of undrained shearing, along with the soil response obtained without the CSR. It indicates that the ductility generally increases with the increasing angle of the consolidation shear stress. The pattern of strength variation with the direction of the consolidation shear stress is more complicated. It first decreases with increasing angle to the minimum strength at 90°, followed by an increase of strength with the angle to 180°. It is interesting to note that, regardless of the orientation of the consol-idation shear stress, the soil strength keeps values larger than that without the consolidation shear stress, with the maximum at 0°. This is because the sand is contraction dominant under the direct simple shear, and the drained consolidation shear stress tends to make the sand denser. Fig.9(b)shows the development of equiva-lent pore-water pressure. The general trend is that the increasing rate of pore-water pressure decreases with the increasing angle of Table 1.Test Conditions of Undrained Simple Shear Tests
Test series
Relative density [Dr(%)]
Vertical stress [svc(kPa)]
Direction of the consolidation shear stress [u(°)]
Magnitude of consolidation shear stress (CSR)
Monotonic tests withK0consolidation 48 200 N/A 0
68 100
200
Tests with shear reversal 48 200 N/A 0
0 0.05, 0.1, 0.15
180 0.05, 0.1, 0.15
Tests with various directions of shear consolidations 48 200 0 0.05, 0.1
30 0.05, 0.1
60 0.05, 0.1
90 0.05, 0.1
120 0.05, 0.1
150 0.05, 0.1
180 0.05, 0.1
consolidation shear stress, and that at a 180° angle is markedly lower than the others.
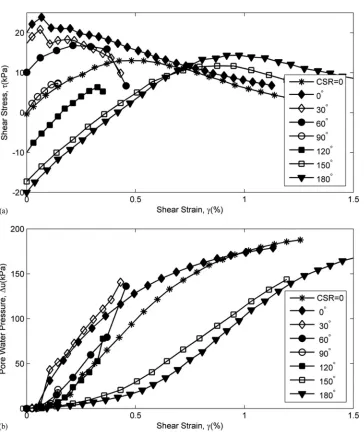
Fig.10shows the shear stress and shear strain curves and the evolution of the pore-water pressures with the shear strain under the CSR of 0.1, since the start of undrained shearing, together with the test result without the consolidation shear stress. There are similarities and differences in response patterns between the CSRs of 0.1 and 0.05. The degree of ductility under the CSR of 0.1 also increases with an increasing angle of the consolidation shear stress. The strengthfirst decreases, followed by an increase with an increasing angle as well, and the increasing rate of pore-water pressure decreases with an increasing angle. However, unlike the responses under the CSR of 0.05 in which all the strengths with the consolidation shear stress are higher than that without the consolidation shear stress, the strengths at angles including 90°, 120°, and 150° are lower than the latter. In addi-tion, the responses at some angles stop immediately after reaching their peak values at small strains, such as at 90° and 120° angles. This is because a larger shear stress along they-direction near the 90° angle, exerted during the consolidation shear stress, makes the sample fail along the y-direction instead of thex-direction.
Fig.11shows the strain along thex-andy-directions for angles from 30° to 150° under the CSR of 0.1. It indicates that the strain along the y-direction becomes more dominant when the angle is closer to 90°. Under the CSR of 0.05, the shear stress along the y-direction exerted during the consolidation shear stress is not large enough to make it dominant.
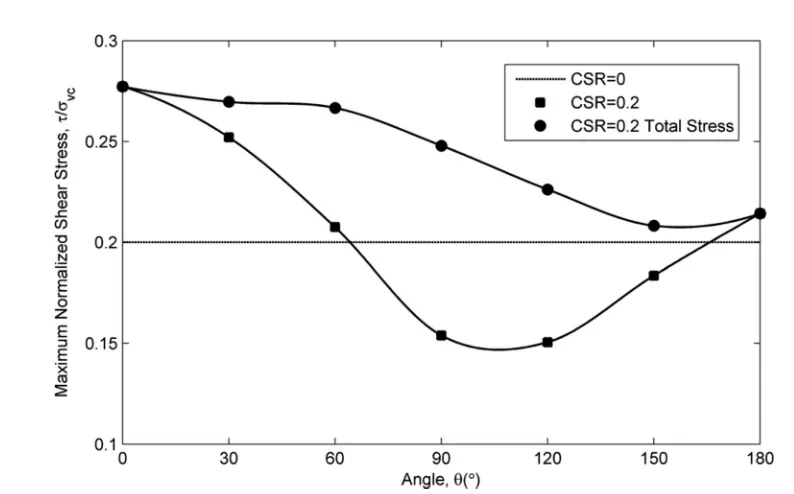
Fig.12shows the relationship between the shear strength and angle of shearing for the CSRs of 0.05 and 0.1, in which all total shear strengths are shown, as well as the strength along undrained shearing direction (thex direction, as shown in Fig.6). The total strength is obtained by combining the consolidation shear stress and the undrained shear stress. The shear strength without the consolida-tion shear stress is also shown in thefigure for comparison. For the shear strength along thex-direction, thefigure indicates that a larger CSR leads to a larger impact of angles. At smaller angles, the shear strength under the CSR of 0.1 is larger than that under the CSR of 0.05. At larger angles it is the opposite. The larger angle impact of a larger CSR is also reflected by the greater difference of shear strength at different angles. Although the largest difference under the CSR of 0.05 is 4 kPa, it is 19 kPa under the CSR of 0.1. Even though the shear strengths under the CSR of 0.05 are all above the
Fig. 8. Responses for the shear reversal at 0° and 180° under different CSRs: (a) shear stress; (b) pore-water pressure
[image:6.612.127.492.279.713.2]strength without the consolidation shear stress, the strength under the CSR of 0.1 at 90° and 120° angles are so small that they are well below the strength without the consolidation shear stress. Fig.12 also shows that the total shear strengths for both CSRs are above the shear strength without the consolidation shear stress. The biggest difference is at the 90° angle in both cases, in which the direction of initial drained consolidation shear stress is orthogonal to the follow-ing undrained shearfollow-ing direction. Although the total shear strength is moderately larger than the strength along thex-direction under the CSR of 0.05, it is considerably larger under the CSR of 0.1 at the angles near 90°. A comparison of the difference of these two shear strengths at 90° and 120° angles under the CSR of 0.1 indicates that the shear strength is predominant along they-direction. This explains why the sample fails at small strains along thex-direction under the CSR of 0.1 at these two angles, as shown in Fig.10.
Discussion
There are only a few studies about the influences of consolidation shear stresses on the undrained soil behaviors under monotonic
loading. For instance, Sivathayalan and Ha (2011) performed direct simple shear tests on sand under consolidation shear stresses with 0° and 180° angles. DeGroot et al. (1996), Biscontin (2001), and Rutherford (2012) performed tests on different types of clay under the consolidation shear stresses with angles ranging from 0° to 180° by using bidirectional direct simple shear apparatuses. Thefindings in this paper are similar to theirs in many aspects. Generally, a smaller angle leads to more brittle responses and higher peak strength. Conversely, a larger angle leads to more ductile responses. The strength near 90° is the smallest. The total strength obtained by combining the consolidation shear stress and undrained shear strength is generally larger than the shear strength without the con-solidation shear stress. When the concon-solidation shear stress angle is close to 90°, shear failure largely takes place along the direction of the consolidation shear stress instead of the undrained shear direc-tion (DeGroot et al. 1996).
[image:7.612.127.490.279.710.2]However, the findings on shear strength in this paper do not completely agree with those in previous studies. The shear strength along undrained shear direction is lower than that without the con-solidation shear stress at some angles in previous studies, especially the angles close to 90°. For example, Fig.13shows the test results
Fig. 9. Responses for different angles of shear consolidation under the CSR of 0.05: (a) shear stress; (b) pore-water pressure
of shear strength at various angles by DeGroot et al. (1996). Although the total strengths at all angles are greater than that with-out the consolidation shear stress, the shear strength along undrained shear direction is lower than the latter at 90°, 120°, and 150° angles. Comparing these results with those presented in Fig. 12, the relationship under the CSR of 0.1 is exactly the same as that by DeGroot et al. (1996). On the other hand, the strengths at all angles under the CSR of 0.05 are greater than that without the con-solidation shear stress, although the strength near 90° is still the smallest. This is because the sand is contraction dominant under direct simple shear, and the consolidation shear stress densifies soil samples, verified by the development of positive pore-water pres-sure throughout the undrained shearing test. In other words, the strength is dependent on two factors: soil density and the angle of the consolidation shear stress. Under a smaller CSR, the role of soil density is predominant over the role of shearing angles, and under a larger CSR, it is the opposite.
[image:8.612.127.491.24.457.2]There is a weakness in the VDDCSS because the horizontal stress is unknown. This can cause limitations when thoroughly interpreting test results. Assumptions on the horizontal stress have to be made
Fig. 10. Responses for different angles of shear consolidation under the CSR of 0.1: (a) shear stress; (b) pore-water pressure
Fig. 11. Shear strain development along bothx- andy-directions under the CSR of 0.1
[image:8.612.44.293.504.697.2]for the test results to be used in the study of constitutive modeling and noncoaxiality. However, it provides insights into soil stress– strain responses under multiple directional shears. Alternatively, it can be integrated with the test results by using the hollow cylinder apparatus, and a study is under way along this direction.
Conclusions
This paper investigates the impact of consolidation shear stress on stress–strain responses of Leighton Buzzard sand by using VDDCSS. Two factors are studied: the influence of the orientation and magnitude of the shear stress applied during the consolidation
stage. Seven angles are considered ranging from 0° to 180° with an interval of 30°. Two CSRs, 0.05 and 0.1, are considered. The find-ings from the study include the following:
1. For both CSRs, a smaller angle leads to a more brittle response and higher peak strength, and the most brittle response and the highest peak strength take place at a 0°angle. A larger angle leads to a more ductile response, and the most ductile response occurs at a 180° angle. When the angle is close to 90°, the peak strength is the smallest and failure is more likely to occur along the direc-tion of the consolidadirec-tion shear stress.
[image:9.612.130.485.33.263.2]2. Under a smaller CSR, the peak strength at all angles is greater than that without the consolidation shear stress. Under a larger CSR, the peak strength at the angles near 90° is considerably
Fig. 12. Shear strength along thex-direction and the total shear strength for different angles of shear consolidation under the CSRs of 0.05 and 0.1
Fig. 13. Shear strength along undrained shearing direction and the total shear strength for different angles of shear consolidation by DeGroot et al. (1996)
[image:9.612.99.496.296.543.2]smaller than the latter. This is because the consolidation shear stress densifies soil samples, and the role of densification is pre-dominant over the role of angles under a smaller CSR.
3. The test results in the paper are compared with previous studies on the impact of the consolidation shear stress. Most of the pre-vious studies consider only one magnitude of the consolidation shear stress. The comparison indicates both similarities and dif-ferences. The reason for the differences is because previous studies used a larger CSR.
Acknowledgments
The support of the National Natural Science Foundation of China (NSFC Contract No. 11172312/A020311) and the International Doctoral Innovation Centre (IDIC) scholarship scheme is gratefully acknowledged. We also acknowledge the support from the Ningbo Education Bureau, Ningbo Science and Technology Bureau, China’s MoST, and the University of Nottingham. The work is also partially supported by EPSRC Grant No. EP/L015463/1.
References
Alsaydalani, M., and Clayton, C. (2014).“Internalfluidization in granular soils.”J. Geotech. Geoenviron. Eng.,10.1061/(ASCE)GT.1943-5606 .0001039, 1–10.
Biscontin, G. (2001).“Modeling the dynamic behavior of lightly overcon-solidated soil deposits on submerged slopes.”Ph.D. thesis, Univ. of California, Berkeley, CA.
Boulanger, R., and Seed, R. (1995).“Liquefaction of sand under bidirectional monotonic and cyclic loading.”J. Geotech. Engrg.,10.1061/(ASCE)0733 -9410(1995)121:12(870), 870–878.
Boulanger, R. W., Chan, C. K., Seed, H. B., and Seed, R. B. (1993).“A low-compliance bi-directional cyclic simple shear apparatus.”Geotech Test. J., 16(1), 36–45.
Cai, Y. Y. (2010).“An experimental study of non-coaxial soil behaviour using hollow cylinder testing.” Ph.D. thesis, Univ. of Nottingham, Nottingham, U.K.
DeGroot, D., Ladd, C., and Germaine, J. (1996).“Undrained multidirec-tional direct simple shear behavior of cohesive soil.”J. Geotech. Engrg., 10.1061/(ASCE)0733-9410(1996)122:2(91), 91–98.
DeGroot, D. J., Germaine, J. T., and Ladd, C. C. (1993).“The multidirec-tional direct simple shear apparatus.”Geotech. Test. J., 16(3), 283–295. Desai, C. S., and Rigby, D. B. (1997).“Cyclic interface and joint shear
de-vice including pore pressure effects.”J. Geotech. Geoenviron. Eng., 123(6), 568–579.
Dyvik, R., Berre, T., Lacasse, S., and Raadim, B. (1987).“Comparison of truly undrained and constant volume direct simple shear tests.” Geotechnique, 37(1), 3–10.
Fakharian, K., and Evgin, E. (1993).“A three-dimensional apparatus for cyclic testing of interfaces.”Proc., 46th Canadian Geotechnical Conf., 485–493.
Fakharian, K., and Evgin, E. (1996).“An automated apparatus for three-dimensional monotonic and cyclic testing of interfaces.”Geotech. Test. J., 19(1), 22–31.
Feda, J. (1971).“Constant volume shear tests of saturated sand.”Arch. Hydrotech., 18(3), 349–367.
Finn, W. D. L. (1985).“Aspects of constant volume cyclic simple shear, advances in the art of testing soils under cyclic conditions.” Proc., Advances in the Art of Testing of Soils under Cyclic Conditions, V. Khosla, ed., ASCE, Reston, VA, 74–98.
Guo, Z., Jeng, D., and Guo, W. (2014).“Simplified approximation of wave-induced liquefaction in a shallow porous seabed.”Int. J. Geomech.,10 .1061/(ASCE)GM.1943-5622.0000366, 06014008.
Ishihara, K. (1993).“Liquefaction andflow failure during earthquake.” Geotechnique, 43(3), 351–415.
Ishihara, K., and Yamazaki, F. (1980).“Cyclic simple shear tests on satu-rated sand in multi-directional loading.”Soils Found., 20(1), 45–59. Kammerer, A. (2002).“Undrained response of Monterey 0/30 sand under
multidirectional cyclic simple shear loading conditions.”Ph.D. thesis, Univ. of California, Berkeley, CA.
Kim, Y. S. (2009).“Static simple shear characteristics of Nak-dong River clean sand.”KSCE J. Civ. Eng., 13(6), 389–401.
Matsuda, H., Hendrawan, A. P., Ishikura, R., and Kawahara, S. (2011).
“Effective stress change and post-earthquake settlement properties of granular materials subjected to multi-directional cyclic simple shear.” Soils Found., 51(5), 873–884.
Matsuda, H., Shinozaki, H., Okada, N., Takamiya, K., and Shinyama, K. (2004).“Effects of multi-directional cyclic shear on the post-earthquake settlement of ground.” Proc., 13th World Conf. on Earthquake Engineering, Vancouver, Canada.
Moussa, A. (1973).“Constant volume simple tests on Frigg sand.”Internal Rep. 51505-2, Norwegian Geotechnical Institute, Oslo, Norway, 19. Rutherford, C. J. (2012).“Development of a multi-directional direct simple
shear testing device for characterization of the cyclic shear response of marine clays.”Ph.D. thesis, Texas A&M Univ., College Station, TX. Sassa, S., and Sekiguchi, H. (2001).“Analysis of wave-induced liquefaction
of sand beds.”Geotechnique, 51(2), 115–126.
Sivathayalan, S., and Ha, D. (2011).“Effect of static shear stress on the cyclic resistance of sands in simple shear loading.”Can. Geotech. J., 48(10), 1471–1484.
Toufigh, V., Desai, C., Saadatmanesh, H., Toufigh, V., Ahmari, S., and Kabiri, E. (2014). “Constitutive modeling and testing of interface between backfill soil andfiber-reinforced polymer.”Int. J. Geomech., 10.1061/(ASCE)GM.1943-5622.0000298, 04014009.
Toyota, H., Susami, A., and Takada, S. (2014).“Anisotropy of undrained shear strength induced by k0consolidation and swelling in cohesive soils.” Int. J. Geomech.,10.1061/(ASCE)GM.1943-5622.0000344, 04014019. Yang, L. T. (2013).“Experimental study of soil anisotropy using hollow
cylinder testing.”Ph.D. thesis, Univ. of Nottingham, Nottingham, U.K. Yang, Y., and Yu, H. S. (2013).“A kinematic hardening soil model
consid-ering the principal stress rotation.” Int. J. Numer. Anal. Methods Geomech., 37(13), 2106–2134.