Arch Iran Med. May 2018;21(5):213-222
Systematic Review
Estimation and Prediction of Avoidable Health Care Costs
of Cardiovascular Diseases and Type 2 Diabetes Through
Adequate Dairy Food Consumption: A Systematic Review
and Micro Simulation Modeling Study
Mehdi Javanbakht, PhD1; Ahmad Reza Jamshidi, MD2*; Hamid Reza Baradaran, MD3; Zahra Mohammadi, MSc2; Atefeh Mashayekhi, MSc1; Farhad Shokraneh, MSc4; Mohsen Rezai Hamami, MD5, Raziyeh Yazdani Bakhsh, MSc6; Hossien Shabaninejad, PhD7; Sajad Delavari, PhD8; Arash Tehrani, PhD3
1Health Economics Group, Institute of Health & Society, Newcastle University, UK 2Rheumatology Research Center, Tehran University of Medical Sciences, Tehran, Iran
3Endocrine Research Center , Institute of Endocrinology and Metabolism, Iran University of Medical Sciences, Iran 4Cochrane Schizophrenia Group, University of Nottingham, UK
5Health Economics and Health Technology Assessment, Institute of Health and Wellbeing, University of Glasgow, UK
6Health Information Management, Health Management and Economic Research Center, Isfahan University of Medical Sciences, Isfahan, Iran, 7Department of Health Services Management, School of Health Management and Information Sciences, Iran University of Medical Sciences,
Iran
8Health Human Resources Research Center, School of Management & Information Sciences, Shiraz University of Medical Sciences, Shiraz,
Iran
Received: August 22, 2016, Accepted: January 31, 2018, ePublished: May 1, 2018
Abstract
Background: Recent evidence from prospective cohort studies show a relationship between consumption of dairy foods and cardiovascular diseases (CVDs) and type 2 diabetes mellitus (T2DM). This association highlights the importance of dairy foods consumption in prevention of these diseases and also reduction of associated healthcare costs. The aim of this study was to estimate avoidable healthcare costs of CVD and T2D through adequate dairy foods consumption in Iran.
Methods: This was a multistage modelling study. We conducted a systematic literature review in PubMed and EMBASE to identify any association between incidence of CVD and T2DM and dairy foods intake, and also associated relative risks. We obtained age- and sex-specific dairy foods consumption level and healthcare expenditures from national surveys and studies. Patient level simulation Markov models were constructed to predict the disease incidence, patient population size and associated healthcare costs for current and optimal dairy foods consumption at different time horizons (1, 5, 10 and 20 years). All parameters including costs and transition probabilities were defined as statistical distributions in the models, and all analyses were conducted by accounting for first and second order uncertainty.
Results: The systematic review results indicated that dairy foods consumption was inversely associated with incidence of T2DM, coronary heart disease (CHD) and stroke. We estimated that the introduction of a diet containing 3 servings of dairy foods per day may produce a $0.43 saving in annual per capita healthcare costs in Iran in the first year due to saving in cost of CVD and T2DM treatment. The estimated savings in per capita healthcare costs were $8.42, $39.97 and $190.25 in 5, 10 and 20-years’ time, respectively. Corresponding total aggregated avoidable costs for the entire Iranian population within the study time horizons were $33.83, $661.31, $3,138.21 and $14,934.63 million, respectively.
Conclusion: Our analysis demonstrated that increasing dairy foods consumption to recommended levels would be associated with reductions in healthcare costs. Further randomized trial studies are required to investigate the effect of dairy foods intake on cost of CVD and T2DM in the population.
Keywords: Avoidable cost, Cardiovascular diseases, Dairy foods, Diabetes, Iran, Markov model
Cite this article as: Javanbakht M, Jamshidi AR, Baradaran HR, Mohammadi Z, Mashayekhi A, Shokraneh F, et al. Estimation and
prediction of avoidable health care costs of cardiovascular diseases and type 2 diabetes through adequate dairy food consumption: a systematic review and micro simulation modeling study. Arch Iran Med. 2018;21(5):213–222.
www.aimjournal.ir
http
IRANIAN
MEDICINE
Introduction
Healthcare costs have been growing rapidly over the last 3 decades in many countries including Iran, causing concern among governments, patients and insurance companies. Among the leading causes of mortality in
Iran are cardiovascular diseases (CVDs), diabetes and
cancer, which account for more than 70% of all deaths.1
These diseases also impose a great burden on the country’s economy in terms of healthcare costs and low
productivity.2–4 These diseases account for almost half of
total healthcare expenditure in all countries.5
Results from the Global Burden of Disease (GBD) study show that unhealthy or poor diet is the leading risk factor
for chronic diseases in many countries, including Iran.6
But so far, little attention has been given to the possible effects of dietary food intake modifications on the risk of developing one or more aforementioned chronic diseases and their related healthcare costs. Data published in the past 2 decades from randomized controlled trials (RCTs) and prospective studies suggest that dairy foods are among the main food groups that can be used to reduce
the burden of various medical conditions.7–16 Recent
studies have shown that the dietary approaches to stop hypertension (DASH), a dietary pattern which is high in fruit, vegetables, nuts, fish, and low-fat dairy foods, can reduce blood pressure effectively, which may in part be attributed to its relatively high content of low-fat dairy
foods.7,17,18 The mechanisms by which dairy foods affect
CVD incidence are diverse and include both positive and negative influences. Dairy foods are rich in protein (casein and whey), vitamins (riboflavin and vitamin B-12) and minerals (calcium, potassium, and magnesium) that
can have beneficial effects on CVD.19 Saturated fat in
dairy foods, on the other hand, can adversely influence coronary heart diseases (CHDs). In general, synthesis of the literature shows that dairy foods consumption may have protective effects on hypertension, CHD and stroke
incidence.14,16,20–25 Recent studies suggest that there is also
a significant inverse association between intakes of dairy
foods and type 2 diabetes mellitus (T2DM).10,11,26
Although dairy foods consumption, including milk, cheese, and yogurt, have been encouraged through the
food-based dietary guidelines in Iran,27 results from recent
studies show that most people in Iran do not consume enough dairy foods. Based on the updated dietary guideline recommended intakes of dairy, including for those following a vegetarian eating pattern, are 3 daily servings for Americans nine and older, 2.5 servings for children ages 4 through 8 and 2 servings for children ages 2 through 3 years old. The Mediterranean eating pattern
calls for only 2 servings of dairy for adults per day.28
Special emphasis is placed on consuming more fat-free and low-fat milk and milk products in particular. Results from dietary surveys show that on average, people in Iran are consuming about 0.7 servings of milk, 0.9 servings
of cheese and 1 servings of yogurt per day.8,29,30 Dairy
consumption decreases with age, and the gap between actual and recommended dairy consumption widens through adulthood with less than 1.5 dairy servings consumed by adults over the age of 50 years.
A reduction in the incidence of chronic diseases through adequate dairy consumption may improve population health and reduce healthcare costs. This
may be considered improbable in the short term given the complex effects of dietary risk factors on diseases incidence. But results from prospective cohort studies show a significant association between certain medical
conditions and dairy consumption.7–9,16 Moreover, results
from dose–response meta-analysis studies which provide vital information in judging the causal relationships when data from RCTs are sparse, suggest that the relationship between dairy consumption and T2DM and
CVD are undeniable.10,11,20 Up to now, efforts to increase
consumption of dairy foods at the population-level have received little support from policy-makers. Unavailable or insufficient estimates of the mortality and economic burden of diseases due to low intake of dairy foods can partly explain the lack of attention to the above mentioned efforts. To address this important knowledge gap, we aimed to use the most recent epidemiological and economic data to estimate avoidable CVD and T2DM healthcare costs through increased dairy foods consumption.
Methods
Study Design
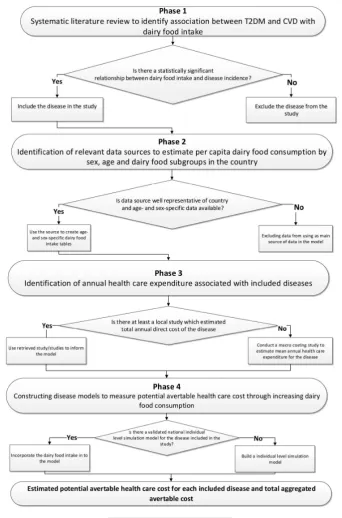
This is a modelling study and data from previous literature and national databases were used to present 2 disease models to estimate avoidable T2DM and CVD healthcare costs. First, a systematic literature review was conducted to identify any association between different levels of dairy foods consumption and incidence of CVD and T2DM, using dose response meta-analysis studies. Second, we obtained age- and sex-specific dairy foods consumption statistics from national studies. Third, healthcare expenditures associated with CVD and T2DM were obtained from national studies and health system registries. Finally, using all data from previous steps as well as other epidemiological data, a Markov model for each disease was constructed to estimate avoidable direct healthcare costs of CVD and T2DM through increased dairy consumption to optimum level (Figure 1). Below we have described details of the methods used in each step.
Step 1: Identification of Diseases Related to Dairy Consumption
opinion, literature review, and controlled vocabulary (Medical Subject Headings [MeSH] and Excerpta Medica Tree [EMTREE]). Search strategies developed by assistance of a medical information specialist. The review included secondary research (meta-analyses and pooled analyses) that investigated the relation between consumption of different types of dairy foods among adults and the elderly population and incidences of the included medical conditions. We excluded all non-human studies, narrative review articles, case reports, and editorials. Two methodologists selected the studies based on the study inclusion criteria. In case of disagreement, a third reviewer reconciled the decision to make the final
selection. We critically appraised the included studies using AMSTAR, a measurement tool to assess systematic reviews and meta-analysis studies. All included studies were summarized in narrative form and in summary tables that display the important features of the studies including: outcomes, sample sizes, and incidence summary measures (Table 1).
Step 2: Estimation of Per Capita Dairy Consumption by Sex, Age and Dairy Food Subgroups
[image:3.595.127.470.53.572.2]of Iran (SCI) for the last 2 decades. The SCI survey provides annual average dairy consumption. The dataset is nationally representative and presents the information on all different types of dairy foods including milk, cheese, butter, yogurt and other forms of dairy foods consumed in rural and urban households. Although the SCI food database provides detailed information on dairy consumption, it does not provide age- and sex-specific statistics on food consumption at the household-level. The second data source was a study conducted within the framework of the Tehran Lipid and Glucose Study (TLGS), a large prospective cohort study that used a
representative sample of the Iranian urban population.31
In the TLGS study, normal dietary intake was assessed using a 168-item food-frequency questionnaire (FFQ). The FFQ consists of a list of foods with a standard serving size. All participants in the study were asked to report the frequency of consumption of different types of foods during previous year on a daily, weekly and monthly basis. Dairy foods were classified into 3 groups including milk, yogurt and cheese according to the US Food Guide
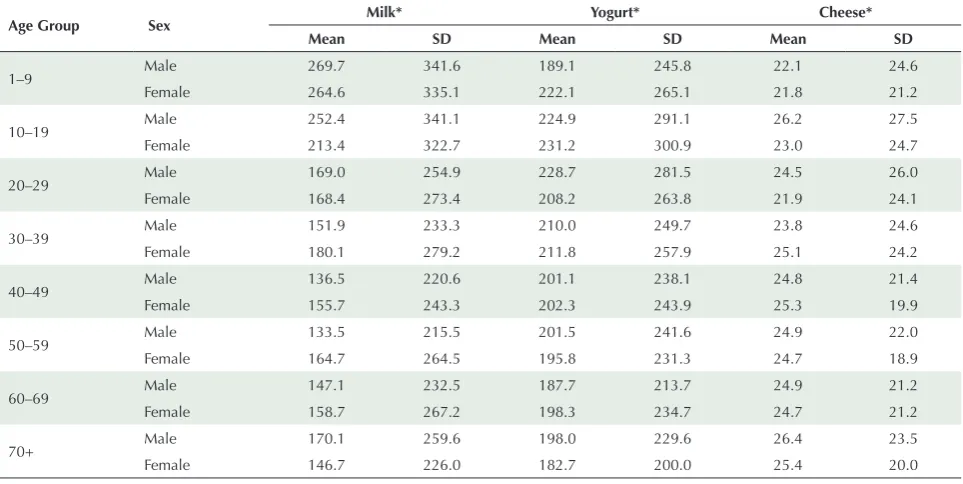
Pyramid. Since FFQ provides reasonably valid measures of dairy consumption compared to the questionnaire used in the SCI survey, and given that data from the SCI is provided at the household-level while data from TLGS provides age- and sex specific data, we used the second dataset to estimate average per capita dairy consumption. Since the selected dataset is only representative of the urban population (~70% of all population), we adjusted the mean per capita dairy consumption in urban areas using the relative consumption reported in the SCI survey to estimate mean consumption level for rural population. Average dairy food consumption by sex, age and food are presented in Table 2.
Step 3: Direct Healthcare Expenditure Associated With Included Diseases
We obtained direct healthcare expenditure associated with diseases included in this study from previous local studies and medical expenditure registries in Iran. To estimate annual cost of patients with T2DM, we used the most
[image:4.595.56.538.70.160.2]recent estimates by Javanbakht et al.4 They performed a
Table 1. Selected Studies That Reported a Significant Association Between Dairy Consumption and Incidence of T2DM and CVD Diseases
Outcome Studies Included in Each Meta-Analysis Unit of RR RR (95% CI) Source
CHD 7 For <1.5 servings/day 0·88 (0·80–0·96) 20
CHD 9 For 1.5–3 servings/day 0·93 (0·85–1·00) 20
CHD 5 For >3 servings/day 0·86 (0·79–0·94) 20
Stroke 15 For <1.5 servings/day 0·92 (0·89–0·96) 20
Stroke 10 For >1.5 servings/day 0·91 (0·88–0·95) 20
T2DM 13 Per 200 g/d 0.94 (0.91–0.97) 20
Abbreviations: RR, relative risk; CHD, coronary heart diseases; T2DM, type 2 diabetes mellitus; g/d, gram/day.
Table 2. Dairy Foods Intake Per Person (g/d)
Age Group Sex Milk* Yogurt* Cheese*
Mean SD Mean SD Mean SD
1–9 Male 269.7 341.6 189.1 245.8 22.1 24.6
Female 264.6 335.1 222.1 265.1 21.8 21.2
10–19 Male 252.4 341.1 224.9 291.1 26.2 27.5
Female 213.4 322.7 231.2 300.9 23.0 24.7
20–29 Male 169.0 254.9 228.7 281.5 24.5 26.0
Female 168.4 273.4 208.2 263.8 21.9 24.1
30–39 Male 151.9 233.3 210.0 249.7 23.8 24.6
Female 180.1 279.2 211.8 257.9 25.1 24.2
40–49 Male 136.5 220.6 201.1 238.1 24.8 21.4
Female 155.7 243.3 202.3 243.9 25.3 19.9
50–59 Male 133.5 215.5 201.5 241.6 24.9 22.0
Female 164.7 264.5 195.8 231.3 24.7 18.9
60–69 Male 147.1 232.5 187.7 213.7 24.9 21.2
Female 158.7 267.2 198.3 234.7 24.7 21.2
70+ Male 170.1 259.6 198.0 229.6 26.4 23.5
Female 146.7 226.0 182.7 200.0 25.4 20.0
[image:4.595.58.540.512.754.2]systematic literature review and Bayesian meta-analysis to estimate the cost of patients with T2DM in Iran. They concluded that in 2009, the mean annual direct cost of patients with T2DM was US$556 (posterior standard deviation [PSD]: 221).
To estimate the cost associated with CVD, a macro-costing approach was taken because no national study was found in our search. Firstly, we defined relevant specific disease conditions that are included under the umbrella term CVD based on the International Disease Classification (ICD-10). These codes were (I20- I25) for CHD, (I10-I15) for hypertension and (I60-I69) for stroke. Secondly, using hospital information system registries, 12 506 medical record files were extracted for patients who were admitted from March 2014 – September 2014 in 6 main hospitals in 4 different provinces of Iran (Tehran, Esfahan, Fars and Kurdistan, which account for 33% of the entire population in Iran). Thirdly, since our aim was to estimate the real cost of healthcare from public and private perspective, and given that all selected hospitals were in the public sector (90% of all hospital beds belong to public sector in Iran), we adjusted all hospital charges to reflect the real cost of care. Fourthly, we calculated mean cost of each episode of hospitalization for each health condition using hospital admissions registry. A total annual inpatient cost was estimated separately for CHD, stroke and hypertension. Finally, as we aimed to estimate annual direct health expenditure per patient, we used the ratio of inpatient cost to total direct cost to estimate total annual direct cost. Costs of other diseases included in the study were obtained from previous studies (Table S1, Supplementary Materials). After summarizing the estimated average cost of diseases, all costs were converted to US$ using an exchange rate (1$ equal to 32 000 Iranian Rial), and inflated to 2016 price
using consumer price index in Iran.32
Step 4: Modelling
After identifying the diseases that are significantly related to dairy consumption and estimating annual per capita cost, we built a Markov micro simulation (MM) model to predict the incidence of each disease at current and optimal levels of dairy consumption. The MM model is a computer modelling technique that simulates individual lives. The model uses person-level features including a unique identifier and a set of associated attributes such as age, sex, level of dairy consumption and disease condition. We applied a set of transition probabilities and costs inputs in the models. The models used all the defined parameters and transition probabilities over many time steps and simulated individuals through the model one at a time and generated individual life histories of a
simulated population.33,34
CVD Model
We constructed our CVD MM model with 7 health states named: Healthy, hypertension, post stroke, CHD, CVD-related death, net emigration and death from background mortality. Figure S1 ( see online Supplementary Materials ) shows the structure of the CVD MM model. CHD health state includes patients with myocardial infarction and angina. A Markov model is a stochastic model describing a sequence of possible events in which the probability of each event depends only on the state attained in the previous event. Individual populations were simulated to pass through the model one at a time where they may exit because of CVD-related or background death or net emigration. If a case develops CVD, the model tracks disease progression in a cohort based on the defined
transition probabilities.4 We obtained distribution of
Iranian population in different age groups from the
latest national census database.35 The most recent Iranian
life table was used to estimate age- and sex-specific
probability of death from background mortality.36 Age-
and sex-specific prevalence of CVD and hypertension were taken from national health surveys and used as the initial distribution of the simulated cohort in the Markov
states.37–40 We used recent data provided by the national
surveillance of risk factors of non-communicable diseases (SRFND) and other national studies to
obtain age- and sex-specific incidence of CVD.38,41 To
estimate CVD incidence in the second arm (optimal dairy consumption), we linked the incidence rates to consumption level of various dairy foods (Table S1, Supplementary Materials). Results from dose-response meta-analysis provided us with RR of CVD incidence for different levels of dairy consumption. We assumed that dairy consumption was protective if only they were taken up to their recommended levels.
When a CVD event happened, it was either fatal or non-fatal. We obtained age- and sex-specific probabilities of having a fatal CVD event from an Iranian population-based cohort study (population-population-based Isfahan Cohort Study (ICS)) which has reported fatal and nonfatal incidence rates of IHD and stroke in a cohort of population in Iran based on 32,893 person-years of
follow-up.41 We assumed that transitions across health
states occur annually. The relevant annual costs assigned to each health state were based on the findings from phase 3 of the study. As we aimed to estimate total avoidable healthcare cost, we simulated a representative cohort sample of entire Iranian male and female population from 2016. We estimated the expected avoidable cost using 1, 5, 10 and 20 years’ time-horizons.
CVD Model Validation
International Society for Pharmacoeconomics and
Outcomes Research (ISPOR) task force guideline.42 To
validate the structure of the CVD model, the models as well as input data and results were presented to an expert group of health professionals to determine face validity. The group was asked to evaluate the model structure and assumptions in comparison to real world circumstances. We conducted a wide series of sensitivity analyses to evaluate internal validity of the CVD model. We assigned some null and extreme values for input parameters such as zero unit cost or probabilities and ran simulations separately for each validation scenario to compare results with base case values and to test the robustness of the outputs.
T2DM Model
To estimate total avoidable healthcare cost associated with T2DM, we used the model which was already developed by the current study’s team. All details of the model
have been described elsewhere,4 in brief, the T2DM MM
model contained 6 health states: Healthy, undiagnosed diabetes, diagnosed diabetes, net migration, diabetes-related death and death from background mortality (Figure S2, Supplementary Materials). As per the CVD model, we linked the incidence of T2DM to dairy foods consumption data which were incorporated into the T2DM MM model to estimate avoidable healthcare cost.
Sensitivity Analysis
To explore parameter uncertainty in the model, we conducted probabilistic sensitivity analysis (PSA). To conduct PSA, we defined input parameters including costs and transition probabilities as statistical distributions in the model. Ranges and distributional assumptions for input parameters were based on the literature and nature of the parameters. We ran the base-case analysis as probabilistic with a generation of 1000 trials within each individual level simulation. In other words, the model repeated the simulation 1000 times for each individual. Each time, the analysis drew the model parameters from the pre-specified probability distributions. We assigned beta distribution for transition probabilities, gamma distribution for cost, and log-normal distribution for RRs (Table S1, Supplementary Materials). We used TreeAge Pro 2014 software to construct and run all the models and the simulations.
Results
There were 287 records from PubMed and 429 records from EMBASE. After removing 181 duplicates, 2 researchers screened 535 records based on title and abstract. 452 studies were excluded during screening,
because they were irrelevant to our research question. Eighty-four studies were selected for full text assessment using inclusion and exclusion criteria. Finally12
studies including 4 studies for diabetes.10,43–45 and 8
for CVD,20,22,46–51 were included and appraised using
AMSTAR tool. Process of selection of studies is shown in PRISMA flow diagram (Figure 2). Results from our systematic review indicated that T2DM, CHD and stroke were significantly associated with level of dairy foods consumption.
T2DM
After assessing all included studies for T2DM using the
AMSATR tool, a study conducted by Gao et al10 was used
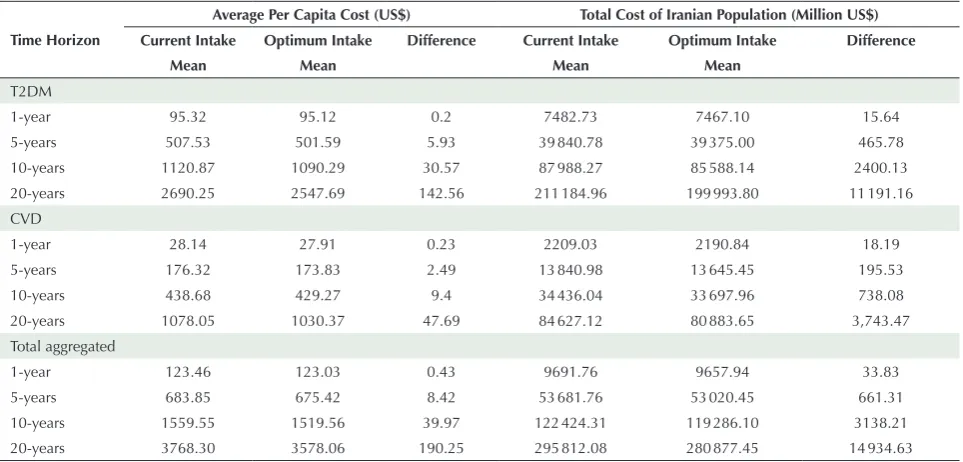
to inform the T2DM model. Results from the T2DM model revealed a per capita savings of $0.20, $5.93, $30.57 and $142.56 within 1, 5, 10 and 20 years’ time horizon, respectively, due to a reduction in T2DM incidence by increasing dairy foods consumption to its optimum level. Total avoidable costs for all Iranian populations within the modelling time horizons were estimated to be $15.64, $465.78, $2400.13 and $11191.16 million, respectively.
CVD
Among included studies regarding relationship between
CVD and dairy foods consumption, Alexander et al20
was selected based on the AMSATR tool to inform the CVD model. The results showed that average avoidable per capita healthcare costs were $0.23, $2.49, $9.40 and $47.69 in 1, 5, 10 and 20-years’ time horizon, respectively, and corresponding total estimated avoidable costs among entire Iranian population were $18.19, $195.53, $738.08 and $3743.47million, respectively.
Total Avoidable Costs
Including all avoidable costs from T2DM and CVD revealed that the introduction of a diet containing 3 servings of dairy foods/day may produce a $0.43 saving in annual per capita healthcare cost in Iran in the first year. The estimated savings in per capita health cost were $8.42, $39.97 and $190.25 in 5, 10 and 20-years’ time horizon, respectively. Corresponding total aggregated avoidable cost for entire Iranian population within the study time horizons were $33.83, $661.31, $3138.21 and $14934.63 million, respectively. A summary of the estimations for all diseases can be found in Table 3.
Discussion
Our analysis demonstrates significant reductions in healthcare cost that could be achieved by increasing consumption of dairy foods to the recommended
direct healthcare expenditure and burden of disease (disability-adjusted life years [DALY]) attributable to low consumption of dairy products in Australia. They found that in 2010–2011 financial year, AUD$2.0 billion
(USD$2.1 billion, €1.6 billion, or 1.7% of direct healthcare expenditure) and loss of 75,012 DALY were attributable
to low dairy products consumption. McCarron et al53
also undertook another study to estimate healthcare cost From: Moher D, Liberati A, Tetzlaff J, Altman DG, The PRISMA Group (2009). Preferred Reporting Items for Systematic Reviews and
Meta-Analyses: The PRISMA Statement. PLoS Med 6(7): e1000097. doi:10.1371/journal.pmed1000097
For more information, visitwww.prisma-statement.org.
Records identified through database searching
(n = 716 )
Sc
ree
ni
ng
In
clud
ed
Eligibilit
y
Id
enti
ficatio
n
Records after duplicates removed (n = 181 )
Records screened
(n = 535 ) and abstract screening) Records excluded (title (n = 452 )
Full-text articles assessed for eligibility
(n = 84 )
72 full-text articles excluded
Not reporting association between dairy products and including diseases, Editorials, letter to editors, Conference abstracts, review articles (n = 72 )
12 studies included in study and assessed with
AMSTAR tool 8 CVD and hypertension
4 T2DM
2 studies that were reported a significant association between dairy products consumption and
incidence of T2DM and CVD were selected to inform the
disease models
[image:7.595.57.539.525.756.2]Figure 2. PRISMA Flow Diagram.
Table 3. Avoidable CVD and T2DM Healthcare Cost Through Adequate Dairy Intake in Iran
Time Horizon
Average Per Capita Cost (US$) Total Cost of Iranian Population (Million US$)
Current Intake Optimum Intake Difference Current Intake Optimum Intake Difference
Mean Mean Mean Mean
T2DM
1-year 95.32 95.12 0.2 7482.73 7467.10 15.64
5-years 507.53 501.59 5.93 39840.78 39375.00 465.78
10-years 1120.87 1090.29 30.57 87988.27 85588.14 2400.13
20-years 2690.25 2547.69 142.56 211184.96 199993.80 11191.16
CVD
1-year 28.14 27.91 0.23 2209.03 2190.84 18.19
5-years 176.32 173.83 2.49 13840.98 13 645.45 195.53
10-years 438.68 429.27 9.4 34436.04 33 697.96 738.08
20-years 1078.05 1030.37 47.69 84627.12 80 883.65 3,743.47
Total aggregated
1-year 123.46 123.03 0.43 9691.76 9657.94 33.83
5-years 683.85 675.42 8.42 53 681.76 53 020.45 661.31
10-years 1559.55 1519.56 39.97 122 424.31 119 286.10 3138.21
20-years 3768.30 3578.06 190.25 295 812.08 280 877.45 14 934.63
savings associated with adequate dairy foods intake in the United States. The results revealed that if Americans increase their intake of dairy foods to the currently recommended 3 to 4 servings/d, the projected first year savings would be approximately $26 billion, and 5-year cumulative savings would be in excess of $200 billion.
Other studies have reported associations between dairy consumption and incidence of some risk factors
including hypertension12 and obesity,26,54 while we
included only T2DM and CVD in our modeling. We included only direct medical cost in our estimations even though there are other indirect costs and health benefits to dairy consumption. However, including them would have increased the estimated avoidable cost. The indirect costs are related to increased productivity from a healthier workforce. Sensitivity analysis revealed that the results are more sensitive to mean annual cost of diseases, diseases incidence rates and RR of diseases incidence for different levels of dairy foods intake.
Like with all studies, several limitations exist that should be considered when interpreting the results. Firstly, due to limited longitudinal data, we assumed that some of the parameters used in our models were fixed over time, including disease incidence and dairy foods consumption. However, as time passes in the models, the cohorts become older and are at greater risk of developing diseases. Moreover the base-case estimation was based on the PSA which means to estimate results we have accounted for any uncertainty in the parameters used in the models. Second, prediction of avoidable future healthcare costs is related to current rates of healthcare utilization and costs. In our model, we used the most recent estimates of per capita cost rates for modelled diseases. However, per capita healthcare cost and utilization may change over time, and future changes may influence the estimations. Third, although all included meta–analyses used analytical models that were harmonised based on similar exposures and similar outcome classifications, the data used in these studies were generated from observational studies. Therefore, the validity of these meta-analyses is not guaranteed and may be biased, particularly because they are based on nutritional epidemiological studies where information bias is a dominant concern. Fourth, to present our models we classified different types of dairy foods into 3 main groups (milk, yogurt and cheese). Due to insufficient data, splitting results into high- and low-fat dairy foods was not possible, and this could be a source of bias as quality of dairy foods might be different across different countries. In addition, we did not have the distribution of dairy consumption by age-sex in rural areas. We assumed that the distribution is the same as that of the urban areas. However there might be some differences between age and sex pattern of dairy
foods intake in the country. Given that rural population constitutes less than 30% of the population in Iran, and it is unlikely that the pattern is hugely different from the urban areas, therefore we believe this could have minimal effect on the estimated costs. Finally, as we have modelled each disease separately, it is not possible to account for competing risks. Competing risks occur when patients can experience one or more events or outcomes which ‘compete’ with the other outcomes of interest. For example CVD patients that die due to a fatal CVD event have no chance for T2DM incidence; therefore there is no potential for saving T2DM healthcare cost through increased dairy consumption for those cases, though we believe this would have a minor effect on our estimations. Despite these limitations, using a systematic approach to find the most appropriate evidence and using local cost and sex- and age-specific epidemiologic and dairy consumption data in our analysis has made our results more applicable to local health policy-makers. We believe this method is the most solid and straightforward approach to assess the cost consequences of reducing disease incidence through improved healthy diet which could be utilized to study similar research questions in other disease and risk factor areas.
In conclusion, 2 of the main questions that health policy-makers are faced with are how much health resources should be allocated to encourage the adoption of a healthier diet and also what are the societal costs of current deviations from the recommended diet. Estimation of attributable cost to suboptimal dietary intake can help health policy-makers to understand where effective interventions might yield good returns and which policies and programs are cost effective that should be considered when defining a comprehensive and optimal plan of care to control chronic diseases. Our findings strongly suggest that increasing dairy foods consumption to recommended levels would be associated with significant reductions in CVD and T2DM healthcare cost. Public health nutrition strategies should be directed to encourage people to consume more dairy foods. Also it should be mentioned that the analysis does not suggest that the entire Iranian population should consume the recommended levels of dairy foods; it simply provides an estimate of avoidable CVD and T2DM health care cost by increasing dairy consumption to the recommended levels.
Authors’ Contribution
Conceived and designed the experiments: MJ, ARJ and HRB; Performed the study: MJ, ARJ, HRB AM, FS, MRH, RYB, HS, SD and AT; Analyzed the data: MJ, AM and. HRB; All authors discussed the results and contributed to the final manuscript.
Conflict of Interest Disclosures
Ethical Statement
As this work consists of a review of previously published research no ethical approval was needed.
Funding
This research was supported by a grant from Rheumatology Research Center. No information used in preparation of this manuscript was owned by the sponsor.
Acknowledgements
The authors would like to thank kindly all advisors and colleagues, for their valuable technical support. We give our thanks to Ashkan Afshin, (University of Washington, USA), Fariba Kolahdooz (University of Alberta, Canada), Kamran Moradi (Tehran University of Medical Sciences, Iran), Mohammad Hossein Yarmohammadi and Mehdi Nasr (Isfahan University of Medical Sciences, Iran), and Bakhtiar Pirouzi (Sanandaj Hospital, Iran).
Supplementary Materials
Online Supplementary data contain Table S1 and Figures S1-S2.
References
1. Forouzanfar MH, Sepanlou SG, Shahraz S, Dicker D, Naghavi P, Pourmalek F, et al. Evaluating causes of death and morbidity in Iran, global burden of diseases, injuries, and risk factors study 2010. Arch Iran Med. 2014;17(5):304-20.
2. Daroudi R, Akbari Sari A, Nahvijou A, Kalaghchi B, Najafi M, Zendehdel K. The Economic Burden of Breast Cancer in Iran. Iran J Public Health. 2015;44(9):1225-33.
3. Javanbakht M, Baradaran HR, Mashayekhi A, Haghdoost AA, Khamseh ME, Kharazmi E, et al. Cost-of-illness analysis of type 2 diabetes mellitus in Iran. PLoS One. 2011;6(10):e26864. doi: 10.1371/journal.pone.0026864.
4. Javanbakht M, Mashayekhi A, Baradaran HR, Haghdoost A, Afshin A. Projection of Diabetes Population Size and Associated Economic Burden through 2030 in Iran: Evidence from Micro-Simulation Markov Model and Bayesian Meta-Analysis. PLoS One. 2015;10(7):e0132505. doi: 10.1371/journal. pone.0132505.
5. Bloom DE, Cafiero E, Jané – Llopis E, Abrahams – Gessel S, Bloom LR, Fathima S, et al. The global economic burden of noncommunicable diseases. Program on the Global Demography of Aging; 2012.
6. Global Burden of Disease: Country profiles: Iran. Institute for Health Metrics and Evaluation, University of Washington; 2015. Available from: http://www.healthdata.org/iran.
7. Azadbakht L, Fard NR, Karimi M, Baghaei MH, Surkan PJ, Rahimi M, et al. Effects of the Dietary Approaches to Stop Hypertension (DASH) eating plan on cardiovascular risks among type 2 diabetic patients: a randomized crossover clinical trial. Diabetes Care. 2011;34(1):55-7. doi: 10.2337/dc10-0676. 8. Azadbakht L, Mirmiran P, Esmaillzadeh A, Azizi F. Dairy
consumption is inversely associated with the prevalence of the metabolic syndrome in Tehranian adults. Am J Clin Nutr. 2005;82(3):523-30. doi: 10.1093/ajcn.82.3.523.
9. Appel LJ, Moore TJ, Obarzanek E, Vollmer WM, Svetkey LP, Sacks FM, et al. A clinical trial of the effects of dietary patterns on blood pressure. DASH Collaborative Research Group. N Engl J Med. 1997;336(16):1117-24. doi: 10.1056/ nejm199704173361601.
10. Gao D, Ning N, Wang C, Wang Y, Li Q, Meng Z, et al. Dairy products consumption and risk of type 2 diabetes: systematic review and dose-response meta-analysis. PLoS One. 2013;8(9):e73965. doi: 10.1371/journal.pone.0073965. 11. Aune D, Norat T, Romundstad P, Vatten LJ. Dairy products
and the risk of type 2 diabetes: a systematic review and dose-response meta-analysis of cohort studies. Am J Clin Nutr. 2013;98(4):1066-83. doi: 10.3945/ajcn.113.059030. 12. Soedamah-Muthu SS, Verberne LD, Ding EL, Engberink
MF, Geleijnse JM. Dairy consumption and incidence of hypertension: a dose-response meta-analysis of prospective cohort studies. Hypertension. 2012;60(5):1131-7. doi: 10.1161/ hypertensionaha.112.195206.
13. Aune D, Lau R, Chan DS, Vieira R, Greenwood DC, Kampman E, et al. Dairy products and colorectal cancer risk: a systematic review and meta-analysis of cohort studies. Ann Oncol. 2012;23(1):37-45. doi: 10.1093/annonc/mdr269.
14. Soedamah-Muthu SS, Ding EL, Al-Delaimy WK, Hu FB, Engberink MF, Willett WC, et al. Milk and dairy consumption and incidence of cardiovascular diseases and all-cause mortality: dose-response meta-analysis of prospective cohort studies. Am J Clin Nutr. 2011;93(1):158-71. doi: 10.3945/ ajcn.2010.29866.
15. Dong JY, Zhang L, He K, Qin LQ. Dairy consumption and risk of breast cancer: a meta-analysis of prospective cohort studies. Breast Cancer Res Treat. 2011;127(1):23-31. doi: 10.1007/ s10549-011-1467-5.
16. Alonso A, Steffen LM, Folsom AR. Dairy intake and changes in blood pressure over 9 years: the ARIC study. Eur J Clin Nutr. 2009;63(10):1272-5. doi: 10.1038/ejcn.2009.50.
17. Wang L, Manson JE, Buring JE, Lee IM, Sesso HD. Dietary intake of dairy products, calcium, and vitamin D and the risk of hypertension in middle-aged and older women. Hypertension. 2008;51(4):1073-9. doi: 10.1161/hypertensionaha.107.107821. 18. Sacks FM, Svetkey LP, Vollmer WM, Appel LJ, Bray GA, Harsha
D, et al. Effects on blood pressure of reduced dietary sodium and the Dietary Approaches to Stop Hypertension (DASH) diet. DASH-Sodium Collaborative Research Group. N Engl J Med. 2001;344(1):3-10. doi: 10.1056/nejm200101043440101. 19. Miller GD, Jarvis JK, McBean LD. Handbook of Dairy Foods and
Nutrition. CRC Press; 2006.
20. Alexander DD, Bylsma LC, Vargas AJ, Cohen SS, Doucette A, Mohamed M, et al. Dairy consumption and CVD: a systematic review and meta-analysis. Br J Nutr. 2016;115(4):737-50. doi: 10.1017/s0007114515005000.
21. Hu D, Huang J, Wang Y, Zhang D, Qu Y. Dairy foods and risk of stroke: a meta-analysis of prospective cohort studies. Nutr Metab Cardiovasc Dis. 2014;24(5):460-9. doi: 10.1016/j. numecd.2013.12.006.
22. Soedamah-Muthu SS, Verberne LD, Ding EL, Engberink MF, Geleijnse JM. Dairy consumption and incidence of hypertension: a dose-response meta-analysis of prospective cohort studies. Hypertension. 2012;60(5):1131-7. doi: 10.1161/ hypertensionaha.112.195206.
23. McGrane MM, Essery E, Obbagy J, Lyon J, Macneil P, Spahn J, et al. Dairy Consumption, Blood Pressure, and Risk of Hypertension: An Evidence-Based Review of Recent Literature. Curr Cardiovasc Risk Rep. 2011;5(4):287-98. doi: 10.1007/ s12170-011-0181-5.
24. Gibson RA, Makrides M, Smithers LG, Voevodin M, Sinclair AJ. The effect of dairy foods on CHD: a systematic review of prospective cohort studies. Br J Nutr. 2009;102(9):1267-75. doi: 10.1017/s0007114509371664.
25. Alonso A, Beunza JJ, Delgado-Rodriguez M, Martinez JA, Martinez-Gonzalez MA. Low-fat dairy consumption and reduced risk of hypertension: the Seguimiento Universidad de Navarra (SUN) cohort. Am J Clin Nutr. 2005;82(5):972-9. doi: 10.1093/ajcn/82.5.972.
26. Kratz M, Baars T, Guyenet S. The relationship between high-fat dairy consumption and obesity, cardiovascular, and metabolic disease. Eur J Nutr. 2013;52(1):1-24. doi: 10.1007/s00394-012-0418-1.
27. FAO. Food – based dietary guidelines – Iran 2015. Available from: http://www.fao.org/nutrition/education/food-based-dietary-guidelines/regions/countries/iran/en/.
28. Committee DGA. Dietary Guidelines for Americans 2015-2020. Government Printing Office; 2015.
Ghaffarpur M, Ghodsi D, Kalantari N. Socio-economic Differences in Dietary Intakes: The Comprehensive Study on Household Food Consumption Patterns and Nutritional Status of I.R. Iran. Nutr Food Sci Res. 2014;1(1):19-26.
30. Mirmiran P, Hosseini-Esfahanil F, Jessri M, Mahan LK, Shiva N, Azizis F. Does dietary intake by Tehranian adults align with the 2005 dietary guidelines for Americans? Observations from the Tehran lipid and glucose study. J Health Popul Nutr. 2011;29(1):39-52.
31. Azizi F, Madjid M, Rahmani M, Emami H, Mirmiran P, Hadjipour R. Tehran Lipid and Glucose Study (TLGS): rationale and design. Iran J Endocrinol Metab. 2000;2(2):77-86.
32. Iran CBo. Iran: Central Bank of Iran; 2015. Available fromhttp: // www.cbi.ir/category/1611.aspx.
33. Rutter CM, Zaslavsky AM, Feuer EJ. Dynamic microsimulation models for health outcomes: a review. Med Decis Making. 2011;31(1):10-8. doi: 10.1177/0272989x10369005. 34. Briggs A, Sculpher M, Claxton K. Decision Modelling for Health
Economic Evaluation. Oxford University Press; 2006.
35. Implementation of the 2011 Iranian Population and Housing Census in Autumn. Statistical Centre of Iran; 2011. Available from: https://www.amar.org.ir/english/Population-and-Housing-Censuses.
36. Life tables by country Iran (Islamic Republic of). World Health Organization; 2013. Available from: http://apps.who.int/gho/ data/?theme=main&vid=60760.
37. Hadaegh F, Harati H, Ghanbarian A, Azizi F. Prevalence of coronary heart disease among Tehran adults: Tehran Lipid and Glucose Study. East Mediterr Health J. 2009;15(1):157-66. 38. Esteghamati A, Meysamie A, Khalilzadeh O, Rashidi A,
Haghazali M, Asgari F, et al. Third national Surveillance of Risk Factors of Non-Communicable Diseases (SuRFNCD-2007) in Iran: methods and results on prevalence of diabetes, hypertension, obesity, central obesity, and dyslipidemia. BMC Public Health. 2009;9:167. doi: 10.1186/1471-2458-9-167. 39. Khalili D, Sheikholeslami FH, Bakhtiyari M, Azizi F, Momenan
AA, Hadaegh F. The incidence of coronary heart disease and the population attributable fraction of its risk factors in Tehran: a 10-year population-based cohort study. PLoS One. 2014;9(8):e105804. doi: 10.1371/journal.pone.0105804. 40. Esteghamati A, Abbasi M, Alikhani S, Gouya MM, Delavari A,
Shishehbor MH, et al. Prevalence, awareness, treatment, and risk factors associated with hypertension in the Iranian population: the national survey of risk factors for noncommunicable diseases of Iran. Am J Hypertens. 2008;21(6):620-6. doi: 10.1038/ajh.2008.154.
41. Talaei M, Sarrafzadegan N, Sadeghi M, Oveisgharan S, Marshall T, Thomas GN, et al. Incidence of cardiovascular diseases in an Iranian population: the Isfahan Cohort Study. Arch Iran Med. 2013;16(3):138-44. doi: 013163/aim.004.
42. Weinstein MC, O’Brien B, Hornberger J, Jackson J, Johannesson M, McCabe C, et al. Principles of good practice for decision analytic modeling in health-care evaluation: report of the ISPOR Task Force on Good Research Practices--Modeling Studies. Value Health. 2003;6(1):9-17.
43. Chen M, Sun Q, Giovannucci E, Mozaffarian D, Manson JE, Willett WC, et al. Dairy consumption and risk of type 2
diabetes: 3 cohorts of US adults and an updated meta-analysis. BMC Med. 2014;12:215. doi: 10.1186/s12916-014-0215-1. 44. Aune D, Norat T, Romundstad P, Vatten LJ. Dairy products
and the risk of type 2 diabetes: a systematic review and dose-response meta-analysis of cohort studies. Am J Clin Nutr. 2013;98(4):1066-83. doi: 10.3945/ajcn.113.059030. 45. Tong X, Dong JY, Wu ZW, Li W, Qin LQ. Dairy consumption
and risk of type 2 diabetes mellitus: a meta-analysis of cohort studies. Eur J Clin Nutr. 2011;65(9):1027-31. doi: 10.1038/ ejcn.2011.62.
46. Yakoob MY, Shi P, Hu FB, Campos H, Rexrode KM, Orav EJ, et al. Circulating biomarkers of dairy fat and risk of incident stroke in U.S. men and women in 2 large prospective cohorts. Am J Clin Nutr. 2014;100(6):1437-47. doi: 10.3945/ajcn.114.083097. 47. Elwood PC, Givens DI, Beswick AD, Fehily AM, Pickering
JE, Gallacher J. The survival advantage of milk and dairy consumption: an overview of evidence from cohort studies of vascular diseases, diabetes and cancer. J Am Coll Nutr. 2008;27(6):723s-34s.
48. Qin LQ, Xu JY, Han SF, Zhang ZL, Zhao YY, Szeto IM. Dairy consumption and risk of cardiovascular disease: an updated meta-analysis of prospective cohort studies. Asia Pac J Clin Nutr. 2015;24(1):90-100. doi: 10.6133/apjcn.2015.24.1.09. 49. Hu D, Huang J, Wang Y, Zhang D, Qu Y. Dairy foods and risk
of stroke: a meta-analysis of prospective cohort studies. Nutr Metab Cardiovasc Dis. 2014;24(5):460-9. doi: 10.1016/j. numecd.2013.12.006.
50. Soedamah-Muthu SS, Ding EL, Al-Delaimy WK, Hu FB, Engberink MF, Willett WC, et al. Milk and dairy consumption and incidence of cardiovascular diseases and all-cause mortality: dose-response meta-analysis of prospective cohort studies. Am J Clin Nutr. 2011;93(1):158-71. doi: 10.3945/ ajcn.2010.29866.
51. Elwood PC, Pickering JE, Hughes J, Fehily AM, Ness AR. Milk drinking, ischaemic heart disease and ischaemic stroke II. Evidence from cohort studies. Eur J Clin Nutr. 2004;58(5):718-24. doi: 10.1038/sj.ejcn.1601869.
52. Doidge JC, Segal L, Gospodarevskaya E. Attributable risk analysis reveals potential healthcare savings from increased consumption of dairy products. J Nutr. 2012;142(9):1772-80. doi: 10.3945/jn.111.154161.
53. McCarron DA, Heaney RP. Estimated healthcare savings associated with adequate dairy food intake. Am J Hypertens. 2004;17(1):88-97.
54. Dror DK. Dairy consumption and pre-school, school-age and adolescent obesity in developed countries: a systematic review and meta-analysis. Obes Rev. 2014;15(6):516-27. doi: 10.1111/ obr.12158.
55. Fact sheet of Iran STEPS Survey 2009 Tehran, Iran. Iran Minstry of Health; 2009. Available from: http://www.ncdinfobase.ir/ english/docs.asp.
56. Sadeghi M, Ruhafza H, Shirani S, Akhavan Tabib A, Aghdak P, Hosseini S. The prevalence of coronary artery disease according to Rose questionnaire and ECG: Isfahan Healthy Heart Program (IHHP). ARYA Journal. 2006;2(2):70-74. doi: 10.22122/arya. v2i2.149.