Brain Activity and Mental Workload
associated with Artistic Practice
Abstract
We present the first stage of our on-going artist-driven BCI collaboration, where we equipped an artist with the brain scanning technique functional Near Infrared Spectroscopy (fNIRS) in order to record mental
workload levels during her creative practice. The artists are interested in exposing the hidden cognitive
processes involved in their creative practice, in order to reuse or integrate the data into their performances. The researchers are interested in collecting unstructured ‘in the wild’ fNIRS data, and to see how the artists
interpret the data retrospectively. We highlight some interesting early examples from the data and describe our on-going plans. We will have completed a second data collection before the workshop.
Author Keywords
Artistic BCI; fNIRS; Mental Workload; Making.
ACM Classification Keywords
H.5.m. Information interfaces and presentation (e.g., HCI): Miscellaneous.
Introduction
In this paper, we present the first stage of collaboration between HCI researchers from the University of
Nottingham and artists from Primary Studios, an artist-led space that exists to support creative research. We equipped an artist with the brain scanning technique functional Near Infrared Spectroscopy (fNIRS) in order to record mental workload (MWL) levels during her creative practice.
Accepted to the CHI2018 Artistic BCI Workshop Horia A. Maior
School of Computer Science, University of Nottingham, UK [email protected]
Max L. Wilson
School of Computer Science University of Nottingham, UK [email protected]
Caroline Locke School of Art,
University of Derby, UK [email protected]
Debra Swann
The Artistic Motivation
Caroline Locke is an artist that has been working with data in connection to her Contemporary Fine Art practice for many years. She uses data often in connection to moving and live elements in her
performances and immersive installations. Caroline’s
artistic practice has always involved mechanisms and devices, old and new technologies and her research questions the notion that living in a mechanical and technical world we lose contact with our identity as humans and that somehow machines alienate us from a sense of how and what we are. Through her artistic practice she tries to demonstrate the way in which machines and new technologies can actually allow us to amplify our self-awareness and allow us to become more connected to our physicality.
Debra Swann is an artist who makes sculpture, photography video and performance. Her research explores the artistic process through the making of objects. She is interested in how objects perform and the properties and qualities they possess. Swann explores the relationship between the maker and the object, with a focus on the evolution of the object and the durational aspects of making. The idea of the sculptural work in flux is investigated through durational live performances and events.
Together Debra Swann and Caroline Locke have been collecting data. Their collaborative process is an investigation that explores the idea of repeated and intensive labour in relation to artistic and domestic process. The work features cyclical movement, made and found objects, sound, video, animation and live performance. “We are interested in revealing the hidden internalised aspects of both of our artistic practices. We are experimenting with pre-recorded
brain data - working with a programmer to explore different ways in which we can use the data to control the speed of the motor which activates one of
Caroline’s mechanical sculptures. In performances, the idea that live measurements of our cognitive activity involved could be made visible is exciting. Data is used as an input for visualisations projected around the performance space. This kind of data reveals something about the maker, how an exhibited work was created as well as giving a sense of the artists physical functions to a participating audience – perhaps even, allowing them to reflect on their own physicality.” The HCI Motivation
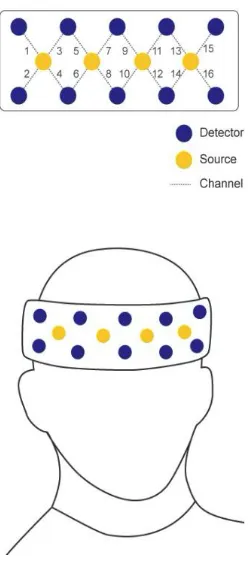
Our interest as HCI researchers is in using physiological and brain activity signals to capture the amount of MWL users experience whilst completing various tasks or interacting with various interfaces. Our research started within laboratory settings, where we sought to identify a technique (fNIRS - see Figure 1) that was highly tolerant of normal human behaviour, and could be used freely in HCI [1,2]. However, our long-term aim was always to move towards uncontrolled settings. We are interested in whether data can usefully recorded in more naturalistic scenarios, such that it will also not restrict users from performing their normal activities. This collaboration presented an opportunity to move from controlled work tasks, to unstructured and creative work tasks.
[image:2.792.51.175.160.443.2]Moreover, capturing MWL information and giving it back to users as feedback has proved to be useful and interesting process not only for researchers, but also for the users [3]. This collaboration presents an opportunity to see both a) what people interpret is happening when they see live MWL data in a Figure 1: Sensor layout for the
performance, and b) what the artists understand retrospectively from feedback about their MWL.
First Data Collection
As a first step in our collaboration, we setup a 3m by 3m space within the Mixed Realty Lab, and the artists brought materials and tools used in their creative practice to work there for a day. The artists brought cameras to document the step in their work. At the time, we had an fNIRS300 device and used the associated Cognitive Optical Brain Imaging (COBI) Studio hardware integrated software platform provided by Biopac Systems Inc for analysis. The headband shaped device is a sixteen-channel transducer for continuous Near Infrared Spectroscopy, at 2Hz.
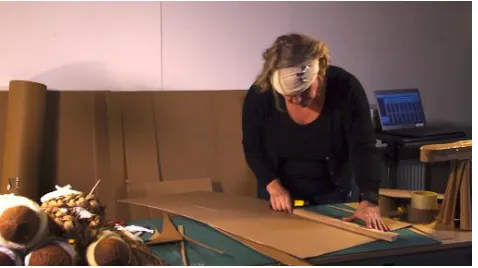
The two artists that took part in this project had different roles during the session. There was a
performing artist – Debra Swann – a sculptor that was equipped with sensors and was performing her creative practice, and a data artist – Caroline Locke - who was coordinating and documenting the performance.
Having just a table and cutting tools, and being surrounded with making materials such as cardboard and tape, the performing artist was given a particular artistic activity by the data artist. As a sculptor, the performing artist proceeded to score, cut, fit together and fasten various pieces to create the object chosen by the data artist, as shown in Figure 2. Some of these were decided at the time by the data artist, while others were planned by both artists in advance.
As researchers, we treated the data collection carefully, adopting performance-led research methodologies [4]. Although this first stage of collaboration was not a scientifically controlled user study involving many participants, and in fact the participants were known
collaborators, we still sought ethical approval to collect and examine their data, which was given by the School of Computer Science Ethics Board. Therefore, the artists started by giving informed consent before we began recording data about their artistic practice.
Comparative Data Points
In such uncontrolled settings, we were trying to understand the cognitive effort associated with various artistic activities. Therefore, we made use of various research instruments in order to understand a little bit more about the way the performing artist processes information, and the type of task they were completing.
We asked the performing artist to complete a VARK questionnaire to provide context to how the task related to their working styles and strengths (see Table 1). Perhaps as would be expected from a practicing sculptor, her results weighted towards visual, aural, and kinaesthetic modes of learning.
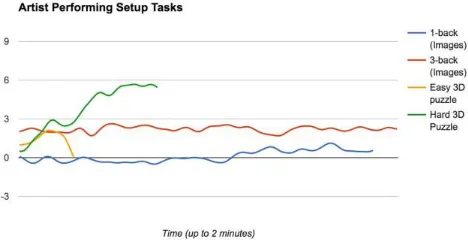
We additionally took five data points to support interpretation of the data (Figure 3): a resting baseline state, visual icon-based (as opposed verbal) 1-back and
VARK Score
Visual 7
Aural 8
Read/Write 3
[image:3.792.473.712.116.250.2]Kinesthetic 7
Table 1: VARK questionnaire scores
3-back measurements, and two 3D puzzle measurements. N-back tests are used regularly in experimental conditions to invoke different levels of MWL. We used the 3D puzzle, which involves combining Tetris-shaped pieces into a 3x3x3 cube, as a control point, as the artistic work involved 3D spatial rotation. Interestingly, on the first try the artist was able to quickly reconstruct the 3D puzzle by closely observing how it fell apart on the table. This was visibly short, as shown in Figure 3, and we labelled it easy. We asked the artist to repeat the process, after separating the pieces more vigorously, and labelled it as hard.
Main Performance Data
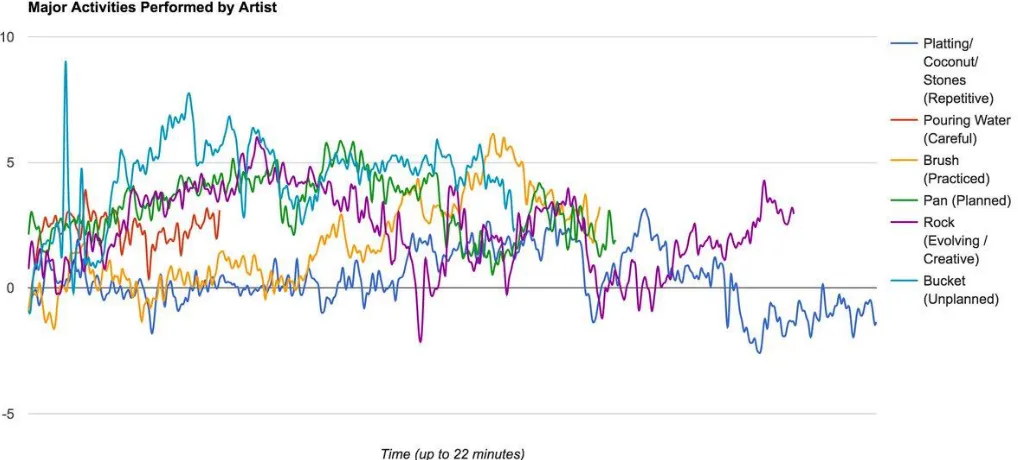
The performance period involved activities that were familiar and relaxed, familiar but took concentration, familiar but continuously creative, previously planned but newly creative, and unplanned and spontaneously creative. Loosely the main results, means of the most salient sensors over time, are ordered in Figure 4 from what we would hypothesise involves the least through to the most amount of MWL:
• Platting / Coconut / Stones (repetitively) • Pouring water between pots (careful) • Creating a brush (practiced before) • Creating a Pan (planned)
• Creating a rock (Evolving/Creating) • Creating a bucket (unplanned)
With the exception of the Pouring Water task, we were excited to see the graphed data largely relate to what we were hoping to see. The coconut/platting tasks, and practiced construction of the brush, typically produced the lowest levels of MWL and were largely in line with the 1-back test. Interestingly, the concentration involved in the water pouring task led to higher levels of MWL than the 3D construction of the brush. The Pan
[image:4.792.478.712.150.272.2]and Rock sculptures both involved creating new forms for the first time and involved similar levels of MWL.
Figure 3: comparative data points
The bucket task was given to the performing artist as a surprise, and we see the highest levels of MWL in the first 5 minutes. An interesting observation for the researchers during the process, whilst watching the incoming data, was what caused notable artefacts in the signal. The most obvious artefacts came from reaching across the table. While the work involved a mixture of being relatively still, when cutting, and a lot of arm movement, when constructing, the larger patterns in the graphs made sense to both the researchers and the artists.
Artists Reflection
The artists reflect on this experiment as a unique opportunity to gather insight into each of their respective practices. For Caroline, who is particularly interested in body rhythms and soundwaves it was
fascinating to actually witness the ‘flow of the rhythms of the brain’ in a live setting. “During the lab
felt like a very new and refreshing kind of critique. It was fascinating to see how making different objects under different instructions significantly changed the brain data. With some instructions the data revealed a low level of brain activity and related to a more meditative state revealing a certain confidence in the action of the maker. Other experiments show levels of anxiety or creative problem solving hard at work in the brain. We saw Spikes in the data when
making unfamiliar objects. We were aware of our surprise when Debra was able on her first try to quickly reconstruct the 3D puzzle by closely observing how it
fell apart on the table. On reflection it is interesting that, as artists we take for granted our visual awareness - our ability to look very closely and
understand certain processes. Our brains have become
conditioned to creative and visual problem solving”.
[image:5.792.205.714.138.368.2]hot spots activated by the data was particularly insightful. It presented the data so that we could easily relate to it as brain activity. We will be aiming to use these types of visualisation techniques when we come to develop the work for gallery presentations. It will be interesting to gather feedback from audiences watching similar visualisations in connection with the activities
they witness us perform live.“
Ongoing and Future Work
We learned several things during the first data collection, which will guide our next data collection in mid-February. Sadly, although we have lots of
documentary-style footage, we lost the comprehensive video recording taken by our GoPro, when it ran out of battery before saving. However, this highlighted the importance of the triangulation points across our data samples. In trying to analyse the data, we identified the kinds of correlation points we will identify next time. We expect that the larger variations in the data shown around 10 minutes into Figure 4, relate to the conversations that naturally occurred, after a while, during the artistic practice. We will take a more
comprehensive approach to annotating observations for subsequent analysis.
Ultimately, our first data collection was limited by the 2 metre cables connecting the headband to the signal processing box. This limited the artist both spatially and temporally; ultimately our data collection ended when the performing artist needed a comfort break. Our newer fNIRS device – an Artinis Octomon – is fully Bluetooth, and will instead be limited by battery life, but this is exchangeable. For our second data collection event, we have better planned for breaks, data saving, and battery changes.
In terms of their work, the artists are looking to more closely associate the data collection with their planned exhibitions, so that it can be data that can be used to augment both exhibitions and performances. This involves making the next data collection even more realistic and natural. Currently, they are working with the programmer Noel Murphy, who is embedding the data samples into microcontrollers for vibration motors, which are being used to add both a visual and auditory sense of high workload, as artefacts are activated according to the changing data.
Acknowledgements
This work was supported by the Engineering and Physical Sciences Research Council [grant numbers EP/G037574/1, EP/M000877/1, EP/N50970X/1].
References
1. Solovey, E. T., Girouard, A., Chauncey, K., Hirshfield, L. M., Sassaroli, A., Zheng, F., and Jacob, R. J. 2009. Using fNIRS brain sensing in realistic HCI settings: experiments and guidelines. In Proc. UIST’09. 157-166. ACM.
2. Maior, H. A., Pike, M., Sharples, S., & Wilson, M. L. 2015. Examining the reliability of using fNIRS in realistic HCI settings for spatial and verbal tasks. In Proc. CHI’15. 3039-3042. ACM.
3. Maior, H. A., Wilson, M. L. & Sharples, S. 2018. Workload Alerts - Using Physiological Measures of Mental Workload to Provide Feedback during Tasks. ACM Transactions on Computer-Human Interaction (TOCHI),30pages, (in press). 4. Benford, S., Greenhalgh, C., Crabtree, A.,
Flintham, M., Walker, B., Marshall, J., &