A Modeling Framework for the Planning of Strategic
Supply Chain Viewed from Complex Network
Jiangbo Zheng
School of management, Jinan University, Guangzhou, China. E-mail: [email protected]
Received February 18th, 2009; revised April 1st, 2009; accepted May 4th, 2009.
ABSTRACT
Based on the theory of complex network, this paper focuses on the planning of logistics nodes for strategic supply chain. I propose a practical mathematical modeling framework that simultaneously captures many practical aspects but still understated in the existing literatures of network planning problems. Moreover, capacity expansion and reduction sce-narios are also analyzed as well as modular capacity shifts for the fluctuation of demands. So this paper is of impor-tance for the research of network planning in strategic supply chain systems.
Keywords:strategic supply chain, logistics nodes, complex network
1. Introduction
With the increasingly competitive situation, enterprises have to face the changes of their internal operation mode and external supply chain mode for higher efficiency and lower operational costs. Different from traditional supply chains, a strategic supply chain emphasizes on the opti-mization of all resources and the coordinate development of the allies based on their core competences. What’s more, a strategic supply chain is also different from the integrated supply chain, which mainly emphasizes on the overall control of the upstream and downstream of the supply chain and unilaterally pursues the stability of the chain. Therefore, strategic supply chain is a neutral competitive mode which focuses on the integration of allies’ core competences and is of such great features as coordination, agility and difference. Under strategic sup-ply chain mode, the coordination among the allies is more intimate and more dynamic. So the whole supply chain is of much more complexity and perhaps the tradi-tional theories and methods can not give the further sup-port for some relative research.
Complex network is a theory attempted to describe the properties of an actual or virtual network and to establish a model (for instance, mathematical model) to mirror those properties. Based on this theory and from the view of logistics nodes planning of a strategic supply chain, this paper proposes a mathematical modeling framework that captures many practical aspects of network design problems which have not been received adequate atten-tion in the relative literatures. Such aspects considered
include: dynamic planning horizon, generic supply chain network structure, external supply of materials, inventory opportunities for goods, distribution of commodities, facility configuration, availability of capital for invest-ments, and storage limitations. Therefore, the research of this paper may provide some references for the mecha-nism of a strategic supply chain.
2. The Significance for Strategic Supply
Chain Design Applying Complex
Network Theory
connection between people to the understanding of the function of human society [1]. From then on, typical relevant researches address issues of centrality (which individuals are best connected to others or have most influence) and connectivity (whether and how individu-als are connected to one another through the network). Recent years there have been a new change with the re-search focus shifting from the analysis of single small system and the property of individual nodes or edges within such systems to consideration of large-scaled (maybe millions or eve more of nodes and edges) statis-tics properties of systems. Recent work in this area is inspired particularly by a groundbreaking paper by Watts and Strogatz [2]. This new approach has been driven largely by the availability of computers and communica-tion networks that allow us to gather and analyze data on a scale further larger than previously possible. This change of scale forces us a corresponding change in our analytic approach – strategic supply chain network is the case in point. For example, traditional research works about supply chain network of tens or hundreds nodes, it is relatively straightforward matter to draw a picture of the network with actual points and lines, and to give spe-cific analysis (the human eye is also an analytic tool) about it through examining this picture. But this ap-proach is not useful with a complex network of thou-sands or even more nodes – that is very common now for some modern multi-national companies’ supply chain networks.
Furthermore, the theoretical body of complex network is established to do primary three aspects: 1) to find and highlight statistical properties, such as path lengths and degree distributions, which characterize the structure and behavior of a network, and to suggest appropriate ways to measure these properties; 2) to create models of net-works that can help us to understand the meaning of these properties such as how they came to be as they are and how they interact with one another; 3) to predict what the behavior of networks system will be on the ba-sis of measured structural properties and the local rules governing individual nodes. In fact, the scientific field has made an excellent start on the first two of these aims by drawing on ideas from a broad variety of disciplines. But such achievements are not well introduced in the research field of supply chain systems; especially the item (2) is understated in the planning of strategic supply chain network. Therefore, this paper attempts to apply complex networks theory to establish a modeling framework to better describe and interpret the systems of strategic supply chain.
3. Literatures Review and Properties
Description of a Strategic Supply Chain
Research works on optimization of the supply chain through efficient planning decisions have been processed
for many years such as Erlenkotter D. [3], Fong CO. and Srinivasan V. [4,5], Jacobsen SK [6], Sweeney DJ and Tatham RL [7] and in the strategic planning level, typical decisions concern the location of manufacturing and/or warehousing logistics nodes [8,9,10]. Moreover, recent years many research works have addressed the dynamic location problem such as: Daskin et al. [11] propose an extensive review of location problems, Beamon [12] distinguishes models with deterministic data from those with stochastic data, Owen and Daskin [13] clearly separate the static and dynamic models. Cordeau et al. [14] propose a static model considering a multi-commo- dity, multi-facility and single-country network. The de-cision variables concern the number of locations, the capacity and technology of manufacturing in plants and warehouses, selection of suppliers, selection of distribu-tion channels, transportadistribu-tion modes and material flows. Hamer-Lavoie and Cordeau [15] simplify this model by removing the suppliers and the bills of materials. They suppose that the location has already been chosen for plants and the model focuses on warehouse location. The model is dynamic with stochastic demands, and takes inventories into account, including the safety stock. Dias et al. [16] work on the re-engineering of a two-echelon network (facilities and customers). The authors suppose that facilities can be opened, closed and reopened more than once during the planning horizon. They study these conditions within three scenarios: with maximum capac-ity restrictions; with both maximum and minimum ca-pacity restrictions; and with a maximum caca-pacity that decreases. With the same flexibility idea, Melo et al. [17] aim at relocating the network with expansion/reduction capacity scenarios. Despite of so many important re-searching works, some important real world issues have not received adequate attention. These include the exter-nal supply of products, inventory opportunities for prod-ucts, storage limitations, availability of capital for in-vestments, and relocation, expansion or reduction of nodes’ capacities. Even though some of these issues have been researched individually in the literature, it is ig-nored that the structure of a network is strongly affected by the simultaneous consideration of these and other practical needs. One observes a lack of reasonably sim-ple, yet comprehensive, models which can illustrate the effect of such factors on network configuration deci-sions.
Figure 1. A network of supply chain
This paper attempts to bridge the gap between the com-plicated dynamic strategic supply chain in practice and the sound describing models in theory. So the main con-tribution is to provide a mathematical modeling frame-work for assisting decision-makers in the design of their supply chains. It is necessary to point out that the mathematical modeling framework in this paper firstly includes the relocation of existing logistics nodes, and can reflect the expansion and reduction of the nodes – it is very common in the practical supply chain operations. Further more, the notion of production in this paper is a wide conception which includes service and production. Then, the setup or shutdown of a node, or the expansion or reduction of a node, is usually a time-and-cost-consu- ming process. Finally, in strategic supply chain circum-stances, it is emphasized that resources should be made full use and be integrated for better efficiency. So the capacity should be transmit to new nodes when some existing ones are shut down. Therefore, to implement smooth transition to a new network configuration needs better coordination of all operational aspects involved in this process, and better management of the required in-vestment capital. Hence, to abate the financial burden put on such a comprehensive project, capital expenditures and network design decisions should be planned over some periods. Based on such contents, this paper tries to put forward a modeling framework which can generally reflect the factors taken into account in optimizing stra-tegic supply chain.
4. Notation and Definition of Decision
Variables
In order to simply describe the principle of the problem and precisely reflect the planning of logistics nodes in the supply chain, there is a very important disposal in this paper. That is, the planning horizon is partitioned into a set of consecutive and integer time periods which may not necessarily be equal. In total, there are n plan-ning periods. Then, it is assumed that if capacity is to be shifted then this will occur at the beginning of period t ( ), and will have a relatively short duration compared to the period length. Finally, it is assumed that prior to the planning all relevant data (costs, capacities, and other factors) were collected through appropriate
forecasting methods or company-specific business analy-ses.
1, 2, ,t
4.1 Sets It is defined that:
N: set of logistics nodes.
: set of selectable logistics nodes, N.
s
: set of selectable existing logistics nodes, s . n
: set of potential sites for establishing new logistics nodes, n .
: set of product types.
According to such definition, set contains all types of logistics nodes and these are categorized in so-called selectable and non-selectable logistics nodes which can be denoted as “
N
\
N ”. Selectable logistics nodes form the set , a subset of , and include existing logistics nodes
N s
and potential sites for establishing new logis-tics nodes n. Note thats n=,s+n=.
An-other important assumption is: at the beginning of the planning horizon, all the logistics nodes in the set s
are operating. Afterwards, capacity can be shifted from these logistics nodes to new nodes located at the sites. 4.2 Costs
It is defined that:
,
t m p
PC : Variable cost of purchasing or producing one unit of product p by node m N in period t.
, ,
t l m p TC
p
: variable cost of shipping one unit of prod-uct from node l to node m (1, ) in period t.
,
m N l m
,
t m p
IC : variable inventory carrying cost per unit on hand of product p in node m at the end of period t.
,
t i j
MC : unit variable cost of moving capacity from the existing node isto a new established node jn
at the beginning of period t.
t m
OC : fixed cost of operating node m in period t.
t i
SC : fixed cost charged in period t for having shut down the existing node is at the end of period
(t1).
n t
j
FC : fixed setup cost charged in period t when a new facility established at node jn
1
4.3 Important Parameters
, ,
t l m p
x : amount of product p shipped from node l to node m (1,m N l , m) in period t.
During the research of this paper, there are such impor-tant parameters:
,
t m p
y : amount of product p held in stock in node
m N at the end of period t.
t m
K : maximum allowed capacity at node m in period t (similarly, t
m
K is the minimum required capacity at
node m in period t). ,
t i j
z : amount of capacity shifted from the existing node is to a newly established node jn at the
beginning of period t. ,
m p
: unit capacity consumption factor of product p at node m in period t.
,
m p
I :stock of product p of node m at the beginning of the planning horizon, observe thatIj p, 0forjn.
t
: capital not invested in period t.
t m
: It’s a “0-1” variable, if the selectable node
m N is operated during period t ,then t m
=1; other-wise, t
m
=0.
t
B : available budget in period t where interest rate is , and assume thatis a constant.
It is necessary to emphasize on that since each existing node is may have its capacity transferred to one or
more new nodes, it is assumed that its maximum capac-ity is non-increasing during the planning horizon, that is,
1
t t
i
According to such definition, it’s obvious that 1
, 0
i j
z
because the capacity is not transferred at the beginning of planning horizon. What’s more, at that time all exist-ing nodes are operatexist-ing and new nodes aren’t established, so 1 0, 1 1
j i
.
i
K ≥K .Similarly, potential new nodes must have non-decreasing capacities during the planning horizon, that is, K1j 0 for jn,and
1
t t
j j
K ≥K .
5. Mathematical Modeling Framework and
4.4 Decision Variablesthe Interpretation
The decision variables of this paper are as follows:5.1 Mathematical Modeling Framework ,
t m p
A : amount of product p produced or purchased
from an outside supplier by node m N in period t. The formulation of this paper’s model is as follows:
, , , , , , , ,
\
min t t t t t t
m p m p l m p l m p m p m p
t m N p t l N m N l p t m N p
PC A TC x IC y
\ s n
t t t t t
m m m i j
t m t m N t i t j
OC OC SC FC
(1)
The formulation shows that the goal of planning horizon is to minimum the total costs. Where, the total costs are con-sist of purchasing/producing cost, shipping cost, inventory
holding cost, operating cost, shutdown cost and establishing cost. The constraints are as follows (constraints of variables for non-negativity and integrality conditions are omitted):
S. t.
1
, , , , , , , ,
\ \ ,
t t t t t t
m p l m p m p m p m l p m p
m N l m N l
A x y D x y l
N (2)1
,
1 ,
s n
t t
t i
i i j i
j
K z K i
(3),
1 s ,
t t
t j
i j j
i
z K j
n
(4)1 ,
1 ,
s n
t
i i j j
z K i
1 1
, , , , , ,
\ 1 ,
s n
t
t t t
i
i p i p l i p i p i j
p l N i j
A x y K z i
(6)
1
, , , , , ,
\ 1 s ,
t
t t t
j p j p l j p j p i j
p l N i i
A x y z j
n
(7) 1 , , , , , \ \ , t
t t t
m
m p m p l m p m p
p l N m
A x y K m N
(8)
1
, , , , ,
\ ,
t
t t t t
m
m p m p l m p m p m
p l N m
A x y K m
(9)1
,
s
t t
i i i
(10)
1
,
t t
j j j
n
(11)
1 2 1 1
n j j
j FC
B
(12)
1
1
, ,
s n s n
t t t t t t t t t t t
i j i j i i i j j j
j i j
i
MC z SC FC B
1
(13)
1
1, ,
s n s
n n n n n n n n
i j i j i i i
i j i
MC z SC B
(14).2 Interpretations of the Modeling Framework
ure that only feasible capacity rel
5
Constraint (2) is the usual demand-supply flow conser-vation conditions which must hold for each product, lo-gistics node, and period.
Constraints (3–5) ens
ocations can take place during the planning horizon. Where, constraint (3) guarantees that only operating ex-isting logistics node is can have their capacity
moved to new facilities traint (4) imposes that by period t a new node has been constructed at site j n
; cons
in order for a potential capacity relocation; constr states that if the capacity of an existing node has been completely transferred to others then the node has to be closed. The combination of (3) and (5) ensures that if an existing logistics node doesn’t operate in a given period then its entire capacity was removed in one of the previ-ous periods. Moreover, by constraint (5) no more capac-ity can be shifted out at the beginning of the planning horizon.
Constraint
aint (5)
s (6–8) impose that the capacity of each no
tate that it is only worth to operate a se
of each selectable node to change at most once. Hence, if
can be sp
de can't be exceeded in each period. Observe that con-straint (6) also prevents any supply chain activities from taking place in existing nodes whose capacity has been totally relocated.
Constraint (9) s
lectable node if its output is above a given minimum level. Constraints (10) and (11) allow the configuration
an existing node is closed, it can’t be re-opened. Simi-larly, when a new node is established it will remain in operation until the end of the planning horizon.
Conditions (12–14) are budget constraints. In each period, there is a limited amount of capital that
ent on capacity transfers, shutting down existing nodes and establishing new logistics nodes. So the amount is given by the budget initially available in that period (represented by Bt ) plus the remained capital not in-vested in previous periods (represented by t1). In the first period, the allowed investments are as setting up new facilities that will start operating at the nning of the second period (see constraint (12)). Moreover, in each one of the following period t, the available capital may cover capacity transfers, the costs incurred by clos-ing existclos-ing logistics at the end of period t− 1, and set-ups of new nodes that start operating at the beginning of period t +1 (see constraint (13)). In the last period n, the allowed investments concern capacity transfers as well as shutdowns of nodes that ceased operating at the end of period n− 1 (see constraint (14)).
Thus, through reasonable assumptions and simplified methods, this paper puts forward a
begi
practical mathemati-ca
to give a computational experience.
6. Numerical Simulation by Computer
A simple numerical example simulated by computer software is given in this part to prove the correctness and
d rela-tive restrains described in the previous sections were
alternatives for the flow of products such as in
nodes in strategic supply chain as well as through reasonable
[image:6.595.315.532.263.426.2]analysis, this paper makes research on it systematically. Based on the references of existing
Figure 2. A tri-echelon network generated for computer simulation
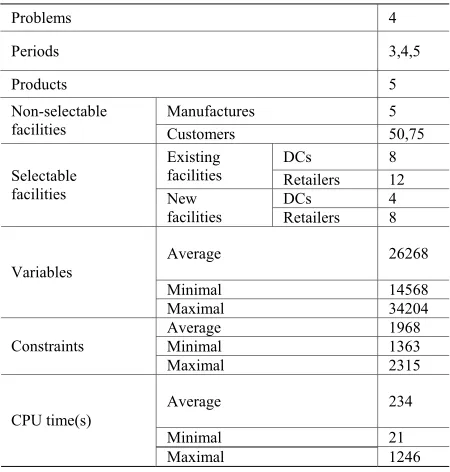
Table 1. The results of computer simulation efficiency of my model. The objective function an
implemented using the modeling language ILOG OPL Studio 3.6, and a variety of test problems were solved with standard mathematical programming software, namely with the branch-and-bound algorithm of ILOG CPLEX 8.0, on a computer with the hardware of AMD Athlon(tm) 64X2 Dual PC with 1.8 GHz processor and 1GB RAM.
In order to simulate the dynamic supply chain network circumstances and indefinite original quantities of logis-tics nodes, I randomly generated a tri-echelon network with various
ter-facility transportation, direct deliveries from the manufacturer to the customer level, and reverse arcs for the return of goods (Figure 2). For such a problem, Table 1 indicates the number of facilities selected and non-se-lected and displays the average, minimum, and maxi-mum CPU times (in seconds) required to attain optimal-ity of this problem for various variants of the original model. Some important contents should be noted: the second column of Table 1 gives the number of problems considered in this kind of network (for details about the problem characteristics we refer the reader to relative literatures). Five instances were randomly generated for this problem, thus yielding a total of 20 instances. The generated problems cover small and medium-scale net-works. In an attempt to generate problems related to re-alistic cases, the amount of arcs available for the trans-portation of goods in the networks is restricted to 60%. Also, only a given number of product types can actually flow through each generated arc. In this way, we can constrain the volume of traffic in the networks. In all the problems, the relocation decisions involve the distribu-tion centers and retailers. Furthermore, all data (costs, capacities, demands, etc.) were drawn at random from a uniform distribution over given intervals. These intervals were selected in such a way that a large variety of in-stances was created that differ by the number of periods, products and facilities, the availability of transportation arcs, the range of fixed and variable costs, and the range of capacities and capital for investments. For each sub-sequent period, the previous parameter value was creased or decreased by a certain percentage (for in-stance, 8%) which was randomly selected over a given interval. For example, customer demands for the first period were drawn following a uniform distribution in the interval [0, 25]. In the second period, the percentage increase compared to the first period was randomly gen-erated by 8%. This procedure was repeated until the last period of the planning horizon was attained, thus
creat-ing an increascreat-ing demand sequence. As mentioned above, all the details can be found in Melo et al. [18].
7. Conclusions
Aiming at the planning problem of logistics
sumption and deep
research woks and their insufficiencies, this paper estab-lishes a mixed integer programming modeling frame-work for strategic supply chain design from the view-point of the planning of logistics nodes. The aspects con-sidered include the relocation of existing nodes through
Problems 4
Periods 3,4,5
Products 5 Manufactures 5
Non-selectable
Customers
facilities 50,75
DCs 8 Existing
facilities Retailers 12 Selectable
DCs 4 Retailers 8 facilities New
facilities
Average 26268
Minimal 14568 Variables
Maximal 34204 Average 1968 Minimal 1363 Constraints
Maximal 2315
Average 234
Minimal 21 CPU time(s)
Maximal 1246
Manufacturers Distribution
Centers Retailers
[image:6.595.311.536.485.721.2]capacity transfers to new locations, integration of inv to tation a ly decisions, the av ility o udget fo ents in node loca and relocation, and the g ructure of the supp
r, such a modification w
[1] no, “Who shall survive,” Beacon House, Bea-con, NY, 1934.
[2] D. J. Watts an ctive dynamics of ‘small world’ networks,” Nature, No. 393, pp. 440-442,
“A comparative study of approaches to
ong and V. Srinivasan, “The multi-region dynamic
gion dy
for dynamic plant
, Heidelberg: Springer,
ions Research Proceedings, Vol. 3, pp. 467-472,
s nodes,” Computers and Operations Research, No.
.
94, 1998.
, pp. 59–82, 2006.
–115, 2006.
Interna-location,” Technical Report 58, Fraun-
en-ry, transpor f a given b
nd supp ailab
[7] D. J. Sweeney and R. L. Tatham, “An improved long-run model for multiple warehouse location,” Management Sci-ence, No. 22, pp. 748-758, 1976.
r investm tion
eneric st ly chain [8] T. Bender, H. Hennes, J. Kalcsics, M. T. Melo, and S. Nickel, “Location software and interface with GIS and supply chain management,” Berlin
network. This paper has shown that capacity expansion and reduction scenarios as well as modular capacity shifts can easily be incorporated into this model. To ver-ify the efficiency and correctness of the model, a com-putational simulation is generated by software. The simulation results show that a number of randomly gen-erated test problems can be solved to optimality within no more than 2 hours at average. Therefore, my model is worthy of being applied for the dynamic situation and complex supply chain design.
In future research, an important extension for this model is expected to change the assumption of determi-nistic demand, costs, and other factors in the problem to stochastic variables. Howeve
30, p
ould have an impact on the complexity of the problem. So it is necessary to develop efficient solution methods to this very realistic and strategically significant practical problem.
REFERENCES
J. L. More
d S. H. Strogatz, “Colle
[15]
1998.
[3] D. Erlenkotter,
dynamic location problems,” European Journal of Opera-tional Research, Vol. 6, pp. 133-143, 1981.
[4] C. O. F
capacity expansion problem-Parts I and II,” Operations Research, No. 29, pp. 787-816, 1981.
[5] C. O. Fong and V. Srinivasan, “The multi-re namic
tional Journal of Production Economics, 102(2), pp. 358–378, 2006.
[18] M. T. Melo, S. Nickel, and F. Saldanha da Gama, “Large-scale models for dynamic multi-commodity ca-pacitated facility
capacity expansion problem: An improved heuristic,” Management Science, No. 32, pp. 1140-1152, 1986. [6] S. K. Jacobsen, “Heuristic procedures
location,” Technical Report of the Institute of Mathemati-cal Statistics and Operations Research, 1977.
2002.
[9] J. Kalcsics, T. Melo, S. Nickel, and V. Schmid-Lutz, “Facility location decisions in supply chain management,” Operat
2000.
[10] Q. Wang, R. Batta, J. Bhadury, and C. M. Rump, “Budget constrained location problem with opening and closing of logistic
p. 2047-2069, 2003.
[11] M. Daskin, L. Snyder, and R. Berger, “Facility location in supply chain design,” Logistics Systems: Design and Op-timization, pp. 39–65, 2005
[12] B. M. Beamon, “Supply chain design and analysis: Mod-els and methods,” International Journal of Production Economics, No. 55, pp.281–2
[13] S. H. Owen and M. S. Daskin, “Strategic facility location: A review,” European Journal of Operational Research, No. 111, pp. 423–447, 1998.
[14] J.-F. Cordeau, F. Pasin, and M. M. Solomon, “An inte-grated model for logistics network design,” Annals of Op-erations Research, 144(1)
G. Hamer-Lavoie and J. F. Cordeau, “Un mode`le pour la conception d’un re´seau de distribution avec localisation, affectation et stocks,” INFOR, No. 44, pp. 99
[16] J. Dias, M. E. Captivo, and J. Climaco, “Capacitated dynamic location problems with opening, closure and re-opening of facilities,” IMA Journal of Management Mathematics, Vol. 17, No. 4, pp. 317–348, 2006. [17] D. Vila, A. Martel, and R. Beauregard, “Designing
logis-tics networks in divergent process industries: A method-ology and its application to the lumber industry,”