_______________________________________
*Corresponding authors’ email:[email protected] 135
Pavement Maintenance Scheduling using Genetic Algorithms
C. YANG, R. REMENYTE-PRESCOTT* and J. D. ANDREWS
Nottingham Transportation Engineering Centre, University of Nottingham, Nottingham, NG7 2RD, UK
(Received on May 09, 2014, revised on September 04, and September 26, 2014)
Abstract: This paper presents a new pavement management system (PMS) to achieve the optimal pavement maintenance and rehabilitation (M&R) strategy for a highway network using genetic algorithms (GAs). Optimal M&R strategy is a set of pavement activities that both minimise the maintenance cost of a highway network and maximise the pavement condition of the road sections on the network during a certain planning period. NSGA-II, a multi-objective GA, is employed to perform pavement maintenance optimisation because of its robust search capabilities and constraint handling method that deal with the multi-objective and multi-constrained optimisation problems. In the proposed approach, both deterministic and probabilistic pavement age gain models are utilised for evaluating the evolution of pavement condition over time because of their simplicity of application. The proposed PMS is applied to a case study network that consists of different kinds of road sections. The results obtained indicate that the model is a valuable toolbox for pavement engineers.
Keywords: Pavement management system, maintenance and rehabilitation strategy,
genetic algorithms, NSGA-II, pavement age gain model.
1. Introduction
In the presence of aging and deteriorating highway networks and inadequate budgets, it is of substantial importance for highways agency to preserve and enhance highway networks in a cost-effective way. Consequently, pavement management systems (PMS) have been developed to optimize maintenance decisions at both the network level and project level in order to achieve pavement performance requirements considering the applicable financial and technical constraints. Two main components are involved in a PMS: (1) the pavement deterioration model used to predict pavement performance; and (2) the technique used to determine the maintenance and rehabilitation (M&R) strategy for the road sections on the highway network.
stochastic nature of the pavement system with the consideration of uncertainty in inspection and prediction of pavement condition. Existing probabilistic models describe the pavement condition in qualitative, aggregate measures, e.g., excellent, good, fair and bad. Examples of the PMS that follow the probabilistic approach are proposed in [10-12]
Typically, there are two main approaches applied in the evaluation of M&R strategy: the prioritisation model [13-16] and the optimisation model [6-11]. Prioritisation is the traditional way applied to the decision making, which is defined as the “bottom-up” approach because the M&R treatments for each project are evaluated first and then they are prioritized and conducted according to the needs and resources of the highways agency [14]. The advantage of such a model is that it is easy to use and it can be implemented quickly. However, it cannot yield an optimal M&R strategy because there is no consideration of the influence of the whole M&R strategy on the pavement network during the planning period [17]. Conversely, optimisation utilises the “top-down” methodology, which is applied at the network level at first, and then extended to the project level to make specific decisions for individual sections. It aims to find the optimal M&R strategy for the pavement system according to its defined objectives, such as maximizing the proportion of “good” pavements subject to budget constraints, and minimizing the total life-cycle cost under the constraint of pavement quality. Also, it can be solely applied to pavement system at the project level, such as the segment-linked optimisation model [6], and both deterministic and probabilistic pavement performance prediction models can be incorporated into the optimisation model [8, 10].
Genetic Algorithms (GAs) were proposed by John Holland at the University of Michigan and applied as a computational technique in 1975 [18], which have been widely applied to solve the optimization problems. GAs are developed based on the survival-of-the-fittest concept of Darwinian evolution. Goldberg in [19] constructed the initial framework for GAs, known as the binary-coded genetic algorithm (BGA), and exhibited its robustness of optimization and search. The major barrier of the optimization problem is that the solution space grows exponentially with the size of the problem, so the conventional optimization approach can be inefficient while searching for the optimal solution. GAs, which imitate the natural process of biological evolution, can be more efficient than the conventional optimization methods and the probability of reaching the optimal solution is increasing. During the last two decades GAs have been widely studied and experimented, and significant contributions have been achieved within pavement management engineering [6, 20-23]. GAs are attractive to pavement engineers because of their robust search capabilities and ease of implementation. Furthermore, GAs are applicable to solve multi-objective optimization problems. During the last few years multi-objective genetic algorithms (MOGAs) were successfully applied to a large amount of pavement maintenance scheduling problems [24-26]. Recently, many different MOGAs have been proposed, among which the improved non-dominated sorting genetic algorithm (NSGA-II) is recognized as one of the most advanced method for solving multi-objective problems [27, 28].
underlying assumption for the deterministic model is that the pavement condition after maintenance cannot be better than the initial pavement condition; while using the probabilistic model, it is possible that renewals enhance the initial pavement condition. The objective of this paper is to provide an approach that uses NSGA-II in conjunction with both deterministic and probabilistic pavement age gain models for optimising pavement M&R strategy. The proposed approach is anticipated to preserve and enhance the existing highway network in a more cost-effective way. The first section describes the formulation of the deterministic pavement maintenance optimisation model and the solution to this optimisation problem using NSGA-II. The second section presents the application of the deterministic PMS to a simple case study network. The third and fourth sections depict the derivation of the probabilistic optimisation model and its application to the same network.
Notation
t n
C , maintenance cost for road section group n at year t
T n
rpl , remaining pavement life for road section group n at year T
Ln total length of road sections that belong to group n N number of road section groups
T planning horizon
d discount rate
) (i
rplt remaining pavement life for road section i at year t
m pavement condition of road section i at year t, i.e., 0,1,2 and 3, according to Table 2
k maintenance action performed in road section i at year t
] ][ [
, m k
agti age gain associated with the maintenance action performed on road section
i at year t , according to Table 2
pl(i) initial pavement life for road section i
t
B budget for year t, £’000
) , (i x
ON normalised parameter value of objective i for solution x
) , (i x
O actual value of objective i for solution x
max) , (i
O maximum parameter value of objective i for non-dominated solutions
min) , (i
O minimum parameter value of objective i for non-dominated solutions
2. Deterministic Optimization Model
2.1 Deterministic Pavement Age Gain Model
[image:4.595.113.489.282.396.2]The deterministic pavement age gain model was firstly proposed by Abaza and Ashur [24], which uses the expected age gain associated with the M&R actions as the pavement improvement indicator. In this paper, five maintenance actions are considered, do nothing (0), patching (1), surface dressing (2), resurfacing (3) and overlay (4). The maintenance cost and duration associated with each maintenance action is shown in Table 1 [29].
Table 1: Maintenance Duration and Cost for Each Type of Maintenance Action
M&R type Single Carriageway (S2) Dual 2 Lane carriageway
(D2AP)
Dual 3 Lane motorway (D3M)
Duration (days)
Cost (£’000s)
Duration (days)
Cost (£’000s)
Duration (days)
Cost (£’000s)
Do nothing (0) 0 0 0 0 0 0
Patching (1) 2 50 3 100 4 140
Surface dressing (2)
4 70 5 140 6 170
Resurfacing (3) 8 200 14 550 20 900
Overlay (4) 16 320 23 820 33 1350
Note, that costs and days are for 1km of road, that is, both carriageways.
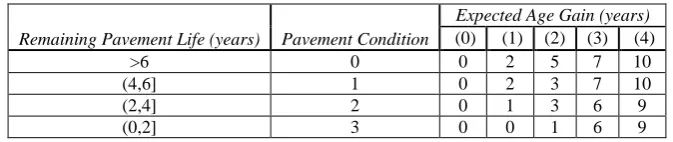
Instead of using pavement condition rating index (PCR) [24], the remaining pavement life for each road section is classified to indicate the pavement condition, so that the consistency with the pavement improvement indicator can be ensured, as shown in Table 2. The age gain is characterised by the pavement condition of the road section, given in Table 2 [29]:
Table 2: Expected Ages Associated with Pavement Maintenance Actions versus Remaining Pavement Life
Remaining Pavement Life (years) Pavement Condition
Expected Age Gain (years)
(0) (1) (2) (3) (4)
>6 0 0 2 5 7 10
(4,6] 1 0 2 3 7 10
(2,4] 2 0 1 3 6 9
(0,2] 3 0 0 1 6 9
2.2 Classification of Road Sections
When each road section is deployed as the decision making unit, the optimisation of the M&R strategy becomes computationally inefficient for a highway network that is composed of a large amount of sections, which is the case of most highway networks [6, 8, 11]. To deal with this problem, the proposed formulation of the maintenance
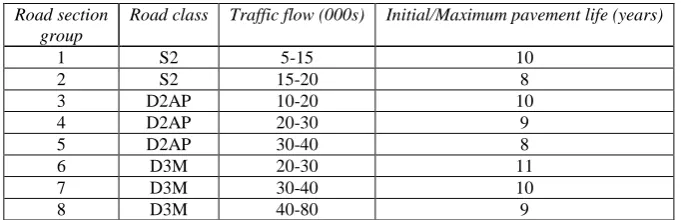
optimisation problem groups road sections on a highway network according to similar properties, such as road classes, traffic categories, and climatic regions, which govern the pavement performance. By this means, all individuals from the same group are assumed to have the same performance characteristics and should be studied in a similar manner. In this paper, climatic conditions are not considered, as the road sections on a relatively small-sized highway network belong to the same climatic region. The classification of road sections is illustrated in Table 3 [29].
[image:4.595.130.467.490.561.2]Table 3: Road Section Types
Road section group
Road class Traffic flow (000s) Initial/Maximum pavement life (years)
1 S2 5-15 10
2 S2 15-20 8
3 D2AP 10-20 10
4 D2AP 20-30 9
5 D2AP 30-40 8
6 D3M 20-30 11
7 D3M 30-40 10
8 D3M 40-80 9
Note, that flows are opening year Annual Average Daily Traffic (AADT).
2.3 Model Formulation
As stated above, the two objectives of the PMS, presented in this paper, are to minimize the pavement maintenance cost and maximize the remaining pavement life of all the road sections on the network, which are formulated as follows:
∑∑
= = + N n T t t n t C d Min 1 1 , ) 1 ( 1, n=1,...N;t=1,...T (1)
n N n T n L rpl
Max
∑
×=1
, , n=1,...N;t=1,...T (2) The discount rate is used to transform costs and benefits arising in different years to their present value. A discount rate of 0.035 is adopted in this paper [30].
The evolution of the remaining pavement life for road section i at year t is evaluated as: 1 ] ][ [ ) ( )
(i =rpl−1i +ag, m k −
rplt t ti (3)
If rplt(i)> pl(i), then rplt(i)= pl(i) (3
a )
Equation (3a) indicates that the pavement condition of road section after maintenance cannot be better than the initial condition. The constraints of the model are stated below:
min
) (i rpl
rplt ≥ (4)
t N
n
t n
t C B
d < +
∑
=1 , ) 1 ( 1 (5)The first constraint is that the remaining pavement life for each road section group n
cannot be smaller than the minimum remaining pavement life. The second constraint is the budget constraint, where the maintenance cost on the whole network at year t cannot exceed the available budget. Further constraints can be included, for example, the number of major M&R actions for the whole network/individual road sections per year cannot exceed a set threshold.
2.4 Method for Model Solution
of the involved objectives, and then to identify the corresponding Pareto frontier. Finally, the acceptable solution is selected according to the decision criteria. As multi-objective genetic algorithms in this case, also known as MOGAs, are easy to implement, are robust, and require less knowledge about the problem being solved, they are more suitable to achieve the Pareto optimal set than other multi-objective optimisation techniques [31]. In this paper, NSGA-II is employed to perform the optimisation [27], which is developed based on Goldberg’s non-dominated sorting procedure and sharing approach [32]. The principle of the method is that NSGA-II starts from the generation of an initial pool of chromosomes, and the objective values for each chromosome are calculated according to the objective functions. Then Goldberg’s non-dominated sorting procedure is applied to find all the non-dominated individuals that have the same reproductive potential, in which the fitness value of each individual is calculated according to the non-dominated criterion instead of the objective values themselves. If convergence is not verified, the individuals in the parent pool are processed by genetic operators, i.e.,
reproduction, crossover and mutation, to generate offspring solutions, and the algorithm returns to the fitness evaluation step for the next generation. This process continues to generate new solutions that would give an improved frontier that dominates the existing frontier that was achieved in the previous iterations, until a set of globally non-dominated solutions is found or the maximum number of simulation generations is exhausted.
3. Application of the Deterministic PMS
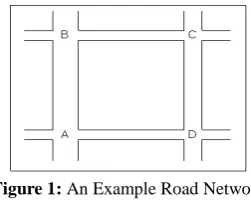
[image:6.595.234.360.487.587.2]The developed deterministic PMS is used to plan the maintenance of a newly constructed road network during a planning horizon T of 20 years. For the illustration purpose, an example network that consists of 4 road sections is analysed, which is shown in Figure 1. The network is composed of a motorway (AB), a dual carriageway (CD), and two single carriageways (BC and AD). Each section is 1 km long.
Figure 1: An Example Road Network
The pavement condition of the road sections on the network is depicted in Table 4:
Table 4: Pavement Condition for the Example Network
Road section Road section group Initial pavement life (years)
AB 6 11
BC 1 10
CD 3 10
AD 2 8
As there are 4 road sections on the network, 80 decision variables are used in this problem. As shown in Figure 2, the decision variable Int represents the maintenance action
implemented on road section n at year t. The decision string structure for road section n is represented by:
In1 In2 In3 In4 In5 In6 In7 In8 … In15 In16 In17 In18 In19 In20
3.1 Objectives and Constraints
As stated in Section 2.3, two objective functions are considered, which are formulated as:
∑∑
= = + 4 1 20 1 , ) 1 ( 1 n t t n tC d Min (6) n n L rplMax
∑
×= 4 1 20 , 4 (7)
and the constraints are evaluated as:
3 ) (i ≥
rplt (8)
2000 ) 1 ( 1 1 , < +
∑
= n n t n tC d (9)The minimum remaining pavement life is defined, say 3 years, so that the serviceability of pavements could be ensured, and the available annual budget is £2,000,000.
3.2 GA parameters
A tabular form of the system diagram is shown in Table 4, for example, at location 3 the upstream component is the divider, which is connected to location 3 via the port out1, and the downstream component is pressure relief valve PRV2, which is connected to it via the port in. There are four main GA parameters to consider: the population size (P), the maximum number of simulation generations (M), the crossover rate (pc) and the mutation
rate (pm). As 80 variables need to be optimised, the population size is set to 500. Based on
NSGA-II, an analysis was conducted to investigate the effect of changing GA parameter values. A limited set of values for each GA parameter was selected as follows:
pc: 0.6, 0.7, 0.8, 0.9 pm: 0.001, 0.01, 0.1 M: 5000
P: 500
The applied crossover rate (pc) usually varies from 60% to 90% to make sure that most
of the chromosomes have the chance to crossover. The value of less than 10% chromosomes that are allowed to mutate (pm) is used to make sure that most of the good
chromosomes are retained. The size of generation at 5000 and of population at 500 are sufficient for a simple road network.
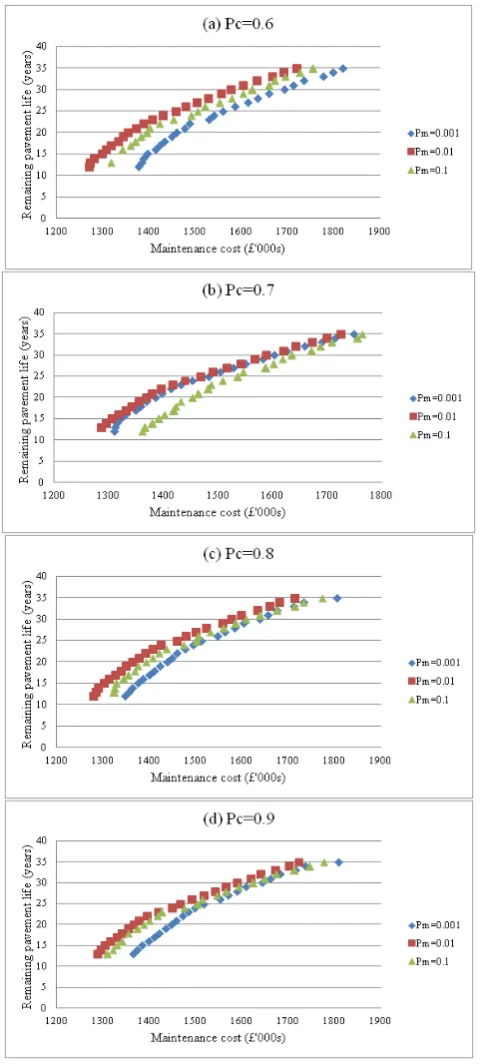
NSGA-II is used to determine the optimal Pareto frontiers using different combinations of crossover and mutation rates. Figure 3 is used to analyse the effect of mutation rates on the optimisation results when specific crossover rates are chosen.
The results show that the mutation rate 0.01 lead to a better performance. This is because when the mutation rate is too high, the offspring solutions cannot maintain some good genes of their parents. While for the lower mutation rate, some helpful genes may never be explored. Figure 4 shows how the crossover rate influences the optimisation process when the mutation rate is 0.01.
Figure 4: Optimum Pareto Frontier for Different Crossover Rates when Pm=0.01
In order to consume less computational effort, the optimal crossover rate is chosen as 0.6. Therefore, the crossover rate of 0.6 and the mutation rate of 0.01 are applied in this part of the study.
3.3 Testing
The propagation tables for the main types of components in fluid systems are given in this section. To perform further testing, the set of GA parameters values, i.e., the crossover rate of 0.6, the mutation rate of 0.01 and the population of 500, is used and 5 simulation runs are conducted. The maximum number of generations in a single run of the test is also set to 5000 generations.
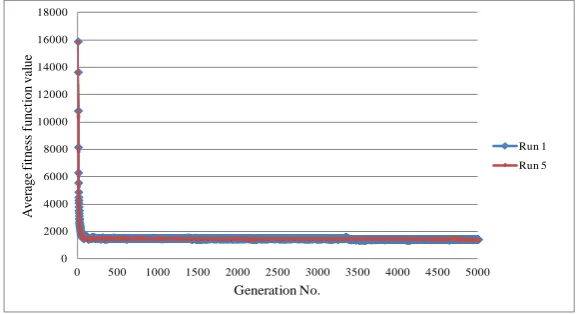
The average fitness function value in each generation is deployed, as the indicating factor when considering the convergence of the optimisation problem. For instance, the results obtained at each generation for runs 1 and 5 are presented in Figure 5. The results indicate that the average population fitness function value converges towards the optimal solution. It is identified that the results are scattered in a relatively narrow range and the convergence to the optimal solution is obtained.
0 2000 4000 6000 8000 10000 12000 14000 16000 18000
0 500 1000 1500 2000 2500 3000 3500 4000 4500 5000
A
ve
ra
ge
f
it
ne
ss
f
unc
ti
on
va
lue
Generation No.
Run 1 Run 5
[image:9.595.154.443.547.704.2]3.4 Optimal Pareto Solution
Based on the same GA parameter values as Section 3.3, NSGA-II [27] is employed to achieve the optimal M&R strategy, and the resulting optimal Pareto frontier after a different maximum number of generations is illustrated in Figure 6.
0 5 10 15 20 25 30 35 40
1200 1300 1400 1500 1600 1700 1800 1900
R em ai ni ng p av em en t l if e (y ea rs )
Maintenance cost (£'000s)
500 genera tions
1000 genera tions 2000 genera tions
5000 genera tions
10000 genera tions
[image:10.595.172.427.244.366.2]20000 genera tions
Figure 6: Optimal Pareto Frontier
The optimal Pareto frontier obtained is approaching the real Pareto frontier with increasing simulation generations. The results demonstrate that the optimal Pareto frontier is achieved at generation 5000, which cannot be improved significantly with further iterations.
The next step of the analysis is to normalise the obtained optimal Pareto frontier. The normalised distance for each non-dominated solution is calculated in terms of its objective function values. A normalised objective function value is achieved over a range of 0-100 for each objective based on the following mapping rules [25]:
100 min) , ( max) , ( min) , ( ) , ( ) , ( × − − = i O i O i O x i O x i
ON (10)
For this optimization problem, O(1,min)=£1,264,076 and O(1,max)=£1,707,796for
the objective of minimizing maintenance cost; O(2,min)=12years and
35 max) , 2
( =
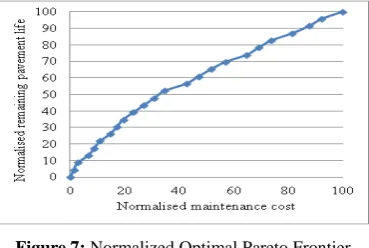
O years for the objective of maximizing remaining pavement life. The purpose of this mapping approach is to describe the two objective parameters in a single space. Based on Equation (10), the normalised optimal Pareto frontier is illustrated in Figure 7.
Figure 7: Normalized Optimal Pareto Frontier
The final step is to identify the solution that has the smallest Euclidean distance, dk,
[image:10.595.207.392.590.714.2]2 2
max)] , 2 ( ) , 2 ( [ min)] , 1 ( ) , 1 (
[ N N N N
k O x O O x O
d = − + − (11)
The optimal solution based on the shortest normalised distance is determined as maintenance cost of £1,418,291 and total remaining pavement life of 24 years, chosen from the optimal Pareto solution set within the space of £1,264,076-£1,707,796 for maintenance cost, and 12-35 years remaining pavement life for the network.
[image:11.595.194.403.435.703.2]The resulting optimal Pareto solution is described in Table 5:
Table 5: The Optimal M&R Strategy
Road section
Maintenance scheduling during the planning horizon T (20 years)
1 2 3 4 5 6 7 8 9 10 11 12 13 14 15 16 17 18 19 20 AB 0 0 0 0 2 0 0 0 2 0 0 0 2 0 0 0 0 0 0 0 BC 0 0 0 0 0 0 0 2 0 0 2 0 0 2 0 0 2 1 1 2 CD 0 0 0 0 0 0 0 2 0 0 2 0 0 2 0 0 2 0 0 2 AD 0 0 0 0 0 2 0 0 2 0 0 2 0 0 2 0 0 2 1 1
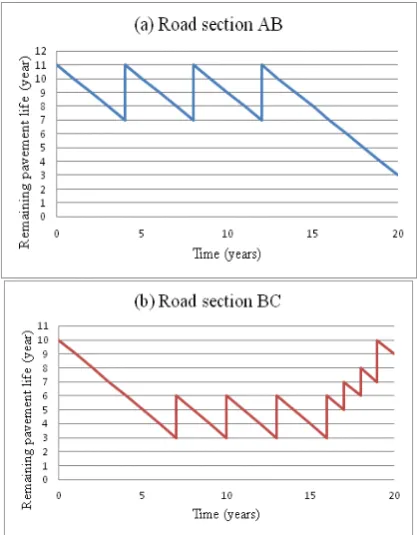
Examining Table 5, the maintenance plan for each road section on the network is provided. For road section AB, three maintenance actions are implemented over 20 years,
i.e., three surface dressing (2) actions in years 5, 9 and 13. No resurfacing (3) or overlay (4) is carried out.
Figure 8: Pavement Life Cycle: (a) Section AB, (b) Section BC, (c) Section CD, (d) Section AD
For road section AD, maintenance action (2) is scheduled at year 6. The remaining pavement life at the beginning of year 6 is 3 years, and then surface dressing (2) is applied to prolong the pavement life by 3 years according to Table 2. At the end of year 6, the remaining pavement life decreases to 5 years as one year elapses. 4 more surface dressing (2) actions are applied, before patching (1) is implemented in year 19 and 20. At the end of the planning period, the remaining pavement life is 7 years. We also found that road sections BC and AD are maintained frequently at the late state of the planning period; this is because the maximisation of remaining pavement life is employed as one objective. As the same coefficient, i.e., 1, shown in Equation (7), is assigned to each road group, single carriageway, i.e., road sections BC and AD, requires less maintenance cost than dual carriageway and motorway to restore pavement condition. The variation of coefficients for each road group can play an important role in the pavement maintenance optimisation problems, as it is directly related to the second objective function.
3.5 Application to a Large Network
When the proposed PMS is used to plan the maintenance of a large network that is composed of a number of road sections, the involved road sections can be classified into groups, described in Table 3. In this case, it is assumed that the individuals from the same group have similar performance. As a result, maintenance actions are assigned to each road section group at each year during the planning horizon, not to each individual road. Hence, less computational effort is required for such an approach.
4. Probabilistic Optimization Model
distribution is recognised as one of the most widely used probabilistic distributions in engineering problems. Its probability density function is symmetric about the mean, μ, and shape is determined by its mean and standard deviation, σ. Probabilistic pavement models are able to incorporate the uncertainty and predict the pavement performance as the probability of occurrence of a range of possible outcomes.
4.1 Probabilistic Pavement Age Gain Model
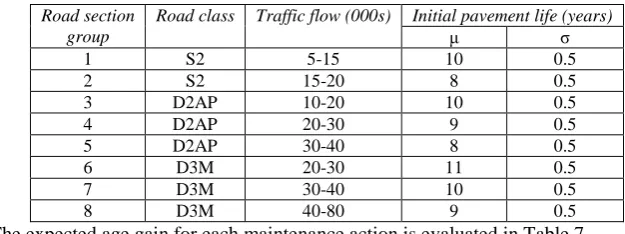
[image:13.595.135.448.343.460.2]A probabilistic pavement age gain model is developed, and central limit theorem is used to generate standard normal variates. For instance, the initial pavement life for a new pavement is characterised by a normal distribution with mean of 10 years and standard deviation of 0.5 years. The pavement condition for each road section group provided in Section 2.2 is depicted in Table 6.
Table 6: Road Section Types in Probabilistic Pavement Model
Road section group
Road class Traffic flow (000s) Initial pavement life (years)
μ σ
1 S2 5-15 10 0.5
2 S2 15-20 8 0.5
3 D2AP 10-20 10 0.5
4 D2AP 20-30 9 0.5
5 D2AP 30-40 8 0.5
6 D3M 20-30 11 0.5
7 D3M 30-40 10 0.5
8 D3M 40-80 9 0.5
The expected age gain for each maintenance action is evaluated in Table 7.
Table 7: Expected Ages Associated with Pavement Maintenance Actions Versus Remaining Pavement Life in Probabilistic Pavement Model
Remaining pavement life (years)
Pavement condition
Expected age gain (years)
Do nothing (0)
Patching (1) SD (2) Re (3) Ov (4)
μ σ μ σ μ σ μ σ μ σ
>6 0 0 0 2 0.3 5 0.3 7 0.3 10 0.3
(4,6] 1 0 0 2 0.3 3 0.3 7 0.3 10 0.3
(2,4] 2 0 0 1 0.3 3 0.3 6 0.3 9 0.3
(0,2] 3 0 0 0 0.3 1 0.3 6 0.3 9 0.3
The standard deviation values are assumed, which can be calibrated in terms of real data.
4.2 Application of the Probabilistic PMS
Consider the road network given in Figure 1. For the road section AB, the optimal M&R strategy, depicted in Table 5, was obtained and the changes are shown in Figure 8(a). When applying the probabilistic pavement age gain model, the performance of section AB
[image:13.595.112.483.494.589.2]Figure 9: Probabilistic Pavement Life Cycle of Road Section AB
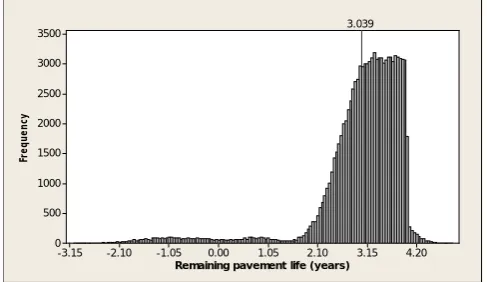
As expected, Figure 9 shows that the results obtained in each run follow a similar pattern. However, the variation in the remaining pavement life is observed. Therefore, due to this variation the same M&R strategy can result in different pavement conditions. When more simulations are carried out, the distribution of the remaining pavement life at year 20 is investigated, illustrated in Figure 10.
4.20 3.15 2.10 1.05 0.00 -1.05 -2.10 -3.15 3500
3000
2500
2000
1500
1000
500
0
Remaining pavement life (years)
Fr
eq
ue
nc
y
3.039
Figure 10: Distribution of the Remaining Pavement Life of Road Section AB
The mean sample is identified as 3.039 years, which is slightly higher than the remaining pavement life of 3 years, obtaining by using the deterministic approach. Finally, the example road network is investigated using the probabilistic pavement age gain model. As before, NSGA-II is used to find the optimal Pareto frontier, 10 runs are carried out. The GA parameters are set to be, as these were chosen in the deterministic case.
pc: 0.6 pm: 0.01 M: 5000
P: 500
[image:14.595.177.421.376.517.2]Figure 11: Probabilistic Pareto Optimal Frontier
It shows that each optimal Pareto frontier follows the same trend with some variation. Also, the average optimal Pareto frontier is obtained, which is slightly above the deterministic optimal Pareto frontier, obtained in Section 3.4. This is because in the probabilistic model, the remaining pavement life is allowed to exceed the maximum remaining pavement life, which is contrary to the deterministic model as shown in equation (1a). In addition, the GAs aim to find the solutions with smaller cost and longer remaining pavement life, so that the solutions with the same maintenance cost and longer remaining life would be retained on the optimal Pareto frontier, which is the case for the probabilistic optimal Pareto frontier. The solutions with the same cost mean that the same optimal Pareto set is achieved, though different pavement conditions, i.e., longer remaining pavmenet life, are resulted. The varation of the probabilistic optimal Pareto frontier indicates the stocastic nature of pavement, and demonstrates that the probabilistic model is more realistic. However, the probabilistic model requires more computational effort than the deterministic one.
5. Conclusions
This paper presents a new approach to assign maintenance actions on a highway network. For the proposed PMS, both deterministic and probabilistic pavement age gain models are deployed to evaluate and forecast pavement condition, and NSGA-II is used to resolve the computational complexity of the maintenance optimisation problem. The formulation of the optimisation problem aims to both minimise the maintenance cost and maximise the pavement condition of a highway network over a given planning period. In this formulation, a road section group is employed as a decision making unit for the optimisation model, from which the road sections are given the same treatment. In this manner, less computational effort is required.
the optimal Pareto frontier using the deterministic model. The value of the remaining pavement life is higher for the same value of maintenance cost when the probabilistic model is considered. This application indicated the feasibility, capability, and efficiency of using NSGA-II in conjunction with both deterministic and probabilistic pavement age gain models. For the probabilistic model, normal distribution is chosen to characterise the expected life for new pavement and the age gain resulting from maintenance actions, thus the remaining pavement life is achieved as a distribution of possible outcomes, instead of a single value. The normal distribution was chosen in this study as it is one of the most commonly used probability distributions in engineering problems, but other lifetime distributions, such as Weibull distribution, can also be used to describe the stochastic nature of pavements. Further analysis is needed to select an appropriate distribution for data available. However, the same optimal M&R strategy, i.e., the one with the objectives of maximizing pavement condition and minimizing maintenance cost studied in Section 3.4, will be achieved, as the majority of the samples generated from a different distribution would fall into a narrow interval approaching the mean value.
With the increase of highway network geometry, the computational effort for GAs increases exponentially. In the case study, for the deterministic PMS, it takes 15 minutes for NSGA-II to optimise the maintenance actions for the case study network. As for the probabilistic one, 60 minutes is required. In this paper, NSGA-II is applied as the optimisation method which has proven itself to be sufficient enough for constrained multi-objective problems. However, more constraints can be added to the optimisation model, such as limitation of the use of surface dressing on motorways, and forcing structural maintenance on heavily trafficked roads (at least once during the life cycle). In addition, other advanced GAs and hybrid heuristic techniques can be implemented, as they have the feature of retaining the advantages of GAs, but prominently improve their searching ability and computational efficiency in achieving the global optimal.
Acknowledgement: John Andrews is the Royal Academy of Engineering and Network
Rail Professor of Infrastructure Asset Management. He is also Director of The Lloyd’s Register Educational Trust Centre* for Risk and Reliability Engineering at the University of Nottingham. Rasa Remenyte-Prescott is The Lloyd’s Register Educational Trust Lecturer in Risk and Reliability Engineering at the University of Nottingham. Both authors gratefully acknowledge the support of the appropriate organisations.
*Lloyd’s Register Foundation helps to protect life and property by supporting engineering-related education,
public engagement and the application of research.
References
[1] Kay, R.K., J.P. Mahoney, and N.C. Jackson. The WSDOT Pavement Management
System—A 1993 Update. Washington State Transportation Center (TRAC), 1993.
[2] Hall, K.T., and C.E. Correa Munoz. Estimation of Present Serviceability Index from
International Roughness Index. Transportation Research Board, 1999; 1655: 93-99.
[3] Jain, S., S. Aggarwal, and M. Parida. HDM-4 Pavement Deterioration Models for Indian
National Highway Network. Journal of Transportation Engineering, 2005; 131(8):
623-631.
[4] Martin, T.C. State-of-the-art Pavement Performance Modelling at a Network and Project
Level. Australian Road Research Board, 1998.
[5] W.D.O P. Road Deterioration and Maintenance Effects: Models for Planning and
[6] Ferreira, A., L. Picado-Santos, and A. Antunes. A Segment-linked Optimization Model for
Deterministic Pavement Management Systems. International Journal of Pavement
Engineering, 2002; 3(2): 95-105.
[7] Herabat, P., and A. Tangphaisankun. Multi-Objective Optimization Model using
Constraint-Based Genetic Algorithms for Thailand Pavement Management. Journal of the
Eastern Asia Society for Transportation Studies, 2005; 6: 1137-1152.
[8] Jorge, D., and A. Ferreira. Road Network Pavement Maintenance Optimisation using the
HDM-4 Pavement Performance Prediction Models. International Journal of Pavement
Engineering, 2011; 13(1): 39-51.
[9] Mbwana, J., and M. Turnquist. Optimization Modeling for Enhanced Network-Level
Pavement Management System. Transportation Research Record: Journal of the
Transportation Research Board, 1996; 1524(1): 76-85.
[10] Golabi, K., R. Kulkarni, and G. Way. A Statewide Pavement Management System. Interfaces, 1982; 12(6): 5-21.
[11] Ferreira, A., A. Antunes, and L. Picado-Santos. Probabilistic Segment-linked Pavement
Management Optimization Model. Journal of Transportation Engineering, 2002; 128(6):
568-577.
[12] Wu, Z., and G.W. Flintsch. Pavement Preservation Optimization Considering Multiple
Objectives and Budget Variability. Journal of Transportation Engineering, 2009; 135(5):
305-315.
[13] Hassab-alla, A.H. Decision Support Model for Prioritising Pavement Maintenance
Activities. LP GIS approach. M.Sc. Thesis, University of Twente, Faculty of
Geo-Information, 2001.
[14] Cook, W.D., and R.L. Lytton. Recent Developments and Potential Future Directions in
Ranking and Optimisation Procedures for Pavement Management. Second North
American Conf. on Managing Pavements, Toronto, Canada, 1987; 135-155.
[15] Robinson, R., U. Danielson, and M. Snaith. Road Maintenance Management: Concepts
and Systems. Anthony Rowe Ltd, Chippenham, Wiltshire, 1998.
[16] Zimmerman, K.A. Pavement Management Methodologies to Select Projects and
Recommend Preservation Treatments. National Cooperative Highway Research Porgram,
Transportation Research Board, 1995, 222.
[17] Gendreau, M., and P. Soriano. Airport Pavement Management Systems: an Appraisal of
Existing Methodologies. Transportation Research Part A: Policy and Practice, 1998;
32(3): 197-214.
[18] Holand, J.H. Adaptation in Natural and Artificial Systems. University of Michigan Press, Ann Arbor, Mich, 1975.
[19] Goldberg, D.E. Genetic Algorithms in Search, Optimization and Machine Learning. Addison-Wesley Publishing Company, Reading, Mass, 1989.
[20] Bosurgi, G., and F. Trifirò. A Model Based on Artificial Neural Networks and Genetic
Algorithms for Pavement Maintenance Management. International Journal of Pavement
Engineering, 2005; 6(3): 201-209.
[21] Chan, W.T., T.F. Fwa, and C.Y. Tan. Road-Maintenance Planning Using Genetic
Algorithms. I: Formulation. Journal of Transportation Engineering. 1994; 120(5):
693-709.
[22] Fwa, T.F., C.Y. Tan, and W.T. Chan. Road-Maintenance Planning Using Genetic
Algorithms. II: Analysis. Journal of Transportation Engineering. 1994; 120(5): 710-722.
[23] Morcous, G., and Z. Lounis. Maintenance Optimization of Infrastructure Networks using
Genetic Algorithms. Automation in Construction, 2005; 14(1): 129-142.
[24] Abaza, K.A., and S.A. Ashur. Optimum Microscopic Pavement Management Model using
Constrained Integer Linear Programming. International Journal of Pavement
Engineering, 2009; 10(3): 149-160.
[25] Fwa, T.F., W.T. Chan, and K.Z. Hoque. Multiobjective Optimization for Pavement
[26] Mbwana, J.R. A Framework for Developing Stochastic Multi-objective Pavement
Management Systems. First Conf. on Road Transportation Technology Transfer, Arusha,
Tanzania, 2001; 350-363.
[27] Deb, K., A. Pratap, S. Agarwal, and T. Meyarivan. A Fast and Elitist Multiobjective
Genetic Algorithm: NSGA-II. Evolutionary Computation, IEEE Transactions on, 2002;
6(2): 182-197.
[28] Konak, A., D. Coit D, and A. Smith. Multi-objective Optimization using Genetic Algorithms: A Tutorial. Special Issue - Genetic Algorithms and Reliability, 2006; 91(9): 992-1007.
[29] Department for Transport. Design Manual for Roads and Bridges (DMRB) Volume 5:
Assessment and Preparation of Road Schemes, Department for Transport, 1997.
[30] Department for Transport. Design Manual for Roads and Bridges (DMRB) Volume 13:
Economic Assessment of Road Schemes, Department for Transport, 2004.
[31] Sbalzarini, I.F., Muller, S., and P. Koumoutsakos P. Multiobjective Optimization using
Evolutionary Algorithms. 2000 Summer Program, Center for Turbulence Research,
Stanford University.
[32] Srinivas, N., and K. Deb. Muiltiobjective Optimization using Nondominated Sorting in
Genetic Algorithms. Evolutionary Computation, 1994; 2(3): 221-248.
Chao Yang obtained his B.Eng. degree in Hydraulic and Hydro-electric Engineering from Sichuan University in China. Following this he got his M.Sc. (2009, Structural Engineering) and Ph.D. (2013, Highway Asset Management) at the University of Nottingham in the UK. Since 2013 Chao works as the Highway Planning Engineer at the Transport Planning and Research Institute for the Ministry of Transport in Beijing, China.
For biographic information of Rasa Remenyte-PrescottandJohn D. Andrews, please