Sound spotting – an approach
to content-based sound retrieval
Christian Spevak, Richard Polfreman Music Department, University of Hertfordshire
College Lane, Hatfield, Herts AL10 9AB, UK
We present an approach to content-based sound retrieval using auditory models, self-organizing neural networks, and string matching techniques. It addresses the issues of spotting perceptually similar occurrences of a particular sound event in an audio document. After introducing the problem and the basic approach we describe the individual stages of the system and give references to additional literature. The third section of the paper summarizes the preliminary experiments involving auditory models and self-organizing maps we carried out so far, and the final discussion reflects on the overall concept and suggests further directions.
Keywords: content-based retrieval, sound classification, auditory model, self-organizing map, string matching
1 Introduction
1.1 Problem
The possibility of storing large quantities of sound or video data on digital media has resulted in a growing demand for content-based retrieval techniques to search multimedia data for particular events without using annotations or other meta-data. This paper presents an approach to a task that can be described as sound spotting: the detection of perceptually similar sounds in a given document, using a query by example, i.e. selecting a particular sound event and searching for ‘similar’ occurrences. The proposed system could be applied to content-based retrieval of sound events from digital recordings or broadcasting archives or to aid transcription and analysis of non-notated music.
A special problem is posed by the definition of perceptual similarity: sound perception comprises so many different aspects (such as loudness, pitch, timbre, location, duration) that it is very hard to define a general perceptual distance measure for a pair of sounds. Even if the variability is restricted to timbre alone, it is still largely uncertain how to define a timbre space with respect to any underlying acoustical features (Hajda, Kendall, Carterette and Harshberger 1997). Therefore we decided to define ‘similarity‘ within the scope of our system as characterized by a similar evolution of cochleagram frames.
1.2 Approach
Over the last ten years a number of researchers have investigated various connectionist approaches to model the perception of timbre (Cosi, De Poli and Lauzzana 1994, Feiten and Günzel 1994, De Poli and Prandoni 1997, Toiviainen 1997, Toiviainen, Tervaniemi, Louhivuori, Saher, Huotilainen and Näätänen 1998). Sounds are preprocessed with a simplified model of the auditory periphery, and the resulting feature vectors are classified by means of a self-organizing map, which projects multidimensional input vectors onto a low-dimensional topological surface. An introduction to this area including a brief literature survey has been given by Toiviainen (2000).
Our concept attempts to extend these models by dealing with evolutions of timbre, pitch and loudness in a dynamic, frame-based approach involving the following three stages.
First the raw audio data is preprocessed with an auditory model to obtain a perceptually relevant representation (cochleagram). To reduce the amount of data the signal is subsequently divided into short frames, each of which is represented by a feature vector.
Second a self-organizing map (SOM) is employed to perform a topology-preserving mapping of the feature vectors onto a two-dimensional array of units. The SOM assigns a best-matching unit to each input vector, so that a sound signal corresponds to a sequence of best-matching units.
Finally a pattern matching algorithm is applied to search the entire source for sequences ‘similar’ to a selected pattern. For the time being we refer to the SOM units simply by different symbols (e.g. their index numbers), disregarding the associated weight vectors and topological relations, and perform an approximate string matching on the resulting sequences.
2 System architecture
2.1 Auditory model
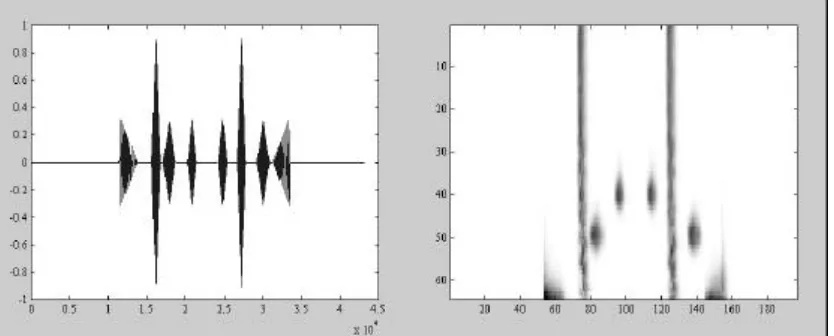
Figure 1. Waveform and cochleagram representation of a sound sample consisting of short tone and noise bursts. The cochleagram was produced by the AF/IHC model. The 44,000 samples of the waveform representation are reduced to 200 frames in the cochleagram.
We carried out a number experiments to investigate the suitability of different auditory representations within the framework of our system. The corresponding models are briefly described in the following sections.
2.1.1 Auditory filterbank and inner hair cell model (AF/IHC)
This model combines an auditory filterbank (Patterson 1992, Slaney 1993) with an inner hair cell model (Meddis 1986). The filterbank converts the audio data into a sixty-four channel representation of basilar membrane motion, and the inner hair cell model simulates mechanical to neural transduction in each filter channel. Its output represents the instantaneous spike probability in an auditory nerve fibre, showing features such as adaptation (initial increase of the spike rate after the onset of a stimulus), masking, and phase locking to low frequency periodic stimuli.
2.1.2 Lyon’s cochlear model
Lyon’s passive cochlear model (Lyon 1982, Slaney 1988) is functionally similar to the above model, but is based on different signal processing techniques. It comprises a preemphasis filter to simulate the frequency response of the middle and outer ear, a broadly tuned cascade of ninety-six lowpass filters to model the basilar membrane response, half wave rectifiers to implement the detection nonlinearity of the inner hair cells, and automatic gain control to simulate adaptation and masking.
2.1.3 Mel-frequency cepstral coefficients (MFCC)
Mel-frequency cepstral coefficients, introduced by Davis and Mermelstein (1980), constitute a parametric sound representation widely used in automatic speech recognition systems. MFCC have also been applied to timbre analysis (Cosi, De Poli and Prandoni 1994) and music representation (Logan 2000). To obtain the coefficients the signal is passed through a mel-spaced filterbank1, converted to a logarithmic scale, and then submitted to a cosine
1Mel
transform. MFCC provide a substantial data reduction, because a dozen coefficients often suffice to characterize the acoustic signal.
2.2 Self-organizing map
Self-organizing maps constitute a particular class of artificial neural networks, which is inspired by brain maps forming reduced representations of relevant facts (e.g. the tonotopic map of pitch in the auditory cortex). The SOM was developed and formalized by Kohonen (Kohonen 1982), and has meanwhile been utilized in a wide range of fields (cf. Kohonen 2000). Applications include visualization and clustering of multidimensional data as well as statistical pattern recognition.
A self-organizing map can be imagined as a latticed array of neurons, each of which is associated with a multidimensional weight vector. The weight vectors must have the same number of components as the input vectors to enable a mapping of the input data onto the lattice. Self-organization takes place during the training phase, where the preprocessed data is repeatedly presented to the network. For each input vector, a best-matching unit is determined and its weight vector adjusted towards the input vector. By adapting not only the best-matching unit, but also its neighbours, the network ‘learns’ the global topology of the input data and forms a set of ordered discrete reference vectors. These reference vectors can be regarded as a reduced representation of the original data.
To enable an efficient pattern matching process in the third stage of the system we represent the vectors by their index numbers only and disregard their mutual relations except for the binary distinction between ‘equal’ and ‘different’. This reduces the self-organizing map to a vector quantization device. A sound sample then corresponds to a string of symbols, which can be further processed with efficient string matching techniques.
2.3 String matching
Researchers working in the recent field of music information retrieval discovered that string searching algorithms usually applied to text retrieval or molecular sequence matching can also be employed to detect musical similarity or retrieve melodies from a database (Crawford, Iliopoulos and Raman 1998, Lemström 2000). A crucial prerequisite is a suitable encoding of the music, which yields the searchable representation (Selfridge-Field 1998).
The task of the string matching module in our system is to find similar occurences of a selected pattern in a long string of symbols. In computer science terminology this is referred to as k-difference inexact matching – the problem of inexactly matching a pattern to a text with the number of differences being at most k (Gusfield 1997). A number of algorithms that tackle this problem have been described by Ukkonen (1985) and Stephen (1994).
3 Preliminary experiments
procedures and results can be found in previous publications (Spevak and Polfreman 2000, Spevak, Polfreman and Loomes 2001).
3.1 Methodology 3.1.1 Overview
A neural network experiment usually requires two main processes: training and simulation. In this case the training phase involved the preprocessing of the complete sound set with one of the auditory models and the decimation to a lower frame rate (100 Hz), the initialization and training of a SOM, and finally a quality and cluster analysis. The simulation phase served to determine the trajectory of a particular sound by tracing the corresponding sequence of best-matching units and producing a suitable visualization.
3.1.2 Tools
The experiments were carried out in Matlab, an integrated environment for numeric computation, visualization and programming. The simulation of auditory models and neural networks was facilitated by the use of specialized ‘toolboxes’ in addition to the main program, in particular the Auditory Toolbox (Slaney 1998) and the SOM Toolbox for Matlab 5 (Vesanto, Himberg, Alhoniemi and Parhankangas 2000).
3.1.3 Sound set
The set of test sounds comprised twenty-three monophonic synthesized signals of two seconds duration, sampled at 22.05 kHz. Each sample consisted of a one second sound event framed by half a second of silence. The set included white and band-limited noise, steady sine, triangle and square wave signals at various frequencies, a sine pitch sweep, sine octaves, sine and square waves with increasing and decreasing amplitude respectively, and a sample of quickly alternating tone and noise bursts.
3.1.4 Visualizations
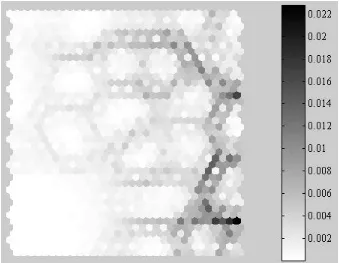
We produced different kinds of visualizations to analyze the structure of the self-organized network and the mapping of the sounds. The unified distance matrix (U-matrix), a graphical representation of the vector space distances between adjacent map units, was used to visually inspect the SOM and analyze its cluster structure once the training was completed (Figure 2).
Figure 2. U-matrix of a SOM comprising twenty units by seventeen after training it with the test sounds preprocessed by the AF/IHC model. Different shades of grey represent the weight space distances between adjacent units on the lattice; cluster borders are indicated by darker colours.
Figure 3. Still frame from a film visualizing the trajectory produced by a sequence of quickly alternating tone and noise bursts, preprocessed with Lyon's cochlear model, on a seven by twelve SOM.
3.2 Results
3.2.1 Auditory models
[image:6.595.92.319.399.594.2]lowpass filtering in the data reduction stage. The MFCC trajectories reacted immediatedly to changes in the sound signal and tended to oscillate between two or more units even for perceptually steady sounds.
MFCC proved to be the computationally most efficient representation, while the AF/IHC model produced the most convincing results on the SOM: perceptually different sounds were mapped to distinct units, and tones sharing the same pitch (e.g. sine, triangle and square wave with common fundamental frequency) were grouped into local clusters. Sound intensity played only a minor role. In the MFCC representation it was even deliberately excluded by discarding coefficient C0 because of its disproportionately large variability.
3.2.2 Self-organizing maps
We evaluated the performance of different self-organizing maps – varying in size, dimensionality, type of lattice, and shape – in combination with the AF/IHC model. The experiments showed that larger SOMs (relative size with respect to the amount of training data) develop a distinct cluster structure, where groups of adjacent neurons have very similar weight vectors (see Figure 2). This is not desirable within the framework of our system, because the string matching algorithm does not distinguish between very similar units within a cluster and distinctly different units in separate clusters. However, if the size of the network is reduced, the clusters decrease as well – eventually to single units. The optimal size has to be determined empirically with respect to the amount and variability of the data.
The investigation of dimensionality, lattice and shape suggested that for our sound data a two-dimensional SOM based on a hexagonal, sheet-shaped (as opposed to cylindric or toroidal) lattice would be the preferable solution. The different sounds were clearly separated on the map and grouped according to their pitch (if applicable). However, even with the ‘optimal’ SOM the global organization of the sounds on the map was far from perfect when compared to our perception: pairs of sounds having the same distance, but different locations on the map could be either very similar or entirely different, depending on the respective cluster structure.
A self-organizing map can be a powerful visualization tool, but it seems to be less suitable to actually quantify ‘similarity’. Because of the inhomogeneous distribution of weight vectors the distance between best-matching units on the map does not constitute a valid distance measure for the corresponding sounds, which is why we decided not to make use of the topological organization of the SOM in the last stage of our system.
4 Discussion
quantization tool and regard the reference vectors as an abstract symbolic representation of the sound data, which can then be subjected to efficient string searching techniques.
The question whether such a system will be able to retrieve perceptually valid matches remains unanswered yet. After implementing the string matching stage we will address that issue by comparing the system’s performance with similarity ratings from human listeners. The vague definition of ‘sound similarity’ clearly introduces an element of uncertainty, because different listeners will presumably pay attention to different kinds of similarity. A possible way out of this dilemma would be a more analytic approach, in which the preprocessing extracts a set of well-defined sound features (such as sound level, spectral centroid and periodicity) that can be related to particular perceptual dimensions (loudness, brightness and pitch). Important contributions in that direction have been made e.g. by Wold, Blum, Keislar and Wheaton (1999) and McAdams and colleagues (McAdams, Winsberg, Donnadieu, De Soete and Krimphoff 1995, Peeters, McAdams and Herrera 2000).
5 References
Cosi, P., De Poli, G. and Lauzzana, G. 1994. Auditory modelling and self-organizing neural networks for timbre classification. Journal of New Music Research 23: 71-98.
Cosi, P., De Poli, G. and Prandoni, P. 1994. Timbre characterization with mel-cepstrum and neural nets. Proceedings of the International Computer Music Conference, pp. 42-5.
Crawford, T., Iliopoulos, C. S. and Raman, R. 1998. String-matching techniques for musical similarity and melodic recognition. In W. B. Hewlett and E. Selfridge-Field (eds.) Melodic Similarity: Concepts, Procedures, and Applications, pp. 73-100. MIT Press.
De Poli, G. and Prandoni, P. 1997. Sonological models for timbre characterization. Journal of New Music Research 26: 170-97.
Feiten, B. and Günzel, S. 1994. Automatic indexing of a sound database using self-organizing neural nets. Computer Music Journal 18: 53-65.
Greenberg, S. and Slaney, M. (eds.) 2001. Computational Models of Auditory Function. Amsterdam: IOS Press.
Gusfield, D. 1997. Algorithms on Strings, Trees, and Sequences: Computer Science and Computational Biology. Cambridge University Press.
Hawkins, H. L., McMullen, T. A., Popper, A. N. and Fay, R. R. (eds.) 1996. Auditory Computation. Springer.
Kohonen, T. 1982. Self-organized formation of topologically correct feature maps. Biological Cybernetics 43: 59-69.
Kohonen, T. 2000. Self-Organizing Maps. Third edition. Springer.
Lemström, K. 2000. String Matching Techniques for Music Retrieval. Report A-2000-4. University of Helsinki.
Logan, B. 2000. Mel frequency cepstral coefficients for music modelling. Proceedings of the International Symposium on Music Information Retrieval (Music IR 2000).
Lyon, R. 1982. A computational model of filtering, detection and compression in the cochlea. In Proceedings of the IEEE International Conference on Acoustics, Speech, and Signal Processing.
McAdams, S., Winsberg, S., Donnadieu, S., De Soete, G. and Krimphoff, J. 1995. Perceptual scaling of synthesized musical timbres : common
dimensions, specificities, and latent subject classes. Psychological Research 58: 177-92.
Meddis, R. 1986. Simulation of mechanical to neural transduction in the auditory receptor. Journal of the Acoustical Society of America 79: 702-11.
Patterson, R., Robinson, K., Holdsworth, J., McKeown, D., Zhang, C. and Allerhand, M. 1992. Complex sounds and auditory images. In Y. Cazals, L. Demany and K. Horner (eds.) Auditory Physiology and Perception, pp. 429-45. Oxford: Pergamon Press.
Peeters, G., McAdams, S. and Herrera, P. 2000. Instrument sound description in the context of MPEG-7. Proceedings of the International Computer Music Conference, 166-9.
Selfridge-Field, E. 1998. Conceptual and representational issues in melodic comparison. In W. B. Hewlett and E. Selfridge-Field (eds.) Melodic Similarity: Concepts, Procedures, and Applications, pp. 3-64. MIT Press.
Slaney, M. 1988. Lyon’s cochlear model. Apple Computer Technical Report 13.
Slaney, M. 1993. An efficient implementation of the Patterson-Holdsworth auditory filter bank. Apple Computer Technical Report 35.
Spevak, C. and Polfreman, R. 2000. Analyzing auditory representations for sound classification with self-organizing neural networks. Proceedings of the COST G-6 Conference on Digital Audio Effects (DAFx-00), pp. 119-24.
Spevak, C., Polfreman, R. and Loomes, M. 2001. Towards detection of perceptually similar sounds: investigating self-organizing maps. Proceedings of the AISB'01 Symposium on Artificial Intelligence and Creativity in Arts and Science, pp. 45-50.
Stephen, G. A. 1994. String Searching Algorithms. Singapore: World Scientific.
Toiviainen, P. 1996. Optimizing auditory images and distance metrics for self-organizing timbre maps. Journal of New Music Research 25(1): 1-30.
Toiviainen, P. 1997. Optimizing self-organizing timbre maps: two approaches. In M. Leman (ed.) Music, Gestalt, and Computing. Studies in Cognitive and Systematic Musicology, pp. 337-50. Springer.
Toiviainen, P. 2000. Symbolic AI versus connectionism in music research. In E. R. Miranda (ed.) Readings in Music and Artificial Intelligence, pp. 47-67. Amsterdam: Harwood Academic Publishers.
Toiviainen, P., Tervaniemi, M., Louhivuori, J., Saher, M., Huotilainen, M. and Näätänen, R. 1998. Timbre similarity: convergence of neural, behavioral, and computational approaches. Music Perception 16: 223-42.
Ukkonen, E. 1985. Algorithms for approximate string matching. Information and Control 64: 100-118.
Vesanto, J., Himberg, J., Alhoniemi, E. and Parhankangas, J. 2000. SOM Toolbox for Matlab 5. Technical Report A57. Helsinki University of
Technology.
Warren, R. M. 1999. Auditory Perception: A New Analysis and Synthesis. Cambridge University Press.