In the past decades production networks have become larger and more complex, which led to an increasing number of planning objects that need to be integrated into the network planning scope. At the same time production networks must be adapted in ever shorter cycles and to a larger extent than in the past. The configuration of its production network, therefore, has become a major challenge for companies. In this context, conventional configuration approaches with spreadsheet programs reach their limits. In the present article both an IT tool called OptiWo and a specified process to configure production networks is presented. The pursued aim of the tool and the process is to make the increased complexity manageable by increasing the use of IT tools.
Global production, IT tool, network configuration, optimisation, production network
I. INTRODUCTIONANDMOTIVATION
HE size and complexity of production networks of globally operating companies has increased significantly in the past [1]. In addition to high cost pressure and the demand for short delivery times, meeting individual customer requirements is a main reason for the internationalization of production. Correspondingly, the Fraunhofer Institute for Systems and Innovation Research ISI found out in a study that the savings in personnel costs, exploring of markets and proximity to the customer are the main motives for relocation of companies [2].
Not only the size and complexity of the networks themselves, but also the task of configuring such networks has increased in complexity [3]. The choice of location, allocation of products and resources and the organization of the internal delivery system between locations are tasks included in the configuration of global production networks [4]. Considering the number of design dimensions and their potential characteristics in this context, it does not seem possible to control the resulting complexity with conventional approaches for planning production networks. Usually different scenarios, based on strategic guidelines, for the network are prepared and then evaluated with regard to their costs [5][6]. This method does not allow considering a lot of different scenarios carefully. Neither by using
Manuscript received December 19, 2014; revised January 10, 2015. This work was supported in part by the German Research Foundation, DFG within the research and development project "Cluster of Excellence - Integrative Production Technology for High Wage Countries”.
C. Reuter is with Laboratory of Machine Tools and Production Engineering (WZL), Aachen, Germany.
C. Hausberg. is with Laboratory of Machine Tools and Production Engineering (WZL), Aachen, Germany (phone: +49 (0) 241 80 27388; e-mail: [email protected]).
spreadsheets nor simulations companies are able to control the complexity of the problem [5].
II. STATE OF THE ART - APPROACHES FOR GLOBAL PRODUCTION NETWORK DESIGN
For the description of the planning and configuration process of production networks various approaches exist. In the following an already from Schuh et al. published research is presented that shows both existing approaches and existing commercial IT tools for production network design [6]. As a first example for existing approaches the model of Cohen and Lee can be mentioned. They developed a stochastic optimisation supply chain model including several stochastic sub models [7]. These sub models, for example material control, production, stockpile inventory and distribution, are then optimised individually, and are linked together by a heuristic optimisation rule [7]. Later Goetschalckx, Vidal and Dogan complemented their model with transport information. In order to find optimal solutions a standard solver was used [8]. Similarly, Sabri and Beamon engaged themselves in developing a planning model for production, delivery and demand uncertainty [9]. However, none of these approaches involved the production processes in the analysis. Merchiers developed an extensive evaluation model to evaluate production network scenarios.[10] As the possibility of an automated optimisation of the production network is not contained in this model, only fixed-defined scenarios can be evaluated. Justus created a modular simulation model in which the scenarios are developed manually and permanently programmed into the tool. The evaluation is with respect to total landed costs and total landed time [11]. Finally, the recent work of Lanza and Ude is to be acknowledged especially because it evaluates ramp-up behaviour and offers a detailed simulation using a simulation software.[12] Nevertheless there are several drawbacks in these approaches. In most cases the input data need to be entered manually into the tool which leads to an inefficient data transfer. Moreover, some of them can only be used for the evaluation of defined scenarios. An automated reduction of design possibilities is not realizable. Additionally the options of visualizing the results are often limited.
To evaluate production networks, there are many large scale digital tools and software solutions. Some of them, supplemented by their functions, are given below:
• SAP APO (Optimisation of existing plant of a company)
• Axxom - Orion-PI® Value Network Optimization
An IT Driven Approach for Global Production
Network Design
Christina Reuter and Carlo Hausberg
(Green field scenarios and optimisation of network structure)
• PowerChain Network Designer (Multiple criteria, investment planning support)
• ILOG LogicNet Plus XE (Optimisation of supplier and logistics network)
• SCM Strategic Network Design (Calculation of production and transport costs)
• Oracle – Strategic Network Optimisation Workbench (Constraint-based cost optimised network design)
As most of these tools are stand-alone tools, a common data base, which can be used by other tools in the planning process, does not exist and each tool has to be supplied with lots of data. The SAP APO is an example of a tool that has a data base, which includes any number of SAP modules a company uses. Disadvantageous are the costs of the modules and the required hardware which often exceed the financial resources, especially of small and medium companies.
III. GLOBAL PRODUCTION NETWORK DESIGN IN ERA OF
INDUSTRY 4.0
In 2011 the Laboratory for Machine Tools and Production Engineering (WZL) of RWTH Aachen University developed, in cooperation with Siemens AG, the IT tool OptiWo to assist with the configuration and optimization of production networks. The continually evolving tool responds to the complexity of production networks by using a genetic algorithm [5]. By the use of this stochastic search method OptiWo is able to identify an "almost-optimum" for the network structure within a few hours, which can, even in long optimization times, only be marginally improved [5].
A. IT tools for global production network design
The developed software contains three modules. The first module provides valid modeling of the production network. For that, based on the knowledge of company’s internal experts and on master and dynamic data from the planning systems of the user company, a technical model is created, in which a cost model is deposited afterwards.
Contents of the module are:
• Setting of production sites and output markets
• Creation of reference products by the clustering of material numbers
• Creation of reference process chains and reference resources
• Deposit of the cost model (including wage costs, depreciation, area related costs, etc.)
The database used by the software is shown in Figure 1. The data can be structured into six groups: modelled locations, products, process chains for all products, process times for each process step, resources and transportation information. The user can model existing and future production networks by varying the input data. For example an alteration of product groups, process chains or production locations is possible. By these data all technical
[image:2.595.309.537.322.572.2]and monetary information for modelling a production network is given. [13]
Figure 1: Data structure of the technical model of the production network [13]
Next to the technical model of the production network a cost model is necessary for the evaluation of scenarios. As shown in Figure 2 the total footprint costs can be split into fixed and variable cost. Cost types that are taken into account are the following: [6]
• material cost
• direct and indirect staff (labour) cost • logistics cost
• depreciation cost • asset cost
• cost of custom duties • energy cost
• implicit interest cost • maintenance cost • cost for consumables
Figure 2: Structure of the cost model
Per generation a certain number of individuals is formed and evaluated with regard to their costs. The costs correspond to the fitness of the individual: If the costs are lower, the individual is "fitter" and the number of offspring rises. As the progeny results from the depiction of recombination, mutation and selection, the individuals of the next generation base on the network structure of their ancestors. To avoid a local optimization new individuals are incorporated in each generation.
The third module is the evaluation module. It consists of a "Viewer", which offers various interactive visualizations, and a configurator. The configurator enables to make structural adjustments immediately. In addition to adjustments of the resource and product allocation, the input data can be adjusted in the configurator.
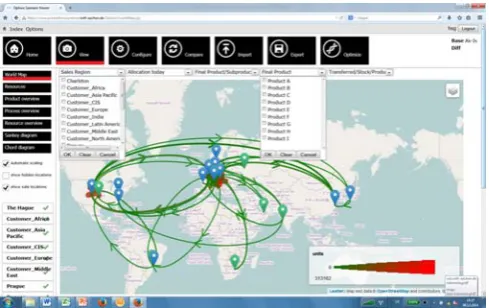
The “Worldmap”, shown in Figure 3, and the “Treemap”, shown in Figure 4, are examples of applications in the viewer. The “Worldmap” shows the internal delivery system between the sites, which is caused by the product and resource allocation. The process pathways of single products or entire product groups can be analyzed easy and fast by using filtering functions.
[image:3.595.304.549.102.255.2]Criteria for the building of a product group that can be filtering options are for example manufacturing steps (showing only the products of the manufacturing, pre-assembly or final pre-assembly) or the respective target market (showing only products for a specific market). Besides the “Worldmap” and the “Treemap” there are analysis for product and resource allocation as well as location sizes and resource utilization. Likewise it is possible to take a look on the delivery times of all products and the cost structure of the locations.
Figure 3: Worldmap to visualise the transport relations in the network
[image:3.595.47.292.455.609.2]The “Treemap” shows the size of each location, including the number of allocated machines, their utilization and area requirements.
Figure 4: Treemap to visualize the number of machines, their utilization and area requirements
When using OptiWo the workflow does not have to be stepped through sequentially. Based on an established model of the network (Module 1) either the model can be optimized in Module 2 and then the results can be seen in the viewer (Module 3) or the actual footprint can be viewed and analyzed directly in Module 3 to specifically investigate the effects of manually introduced configurations.
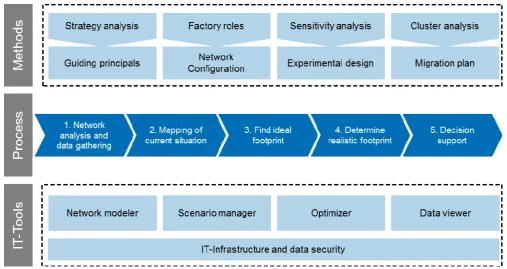
B. Integrated process
For the effective use of a tool for such a complex task it is necessary to embed it in a process. In the following the OptiWo process will be presented. The five main steps of the process are shown in Figure 5.
Figure 5: Integrated process for global production network design
In order to grasp the strategic orientation of the production at first general key questions for the analysis of the network need to be answered. As a result of the questions current plans in the organizational units (e.g. location openings or closings, significant changes regarding the product architecture, planned market entry, etc.) as well as restrictions (fix locations and fix resources, maximum site sizes, etc.) are understood.
Besides answering these key questions location profiles are created for all the considered locations. They deliver information on the performance profile of a location (cost structure, production competence, technological strategy, market proximity, etc.). Moreover, requirements for the products are defined. Possible requirements are, for example, delivery time, quality and cost. The key questions, the location performance profiles and the request lists of the products form the basis for the subsequent scenario development.
In the second step the network is initially shown in its current structure for calibrating the created model. It is necessary to examine whether the cost fields in the data model and those of reality go together. Another reason for showing the actual structure is to create a reference footprint. In this way it is possible to compare different scenarios, so that the profitability of a scenario can be assessed. Furthermore existing potential in the network becomes apparent by analyzing the actual situation, which can be used in the following scenario development.
The third step is the Brownfield optimization of the model. The Brownfield optimization is supposed to optimize the product and resource allocation in the existing location structure. This step shows how the network ideally – without any restrictions- would look like and represents a company-specific validation of global relocation trends. At the same time possible future locations can be a part of the analysis.
Based on the previous steps, in the fourth step realistic scenarios for the network and a target structure are developed. One possibility is the calculation (time, cost, risk, etc.) of specific scenarios (without optimization). A second possibility is the optimization of sub-structures in the network. For this purpose the optimization can, due to removed restrictions, only use the degrees of freedom that the question focuses.
In both cases, the scenarios are based on the strategic guidelines for the product and technology development, the intended role profiles of the locations in the network, the potentials that were identified in the consideration of the actual network and the results of the Brownfield optimization. The annually available budget for the migration of the network also needs to be considered as a key factor influencing the creation of a scenario.
Predicting the development of factors like wage costs, customs duty, transport costs or currency fluctuations in a valid way is, due to the fast changing environment, basically impossible. Therefore the influence of these factors on each of the defined scenarios is investigated by using sensitivity analysis. The resulting large number of different test runs allows identifying structures which are especially advantageous.
The combination of a favorable property profile of the structure (low costs, delivery time, risk, etc.) and the probability of supportive conditions make a structural change particularly advantageous. Finally, a target structure for a certain future date is worked out through a series of iteration loops.
Eventually it is necessary to define the order in which the measures should be implemented.
The result of the process is a roadmap which describes the future development of the locations. Through the development targets of the locations the network strategy is defined at the same time.
IV. VALIDATION
Since 2011 the OptiWo tool has been used in almost 10 projects. These projects have always been carried out in cooperation with an industrial partner. In the following, one selected case is presented, where the OptiWo tool has been used to create an optimal Global Footprint in the year 2020. As the initial situation the production network of the industrial partner, a globally operating manufacturer of industrial automation, interconnection and interface solutions, has developed over time with a focus on the optimization of individual sections of the organization. Therefore, the established structures should be examined critically and the design of the network should be developed more systematically in future.
Key questions in the project were
• Which locations have to grow the most?
• Which investments have to be made in the network over the next few years?
• Which influences do different customs duties, transport costs, exchange rates and costs for raw material have on the total cost of the Global Footprint?
• Are additional production sites economically viable? Within the scope of the project were 9 sites, including 5 sites in Europe, 2 sites in America and 2 sites in Asia. Furthermore 3 additional sites should be evaluated. The project was divided into the phases presented above. After the phases of data gathering and network analysis, mapping the current footprint and a brownfield optimization which led to the ideal footprint, various scenarios were derived to develop a realistic footprint. In one of those scenarios a shorter delivery time for the customers should be realized and the costs for the realization should be evaluated. Furthermore , in order to create realistic scenarios several restrictions were implemented. The most important restriction was the financial limit for investments that are needed for the realization of the necessary adjustments. Therefore, most of the resources get fixed to their actual sites to avoid movement and transportation costs.
With the help of the developed scenarios for all questions mentioned above clear recommendations could be derived. The main results can be summarized as follows:
• For a sales growth of 78%, that should be realized in 2020, a growth of the production area of 65% is required! Identification of clear recommendations at which locations the additional capacity should be built up!
• Within Western Europe and Eastern Europe capacities can be flexibly distributed due to similar cost structures of the sites!
• The opening of new sites was considered as non-economic!
• Transparency and an increased understanding of the relationships and dependencies in the production network could be gained.
V. CONCLUSION
The approach presented in this article has been developed to tap the full potential of the ICT sector for the configuration of production networks. Compared to conventional procedures it offers along with many others three main advantages to the user.
First, the use of intelligent algorithms combined with the power of modern computers provides the possibility to optimize the costs and delivery times of production networks.
Secondly, the IT-based configuration process excels in a very high speed at creating and evaluating scenarios. This is the result of intuitive and interactive visualizations, the maximum transparency of input and output data and the possibility of configuring scenarios online.
The last, superordinate advantage to be mentioned is the use of IT tools with permanently stored structures, algorithms, formulas, visualizations and ratios. The consequence is a standardized and transparent decision-making process that leads to valid results.
ACKNOWLEDGMENT
The IT driven approach for global production network design is being developed by the Laboratory of Machine Tools and Production Engineering (WZL) within the publicly funded research and development project: "Cluster of Excellence - Integrative Production Technology for High Wage Countries” (German Research Foundation, DFG).
REFERENCES
[1] El Maraghy, W.; El Maraghy, H.; Tomiyama, T.; Monostori, L.: Complexity in engineering design and manufacturing; CIRP Annals - Manufacturing Technology, 2012, 61/2:793-814
[2] Zanker, C.; Kinkel, S.; Maloca, S.: Modernisierung der Produktion – Globale Produktion von einer starken Heimatbasis aus; Mitteilungen aus der ISI-Erhebung, 2013, Ausgabe 63, S. 6 und 9.
[3] Schuh, G.; Potente, T.; Varandani, R.; Schmitz, T.: Global Footprint Design based on genetic algorithms - an "Industry 4.0" perspective; CIRP Annals Manufacturing Technology, 2014, S. 433-436
[4] Friedli, T.; Thomas, S.; Mundt, A.: Management Globaler Produktionsnetzwerke, Carl Hanser Verlag, München, 2013, S.50-55 [5] Potente, T.; Varandani, R.; Timm, H. E.: Optimierung von globalen
Produktionsnetzwerken – Trust Data not Intuition!; Complexity Management Journal, 01/2012, S. 10-13
[6] Schuh, G.; Potente, T.; Kupke, D.; Varandani, R.; Hausberg, C.: An evolutionary approach for global production network optimisation, 45th CIRP Conference on Manufacturing Systems 2012, 2012, S. 382-387
[7] Cohen, M. A., Lee, H. L., 1988, Strategic Analysis of Integrated Production-Distribution Systems: Models and Methods. Operations Research, 36, 2, p. 216-228.
[8] Goetschalckx, M., Vidal, C. J., Dogan, K., 2002, Modeling and design of global logistics systems: A review of integrated strategic and tactical models and design algorithms. European Journal of Operational Research 143, 1, p. 1-18
[9] Sabri, E., Beamon, B. M., 2000, A multi-objective approach to simultaneous strategic and operational planning in supply chain design, Omega, 28, 5, p. 581-598
[10] Merchiers, A., 2008, Bewertung globaler Standortstrukturalternativen im Maschinenbau, Apprimus, Aachen
[12] Lanza, G., Ude, J., 2009, Configuration of dynamic value added networks, Proceedings of the Institution of Mechanical Engineers, Part B: Journal of Engineering Manufacture, 223, 5, p. 561-570 [13] Schuh, G.; Potente, T.; Kupke, D.; Varandani, R.: Innovative
![Figure 1: Data structure of the technical model of the production network [13]](https://thumb-us.123doks.com/thumbv2/123dok_us/451572.543127/2.595.309.537.322.572/figure-data-structure-technical-model-production-network.webp)