0133-3720/$20.00 © 2019 Akadémiai Kiadó, Budapest
Inheritance Pattern of Genes for Morpho-physiological and
Yield Traits in Wheat (
Triticum aestivum
L.)
J. Kumar1, A. Kumar2*, M. Kumar3, S.K. Singh1 and L. Singh1 1Department of Genetics and Plant Breeding,
Chandra Shekhar Azad University of Agriculture & Technology, Kanpur-208002 (Uttar Pradesh), India 2Department of Genetics and Plant Breeding,
Govind Ballabh Pant University of Agriculture & Technology, Pantnagar-263145 (Uttarakhand), India 3Department of Botany and Plant Physiology, Mandan Bharti Agriculture College,
Agwanpur, Saharsa-852201 (Bihar), India (Received 30 September 2018; Accepted 11 January 2019;
Communicated by T. Harangozó)
In order to study the inheritance pattern of morpho-physiological traits in bread wheat, a 10×10 diallel cross, excluding reciprocals was made and grown in a randomized complete block design (RCBD) with three replications. Observations were recorded on Days to 75% flowering (DF), Days to maturity (DM), Duration of reproductive phase (DRP), Plant height (cm) (PH), Effective tiller/plant (TLS), No. of spikelets per spike (SLS), No. of grains per spike (GS), Grain weight per spike (g) (GW), Spike length (cm) (SL), Biological yield per plant (g) (BY), Harvest index (%) (HI), 1000-Grain weight (g) (TGW), Spike density (SD), Canopy temperature depression (°C) (CTD), Chlorophyll intensity (%) (CI), Chlorophyll fluorescence (Fv/Fm) (CF), Protein content (%) (PC), Grain yield per plant (g) (GY). Highly significant differences were observed among the genotypes for all traits. The resulted 45 F1s and their F2s used for study the nature of gene for grain yield and its contributing traits in bread wheat. The result indicated that considerable gene action and average degree of dominance respond to achieving significant result for grain yield and its component traits. In both the generations F1s and F2s, grain yield per plant (g) was governed by non-additive gene action based on combining ability analysis, (σ2 g/σ2 s)0.5 [GCA and SCA variance ratio] and
(H1/D)0.5 [Degree of dominance] were exhibited over dominance type average degree of
dominance for grain yield and its component traits in both generations. Genetic analyses of the traits confirm the involvement of both additive and non-additive gene effects in govern-ing the inheritance.
Keywords: wheat (Triticum aestivum L.), gene action, inheritance pattern Introduction
Wheat, commonly known as bread wheat is a self-pollinated hexaploid crop came under the group of allopolyploid (AABBDD). It has a fascinating origin and provides a unique example of how closely related species may be combined into polyploidy in nature. The
evolution of bread wheat occurred by combing the tetraploid species T. turgidum var.
Cereal Research Communications 47, 2019
dicoccoides (AABB) and diploid species A. squarrosa (DD) followed doubling the chro-mosome number. The centre of origin of wheat is Asia Minor. The major wheat producing
area in the country lies between 20°N to 30°N comprising the states of Punjab, Haryana,
Uttar Pradesh, Madhya Pradesh, Bihar, Rajasthan and Maharashtra.
The study of some economic characters showed different pattern of inheritance. The partial dominance with additive gene effects was important for plant height (Khan et al.
1992). Number of tillers per plant was conditioned by partial dominance type of gene
action (Singh et al. 1988). Grain yield in wheat is a polygenic trait and is also influenced by a number of environmental factors including temperature at emergence, grain filling period and grain formation. Sowing time is also most important factor in this respect. Timely sowing allows proper emergence, adequate vegetative growth and sufficient grain filling period which permits sufficient photosynthates to be stored in grains lead-ing to healthy grain formation. The use of chlorophyll fluorescence from intact, attached leaves proved to be a reliable, non-intrusive method for monitoring photosynthetic events and for judging the physiological status of plant (Rizza et al. 2001). Increasing yield is the most important aim in any breeding program, since yield is a complex trait with low inheritance and involves several quantitative components, its direct study is not usually sufficient and therefore it is suggested that its components be investigated in-stead. Awareness of gene action of traits is very important in plant breeding methods and confirms the involvement of both additive and non-additive gene effects in governing the inheritance.
The diallel analysis studies developed by Hayman (1954) and Jinks (1955), provides a fairly reliable mechanism to properly understand the nature of gene action involved in the development of complex genetic characters of economic value. This technique employed to determine the pattern of gene action for yield potential. The diallel cross designs are frequently used in plant breeding research to obtain information about genetic properties of parental lines or estimates of general combining ability (GCA), specific combining ability (SCA) and heritability (El Maghraby et al. 2005; Iqbal et al. 2007).
The concept of combining ability as a measure of gene action refers to the capacity or ability of a genotype to transmit superior performance to its crosses. The value of an in-bred line depends on its ability to produce superior hybrids in combination with other inbreds. Combining ability analysis helps in the evaluation of inbreds in terms of their genetic value and in the selection of suitable parents for hybridization (Singh et al. 1990;
Singh and Narayanan 1993). Genetic analysis of some economic characters show differ -ent pattern of inheritance. Therefore, it is necessary to study the genetic architecture of wheat genotypes in relation to the environment for which they have to be developed. Wheat production can be enhanced through the development of new cultivars having wider genetic base.
Cereal Research Communications 47, 2019
Materials and Methods
Experimental site and plant material
Field experiment was conducted at Crop Research Centre, Chandra Shekhar Azad Uni -versity of Agriculture and Technology, Kanpur (India). The materials in the present
inves-tigation included 45 F1s, 45 F2s and their ten genetically diverse parents. 45 F1s were
developed by using of 10×10 half diallel mating design (excluding reciprocals) during
Rabi 2013–2014 and few seeds of each cross were advanced at ICAR-IIWBR, Regional
Research Station, Dalang Maidan, Lahaul Spiti (India).
Experimental design
The trial was assigned in randomized block design with 3 replications; row length was 4 meter with spacing 22.5 cm for row to row and 5 cm for plant to plant in the experiment. The randomization of cultivars was done with Crop Stat v7.2 software. The each entry was planted two-meter-long, with three rows per plot. The plants were spaced 10 cm each other and rows were spaced 20 cm.
Morphological and yield traits
The data was also recorded on fourteen morphological and yield traits namely; Days to
75% flowering (DF), Days to maturity (DM), Duration of reproductive phase (DRP), Plant height (cm) (PH), Effective tiller/plant (TLR), No. of spikelets per spike (SLS), No.
of grains per spike (GS), Grain weight per spike (g) (GW), Spike length (cm) (SL), Bio-logical yield per plant (g) (BY), Harvest index (%) (HI), 1000-Grain weight (g) (TGW), Spike density (SD) and Grain yield per plant (g) (GY).
Physiological characters
In order to measure physiological traits such as: Canopy Temperature Depression (CTD),
Chlorophyll intensity (CI), Chlorophyll fluorescence (CF). Canopy Temperature Depres
-sion (CTD) reading was taking with the help of Infra-red thermometer. Chlorophyll
inten-sity was recorded with the help of SPAD-502 meter. Chlorophyll fluorescence (CF) was
measured with help of fluorescence measurement system (handy PEA Hansatech Elec-tronics Ltd, UK). All physiological traits were recorded at the time of heading, anthesis, milking, dough and ripening stage.
Biochemical characters
In biochemical trait such as protein content (PC): the protein content of grain was
meas-ured by Automatic Protein analyzer (Near Infrared Reflecto-meter machine) at ICAR-II -WBR, Karnal (India).
Cereal Research Communications 47, 2019 Statistical data analysis
The experimental data were compiled by taking the mean over selected plants of each genotype over the replications. The analysis of data was done using Windostat ver-sion 9.2.
Results
Hayman graphic model provides different statistic to test additivity i.e., absence or pres-ence of epistasis. Based on the test of additivity, regression ‘b’, its standard error (Sb),
regression deviation from zero (b-0) and unity (b-1) as well as t2 values for eighteen
characters are presented in (Table 1). In general, b ˃ 0.5 means absence of epistasis and b < 0.5 means present of epistasis under the study. The regression coefficient (b) deviated from zero were positive and significant for days to 75% flowering (DF), days to maturity (DM) and Chlorophyll fluorescence (Fv/Fm) (CF) in F1 while in F2, it exhibited positive
and significant for days to maturity (DM) and duration of reproductive phase (DRP). The regression coefficient (b) deviated from unity showed positive and significant values for
all characters except spike length (cm) (SL), chlorophyll fluorescence (Fv/Fm) (CF) in both generation whereas, chlorophyll intensity (%) (CI) and grain yield per plant in F2
generation had insignificant values of (1-b)/Sb. Estimates of t2 were positive and
signifi-cant for days to 75% flowering (DF), days to maturity (DM), duration of reproductive
phase (DRP), harvest index (%) (HI), canopy temperature depression (°C) (CTD) and protein content (%) (PC) in both generations, while number of effective tillers per plant (TLR), number of spikelets per spike (SLS), grain weight per spike (g) (GW), spike
length (cm) (SL) and chlorophyll intensity (%) (CI) in F1 and biological yield per plant
(g) (BY) in F2 generation had positive and significant values of t2. The non-significant
values of t2 of the above described traits supported the validity of the diallel assumptions.
After finding of gene interaction based on regression analysis, component of genetic
var-iance i.e., additive, dominance and its allied genetical parameters as second approach to
identify of gene action which control the concerned traits presented Tables in 2a) and 2b).
Variance component analysis can be applied to both F1 and F2 diallel progenies. However,
as F1 is 100 percent heterozygous and F2 carries half heterozygous individuals,
domi-nance contribution reduced half in F2 generations. The analysis of genetic variance
com-ponent expressed significant difference for grain yield and its contributing traits in both
the generation and also showed considerable amount of genetic variance. H1 (dominance
variance) was expressed in both generation for days to 75% flowering (DF), days to ma -turity (DM), number of effective tillers per plant (TLR), number of spikelets per spike (SLS), number of grains per spike (GS), biological yield per plant (g) (BY), harvest index (%) (HI), Canopy temperature depression (°C) (CTD), protein content (%) (PC),
domi-nance gene action predominant to governing the concerns traits. In generations (F1s, and
F2s), duration of reproductive phase (DRP), plant height (g) (PH), spike length (cm) (SL),
spike density (SD), chlorophyll intensity (%) (CI) and chlorophyll fluorescence (Fv/Fm) (CF) had both additive and dominance variance indicating that the characters were con
-Cereal Research Communications 47, 2019 Table 1. Estimates of b, Sb, (b-0)/Sb, (1-b)/Sb and t2 for eighteen characters in F1 and F2 generation of wheat
Characters Genera-tion b Sb (b-0)/Sb (1-b)/Sb t2
Days to 75% flowering (DF) F1 0.227 0.075 3.019* 10.262** 35.955** F2 0.188 0.098 1.920 8.313** 20.659** Days to maturity (DM) F1 0.123 0.098 1.256 8.949** 21.465** F2 0.172 0.035 4.855** 23.328** 183.104** Duration of reproductive phase (DRP) F1 0.086 0.185 0.466 4.953** 3.807** F2 0.291 0.118 2.454* 5.993** 11.513** Plant height (cm) (PH) F1 0.478 0.182 2.631* 2.878* 1.960 F2 0.238 0.236 1.008 3.226* 1.107 Effective tiller/plant (TLS) F1 –0.043 0.156 –0.274 6.700** 6.678** F2 0.152 0.217 0.699 3.902** 1.898
No. of spikelets per spike
(SLS)
F1 –0.080 0.088 –0.909 12.266** 27.983**
F2 0.063 0.240 0.261 3.904** 1.241
No. of grains per spike (GS) F1 0.199 0.169 1.177 4.726** 4.651**
F2 0.205 0.117 1.755 6.801** 13.182**
Grain weight per spike (g) (GW)
F1 0.241 0.200 1.206 3.789** 2.405*
F2 0.183 0.260 0.704 3.141* 0.669
Spike length (cm) (SL) F1 0.776 0.578 1.343 0.387 3.877**
F2 0.817 0.408 2.001 0.449 1.501
Biological yield per plant (g) (BY)
F1 –0.070 0.232 –0.301 4.619** 1.495
F2 0.316 0.168 1.883 4.068** 4.022**
Harvest index (%) (HI) F1 0.103 0.106 0.974 8.444** 17.926**
F2 0.077 0.158 0.486 5.839** 6.308** 1000-Grain weight (g) (TGW) F1 –0.379 0.259 –1.462 5.318** 0.376 F2 0.337 0.239 1.409 2.768* 0.798 Spike density (SD) F1 0.222 0.257 0.863 3.027* 0.675 F2 0.096 0.219 0.440 4.120** 1.909 Canopy Temperature Depression (°C) (CTD) F1 –0.078 0.103 –0.759 10.492** 19.585** F2 0.049 0.171 0..284 5.563** 4.982**
Chlorophyll intensity (%) (CI) F1 0.394 0.172 2.288 3.523** 3.121*
F2 0.543 0.284 1.913 1.607 0.011 Chlorophyll fluorescence (Fv/Fm) (CF) F1 0.752 0.269 2.796* 0.923 0.071 F2 0.592 0.269 2.202 1.521 0.018 Protein content (%) (PC) F1 –0.026 0.095 –0.276 10.783** 23.709** F2 –0.063 0.153 –0.410 6.958** 7.025**
Grain yield per plant (g) (GY) F1 –0.092 0.241 –0.380 4.525** 1.187
F2 0.319 0.504 0.633 1.352 1.263
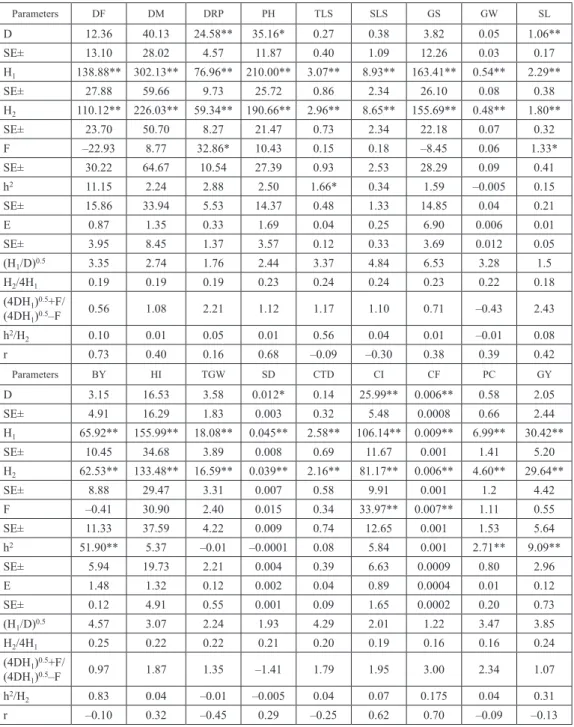
Table 2a. Estimates of D, H1, H2, F, h2 and E components and related statistics for eighteen characters
in 10 × 10 half diallel cross in F1 generation of wheat
Parameters DF DM DRP PH TLS SLS GS GW SL D 12.36 40.13 24.58** 35.16* 0.27 0.38 3.82 0.05 1.06** SE± 13.10 28.02 4.57 11.87 0.40 1.09 12.26 0.03 0.17 H1 138.88** 302.13** 76.96** 210.00** 3.07** 8.93** 163.41** 0.54** 2.29** SE± 27.88 59.66 9.73 25.72 0.86 2.34 26.10 0.08 0.38 H2 110.12** 226.03** 59.34** 190.66** 2.96** 8.65** 155.69** 0.48** 1.80** SE± 23.70 50.70 8.27 21.47 0.73 2.34 22.18 0.07 0.32 F –22.93 8.77 32.86* 10.43 0.15 0.18 –8.45 0.06 1.33* SE± 30.22 64.67 10.54 27.39 0.93 2.53 28.29 0.09 0.41 h2 11.15 2.24 2.88 2.50 1.66* 0.34 1.59 –0.005 0.15 SE± 15.86 33.94 5.53 14.37 0.48 1.33 14.85 0.04 0.21 E 0.87 1.35 0.33 1.69 0.04 0.25 6.90 0.006 0.01 SE± 3.95 8.45 1.37 3.57 0.12 0.33 3.69 0.012 0.05 (H1/D)0.5 3.35 2.74 1.76 2.44 3.37 4.84 6.53 3.28 1.5 H2/4H1 0.19 0.19 0.19 0.23 0.24 0.24 0.23 0.22 0.18 (4DH1)0.5+F/ (4DH1)0.5–F 0.56 1.08 2.21 1.12 1.17 1.10 0.71 –0.43 2.43 h2/H2 0.10 0.01 0.05 0.01 0.56 0.04 0.01 –0.01 0.08 r 0.73 0.40 0.16 0.68 –0.09 –0.30 0.38 0.39 0.42 Parameters BY HI TGW SD CTD CI CF PC GY D 3.15 16.53 3.58 0.012* 0.14 25.99** 0.006** 0.58 2.05 SE± 4.91 16.29 1.83 0.003 0.32 5.48 0.0008 0.66 2.44 H1 65.92** 155.99** 18.08** 0.045** 2.58** 106.14** 0.009** 6.99** 30.42** SE± 10.45 34.68 3.89 0.008 0.69 11.67 0.001 1.41 5.20 H2 62.53** 133.48** 16.59** 0.039** 2.16** 81.17** 0.006** 4.60** 29.64** SE± 8.88 29.47 3.31 0.007 0.58 9.91 0.001 1.2 4.42 F –0.41 30.90 2.40 0.015 0.34 33.97** 0.007** 1.11 0.55 SE± 11.33 37.59 4.22 0.009 0.74 12.65 0.001 1.53 5.64 h2 51.90** 5.37 –0.01 –0.0001 0.08 5.84 0.001 2.71** 9.09** SE± 5.94 19.73 2.21 0.004 0.39 6.63 0.0009 0.80 2.96 E 1.48 1.32 0.12 0.002 0.04 0.89 0.0004 0.01 0.12 SE± 0.12 4.91 0.55 0.001 0.09 1.65 0.0002 0.20 0.73 (H1/D)0.5 4.57 3.07 2.24 1.93 4.29 2.01 1.22 3.47 3.85 H2/4H1 0.25 0.22 0.22 0.21 0.20 0.19 0.16 0.16 0.24 (4DH1)0.5+F/ (4DH1)0.5–F 0.97 1.87 1.35 –1.41 1.79 1.95 3.00 2.34 1.07 h2/H2 0.83 0.04 –0.01 –0.005 0.04 0.07 0.175 0.04 0.31 r –0.10 0.32 –0.45 0.29 –0.25 0.62 0.70 –0.09 –0.13
*Significant at 5% level. **Significant at 1% level. DF = Days to 75% flowering, DM = Days to maturity, DRP = Duration of repro
-ductive phase, PH = Plant height (cm), TLR = Effective tiller/plant, SLS = No. of spikelets per spike, GS = No. of grains per spike, GW = Grain weight per spike (g), SL = Spike length (cm), BY = Biological yield per plant (g), HI = Harvest index (%), TGW = 1000-Grain weight (g), SD = Spike density, CTD = Canopy Temperature Depression (°C), CI = Chlorophyll intensity (%), CF = Chlorophyll fluorescence (Fv/Fm), PC = Protein content (%), GY = Grain yield per plant (g).
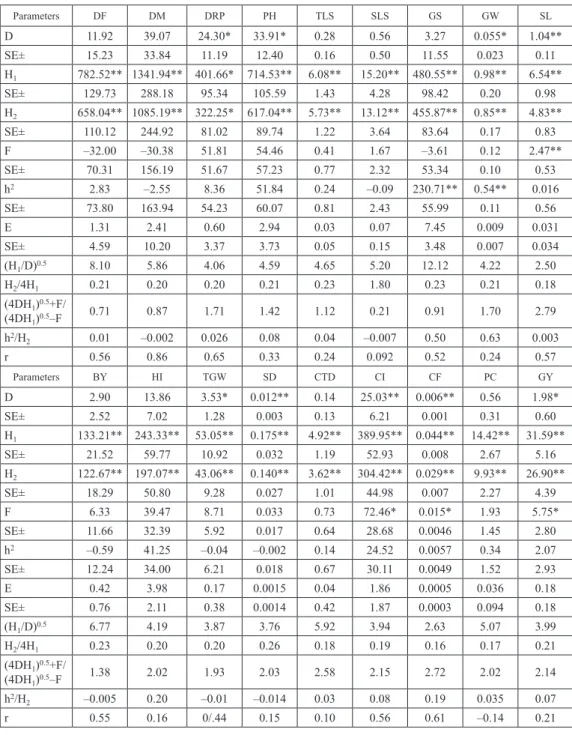
Table 2b. Estimates of D, H1, H2, F, h2 and E components and related statistics for eighteen characters
in 10 × 10 half diallel cross in F2 generation of wheat
Parameters DF DM DRP PH TLS SLS GS GW SL D 11.92 39.07 24.30* 33.91* 0.28 0.56 3.27 0.055* 1.04** SE± 15.23 33.84 11.19 12.40 0.16 0.50 11.55 0.023 0.11 H1 782.52** 1341.94** 401.66* 714.53** 6.08** 15.20** 480.55** 0.98** 6.54** SE± 129.73 288.18 95.34 105.59 1.43 4.28 98.42 0.20 0.98 H2 658.04** 1085.19** 322.25* 617.04** 5.73** 13.12** 455.87** 0.85** 4.83** SE± 110.12 244.92 81.02 89.74 1.22 3.64 83.64 0.17 0.83 F –32.00 –30.38 51.81 54.46 0.41 1.67 –3.61 0.12 2.47** SE± 70.31 156.19 51.67 57.23 0.77 2.32 53.34 0.10 0.53 h2 2.83 –2.55 8.36 51.84 0.24 –0.09 230.71** 0.54** 0.016 SE± 73.80 163.94 54.23 60.07 0.81 2.43 55.99 0.11 0.56 E 1.31 2.41 0.60 2.94 0.03 0.07 7.45 0.009 0.031 SE± 4.59 10.20 3.37 3.73 0.05 0.15 3.48 0.007 0.034 (H1/D)0.5 8.10 5.86 4.06 4.59 4.65 5.20 12.12 4.22 2.50 H2/4H1 0.21 0.20 0.20 0.21 0.23 1.80 0.23 0.21 0.18 (4DH1)0.5+F/ (4DH1)0.5–F 0.71 0.87 1.71 1.42 1.12 0.21 0.91 1.70 2.79 h2/H2 0.01 –0.002 0.026 0.08 0.04 –0.007 0.50 0.63 0.003 r 0.56 0.86 0.65 0.33 0.24 0.092 0.52 0.24 0.57 Parameters BY HI TGW SD CTD CI CF PC GY D 2.90 13.86 3.53* 0.012** 0.14 25.03** 0.006** 0.56 1.98* SE± 2.52 7.02 1.28 0.003 0.13 6.21 0.001 0.31 0.60 H1 133.21** 243.33** 53.05** 0.175** 4.92** 389.95** 0.044** 14.42** 31.59** SE± 21.52 59.77 10.92 0.032 1.19 52.93 0.008 2.67 5.16 H2 122.67** 197.07** 43.06** 0.140** 3.62** 304.42** 0.029** 9.93** 26.90** SE± 18.29 50.80 9.28 0.027 1.01 44.98 0.007 2.27 4.39 F 6.33 39.47 8.71 0.033 0.73 72.46* 0.015* 1.93 5.75* SE± 11.66 32.39 5.92 0.017 0.64 28.68 0.0046 1.45 2.80 h2 –0.59 41.25 –0.04 –0.002 0.14 24.52 0.0057 0.34 2.07 SE± 12.24 34.00 6.21 0.018 0.67 30.11 0.0049 1.52 2.93 E 0.42 3.98 0.17 0.0015 0.04 1.86 0.0005 0.036 0.18 SE± 0.76 2.11 0.38 0.0014 0.42 1.87 0.0003 0.094 0.18 (H1/D)0.5 6.77 4.19 3.87 3.76 5.92 3.94 2.63 5.07 3.99 H2/4H1 0.23 0.20 0.20 0.26 0.18 0.19 0.16 0.17 0.21 (4DH1)0.5+F/ (4DH1)0.5–F 1.38 2.02 1.93 2.03 2.58 2.15 2.72 2.02 2.14 h2/H2 –0.005 0.20 –0.01 –0.014 0.03 0.08 0.19 0.035 0.07 r 0.55 0.16 0/.44 0.15 0.10 0.56 0.61 –0.14 0.21
*Significant at 5% level. **Significant at 1% level. DF = Days to 75% flowering, DM = Days to maturity, DRP = Duration of repro
-ductive phase, PH = Plant height (cm), TLR = Effective tiller/plant, SLS = No. of spikelets per spike, GS = No. of grains per spike, GW = Grain weight per spike (g), SL = Spike length (cm), BY = Biological yield per plant (g), HI = Harvest index (%), TGW = 1000-Grain weight (g), SD = Spike density, CTD = Canopy Temperature Depression (°C), CI = Chlorophyll intensity (%), CF = Chlorophyll fluorescence (Fv/Fm), PC = Protein content (%), GY = Grain yield per plant (g).
Cereal Research Communications 47, 2019
trolled by both types of gene action i.e., additive and dominance. The dominance is also reflected by high degree of dominance effect for number of effective tillers per plant (TLR), biological yield per plant (g) (BY), protein content (%) (PC) and grain yield per
plant (GY) in F1 and number of grains per spike (GS), grain weight per spike (g) (GW) in
F2 generation. The average degree of dominance estimated by (H1/D)0.5 and (σ2g/σ2s)0.5
and both exhibited over dominance effects on grain yield per plant and other components. Most of the proportion of dominant and recessive alleles exhibited by the equation of (4DH1)0.5 + F/(4DH1)0.5 – F. The ratio exhibited the values that the dominant alleles re
-spond to governance of characters while recessive alleles forced the traits as minority level. Proportion of dominant alleles with positive and negative effects in parents exhib-ited a deviation from 0.25 (maximum theoretical value) indicating that all the characters under study in both generations showed symmetrical or asymmetrical distribution of positive and negative alleles in parent for the concern traits.
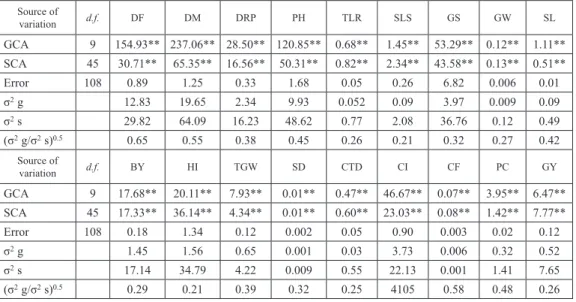
The gene action based on combining ability analysis was presented in Tables 3a and 3b. Analysis of variances of combining ability revealed that the variance due to general combining ability (gca) and specific combining ability (sca) were highly significant for all the characters studied over both generations given in Table 3a and 3b. The value of gca was more than sca with significant indicated that the traits are governed by additive gene action and the value of sca was more than gca with significant indicated that the traits are governed by dominant gene action. Thus the both kind of gene effects pictured important
in controlling the pattern of inheritance of all the characters studied. The (gca/sca)0.5
variance ratio was below unity in both the generations for all the characters indicating the preponderance of additive gene effects present in both the generations for all the charac-ters. Due to differences in the experimental conditions some differences have the reported i.e., grain yield and some others components governed by both additive and non-additive gene effects. Though variance of specific combing ability was most pronounced than variances of general combing ability for all the characters studied. The prepotencial of non-additive genetic variance for different characters indicated that the best cross combi-nations could be selected on the basis on sca Table 4 shows comparative study results of
the gene action and average degree of dominance. Days to 75% flowering (DF), Days to
maturity (DM), duration of reproductive phase (DRP), spike length (cm) (SL), 1000-grain weight (g) (TGW), spike density (SD), chlorophyll intensity (%) (CI) and protein content (%) (PC) showed additive gene effects in both generations whereas, number of spikelets per spike, canopy temperature depression (°C) and grain yield per plant exhibited
non-additive gene effects. In F1 generation, additive gene effect were reported for number of
grains per spike (GS) and biological yield per plant (g) (BY) whereas, non-additive gene effects were reported for number of effective tillers per plant (TLR), grains weight per
spike (g) (GW), harvest index (%) (HI) and chlorophyll fluorescence (Fv/Fm) (CF). In
F2s, additive gene effects were found for number of tillers per plant (TLR), grain weight
per spike (g) (GW), harvest index (HI) and chlorophyll fluorescence (Fv/Fm) (CF) but
non-additive gene effect were reported for number of grains per spike (GS) and biological yield per plant (g) (BY). Additive gene and non-additive gene effect had played a signifi-cant role in inheritance of characters and enhanced the grain yield and its contributing
Cereal Research Communications 47, 2019 Table 3a. Analysis of variance for combining ability in 10 × 10 half diallel cross (parents and their F1s) for eighteen
characters in wheat Source of variation d.f. DF DM DRP PH TLR SLS GS GW SL GCA 9 154.93** 237.06** 28.50** 120.85** 0.68** 1.45** 53.29** 0.12** 1.11** SCA 45 30.71** 65.35** 16.56** 50.31** 0.82** 2.34** 43.58** 0.13** 0.51** Error 108 0.89 1.25 0.33 1.68 0.05 0.26 6.82 0.006 0.01 σ2 g 12.83 19.65 2.34 9.93 0.052 0.09 3.97 0.009 0.09 σ2 s 29.82 64.09 16.23 48.62 0.77 2.08 36.76 0.12 0.49 (σ2 g/σ2 s)0.5 0.65 0.55 0.38 0.45 0.26 0.21 0.32 0.27 0.42 Source of variation d.f. BY HI TGW SD CTD CI CF PC GY GCA 9 17.68** 20.11** 7.93** 0.01** 0.47** 46.67** 0.07** 3.95** 6.47** SCA 45 17.33** 36.14** 4.34** 0.01** 0.60** 23.03** 0.08** 1.42** 7.77** Error 108 0.18 1.34 0.12 0.002 0.05 0.90 0.003 0.02 0.12 σ2 g 1.45 1.56 0.65 0.001 0.03 3.73 0.006 0.32 0.52 σ2 s 17.14 34.79 4.22 0.009 0.55 22.13 0.001 1.41 7.65 (σ2 g/σ2 s)0.5 0.29 0.21 0.39 0.32 0.25 4105 0.58 0.48 0.26
*Significant at 5% level. **Significant at 1% level.
Table 3b. Analysis of variance for combining ability in a 10 × 10 half diallel cross (Parents and their F2s) for eighteen characters in wheat Source of variation d.f. DF DM DRP PH TLR SLS GS GW SL GCA 9 141.49** 290.52** 49.91** 86.39** 0.52** 0.75** 32.36** 0.09** 0.96** SCA 45 44.49** 74.54** 22.19** 42.61** 0.38** 0.90** 34.76** 0.06** 0.35** Error 108 1.31 2.37 0.61 2.98 0.04 0.07 7.33 0.009 0.03 σ2 g 11.68 24.01 4.10 6.95 0.04 0.05 2.08 0.006 0.07 σ22 s 43.17 72.17 21.58 39.63 0.35 0.83 27.42 0.05 0.32 (σ2 g/σ2 s)0.5 0.52 0.57 0.43 0.41 0.34 0.26 0.27 0.33 0.48 Source of variation d.f. BY HI TGW SD CTD CI CF PC GY GCA 9 6.58** 19.01** 5.02** 0.01 0.23** 30.30** 0.007** 1.64** 1.33** SCA 45 8.12** 15.83** 3.00** 0.01 0.28** 22.03** 0.002** 0.73** 1.89** Error 108 0.43 3.85 0.17 0.001 0.05 1.80 0.00005 0.04 0.18 σ2 g 0.51 1.26 0.40 0.001 0.01 2.37 0.0005 0.13 0.09 σ22 s 7.69 11.97 2.82 0.008 0.23 20.22 0.002 0.70 1.71 (σ2 g/σ2 s)0.5 0.25 0.32 0.37 0.36 0.25 0.34 0.51 0.43 0.23
*Significant at 5% level. **Significant at 1% level. DF = Days to 75% flowering, DM = Days to maturity, DRP = Duration of repro
-ductive phase, PH = Plant height (cm), TLR = Effective tiller/plant, SLS = No. of spikelets per spike, GS = No. of grains per spike, GW = Grain weight per spike (g), SL = Spike length (cm), BY = Biological yield per plant (g), HI = Harvest index (%), TGW = 1000-Grain weight (g), SD = Spike density, CTD = Canopy Temperature Depression (°C), CI = Chlorophyll intensity (%), CF = Chlorophyll fluorescence (Fv/Fm), PC = Protein content (%), GY = Grain yield per plant (g).
Cereal Research Communications 47, 2019
Table 4
. Comparative
evaluation
of the results on gene action
and average degree of dominance for eighteen characters in wheat Character Generation
Variance component analysis
Combining ability analysis Average degree of dominance (σ 2 g/σ 2 s) 0.5 (H1 /D) 0.5 Days to 75% flowering (DF) F1 F2 Dominance Dominance Additive gene effect Additive gene effect
Over dominance Over dominance Over dominance Over dominance
Days to maturity (DM) F1 F2 Dominance Dominance Additive gene effect Additive gene effect
Over dominance Over dominance Over dominance Over dominance
Duration of reproductive
phase (DRP)
F1 F2
Additive
/
dominance Additive/ dominance
Additive gene effect Additive gene effect
Over dominance Over dominance Over dominance Over dominance
Plant height
(cm) (PH)
F1 F2 Additive/ dominance Additive/ dominance
Additive gene effect Additive gene effect
Over dominance Over dominance Over dominance Over dominance
Effective tiller/plant (TLS) F1 F2 Dominance Dominance Non-additive gene effect Additive gene effect
Over dominance Over dominance Over dominance Over dominance
No. of spikelets per spike (SLS) F1 F2 Dominance Dominance Non-additive gene effect Non-additive gene effect
Over dominance Over dominance Over dominance Over dominance
No. of grains per spike (GS) F1 F2 Dominance Dominance Additive gene effect Non-additive gene effect
Over dominance Over dominance Over dominance Over dominance
Grain weight per spike (g) (GW)
F1 F2 Additive/ dominance Dominance
Non-additive gene effect Additive gene effect
Over dominance Over dominance Over dominance Over dominance
Spike length (cm) (SL)
F1 F2 Additive/ dominance Additive/ dominance
Additive gene effect Additive gene effect
Over dominance Over dominance Over dominance Over dominance
Biological yield per plant (g) (BY) F1 F2 Dominance Dominance Additive gene effect Non-additive gene effect
Over dominance Over dominance Over dominance Over dominance
Cereal Research Communications 47, 2019
Character
Generation
Variance component analysis
Combining ability analysis Average degree of dominance (σ 2 g/σ 2 s) 0.5 (H1 /D) 0.5
Harvest index (%) (HI)
F1 F2 Dominance Dominance Non-additive gene effect Additive gene effect
Over dominance Over dominance Over dominance Over dominance
1000-Grain weight (g)
TGW)
F1 F2 Additive/ dominance Dominance
Additive gene effect Additive gene effect
Over dominance Over dominance Over dominance Over dominance
Spike density (SD)
F1 F2 Additive/ dominance Additive/ dominance
Additive gene effect Additive gene effect
Over dominance Over dominance Over dominance Over dominance
Canopy Temperature Depression ( 0C) (CTD) F1 F2 Dominance Dominance Non-additive gene effect Non-additive gene effect
Over dominance Over dominance Over dominance Over dominance
Chlorophyll
intensity
(%) (CI)
F1 F2 Additive/ dominance Additive/ dominance
Additive gene effect Additive gene effect
Over dominance Over dominance Over dominance Over dominance
Chlorophyll
fluorescence
(Fv/Fm)
(CF)
F1 F2 Additive/ dominance Additive/ dominance
Non-additive gene effect Additive gene effect
Over dominance Over dominance Over dominance Over dominance
Protein content (%) (PC) F1 F2 Dominance Dominance Additive gene effect Additive gene effect
Over dominance Over dominance Over dominance Over dominance
Grain yield
per plant
(g) (GY)
F1 F2 Additive/ dominance Dominance
Non-additive gene effect Non-additive gene effect
Over dominance Over dominance Over dominance Over dominance
Cereal Research Communications 47, 2019
traits. The results of the present investigation were exhibited significant role of the selec-tion of wheat hybrids as well as breeding procedure to developing high yielding cultivars in future based on gene action and their inheritance patterns.
Discussion
The results obtained from the present study showed significant genetic variation between the genotypes for morpho-physiological traits. The estimates of additive genetic variance (D) were highly significant for spike length (SL), chlorophyll intensity (CI) and
chloro-phyll fluorescence (CF) in both F1 and F2 generations whereas, plant height (PH) in F1
and F2 and spike density (SD) also exhibited significant in F1 and duration of reproductive
phase (DRP), grain weight per spike (GW), 1000-grain weight (TGW) and grain yield per
plant (GY) in F2 generation which indicating predominance of additive gene action in the
inheritance of these characters. Predominance of additive effects has also reported by (Singh et al. 1990; Vanpariya et al. 2006). Highly significant estimates of dominance
variance (H1) were noted for all the characters in both F1 and F2 generations revealing the
importance of dominant generations also involved in the inheritance of traits. It is evident from above discussion that both additive and dominant genes play important role in the inheritance of these characters. The estimates of dominance variance were higher than the additive variance for most of the characters in both generations. It may be explained in the form of heterozygosity in the first generation along with tightness of linkage. The results of additive and dominance gene effects are in agreement with those of (Prodanovic 1993;
Singh et al. 2014). The significant positive estimates of H2 were observed for all traits in
both F1 and F2 generations. However, the estimates of H1 were higher than their
corre-sponding H2 estimates. It revealed that positive and negative alleles at the loci governing
the characters were not in equal proportion in the parents which is also reported earlier by
(Sharma et al. 1991). Significant and positive values of h2 for biological yield per plant
(BY), protein content (PC), number of effective tillers per plant (TLR) and grain yield per
plant (GY) in F1 generation and for number of grains per spike (GS) and grain weight per
spike (GW) in F2 generation indicates that the heterozygous gene combinations
signifi-cantly contributed to over all dominance in positive direction. Negative and non-signifi
-cant values of h2 for grain weight per spike (GW), 1000-grain weight (TGW) and spike
density (SD) in F1 indicated the contribution of dominant genes arising out of
homozy-gous gene combinations. The estimates of average degree of dominance (H1/D)0.5 with
value more than unity for all characters in both generations indicates the over dominance
for these traits. These findings were agreed by (Prodanovic 1993; Nayeem 1994) for most
of the characters.
Analysis of variance for combining ability reveals highly significant variances in both general and specific combining ability in both the generations for all traits, indicating the importance role of both additive and non-additive gene action in the expression of these traits. Additive genetic variance is the result of additive gene variance whereas non-addi-tive gene variance is made up of dominance and epistatic gene action. The dominance variance declines by half with each advance generation of hybrids or in proportion
reduc-Cereal Research Communications 47, 2019
tion of heterozygosity, so it is un-exploitable in pure lines. The epistatic variance is also
diminishes on selfing, but its additive × additive remains constant means fixable in all
generations. The estimates of variance for general and specific combining ability indicate a predominant role of additive gene action for all traits in both generations. These differ-ent estimates obtained in both generations grown in same environmdiffer-ent may be attributed
to the restricted sampling in the total variability available in F2 or may be due to linkage.
Robinson et al. (1960) reported that if there was predominance of repulsion phase of link-age results additive genetic variance could increase as the advance generations. Higher estimates of variance for specific combining ability than variance for general combining ability indicate the predominance of non-additive gene action for all traits were found this is also supported by (Singh et al. 2003; Singh et al. 2014) for different traits. The average degree of dominance is also of interest to plant breeders. The degree of dominance has
been measured by (σ2g/σ2s)0.5 in combining ability. This formula use for estimation of
average degree of dominance is based on assumptions that the genes are unidirectional
distributed among the parents and all the increments have the different sign (+/–). All
traits under study presented them partial dominance, which indicated additive gene action controlled these traits in both generations this is also supported by (Singh et al. 2009) for different traits. Ahmad et al. (2016) also confirmed that additive genetic variation was significant and greater than non-additive for plant height, tillers per plant, 1000-grain weight and grain yield per plant signifying the preponderance of additive gene effects. Additive gene action with partial dominance for these traits has also been reported by several workers; Ullah et al. (2010) for plant height, tillers per plant and grain yield;
Gol-parvar et al. (2004) for 1000-grain weight. However, over dominance for these traits have
also been reported by several workers; Ajmal et al. (2011) for plant height; Gurmani et al. (2007) for tillers per plant, 1000-grain weight and for grain yield per plant.
Acknowledgements
The authors would like say thanks to Department of Genetics and Plant Breeding, Chandra Shekhar Azad University of Agriculture and Technology, Kanpur and Director, ICAR-Indian Institute of Wheat and Barley Research, Karnal, for providing financial as-sistance and helps in the estimation of quality parameters for the present investigation.
References
Ahmad, F., Khan, S., Ahmad, S.Q., Khan, H., Khan, A., Muhammad, F. 2011. Genetic analysis of some quan -titative traits in bread wheat across environments. Afr. J. Agric. Res. 6(3):686–692.
Ahmad, I., Mahmood, N., Khaliq, I., Khan, N. 2016. Genetic analysis for five important morphological attrib -utes in wheat (Triticum aestivum L.). J. Anim. P. 26(3):725–730.
Ajmal, S., Khaliq, I., Rehman, A. 2011. Genetic analysis for yield and some yield traits in bread wheat (Triticum aestivum L.). J. Agric. Res. 49:447–454.
Desai, S.A., Lohithaswa, H.C., Hanchinal, R.R., Patie, B.N., Kalappanavar, I.K., Math, K.K. 2005. Combining
ability for quantitative traits in bread wheat (Triticum aestivum L.). Indian J. Genet. 65:311–312.
El-Maghraby, M.A., Moussa, M.E., Hana, N.S., Agrama, H.A. 2005. Combining ability under drought stress
Cereal Research Communications 47, 2019
Golparvar, A.R., Islam, M.H., Darvish, F., Abdolmajid, R., Abdollah, G.P. 2004. Genetic assessment of some
morpho-physiological traits in bread wheat under drought conditions. Agron. Hort. 62:90–95.
Gurmani, R.R., Khan, S.J., Khan, Z.A.S.R., Shakeel, A., Ullah, M. 2007. Genetic evaluation of some yield and yield related traits in wheat. Pakistan J. Agric. Sci. 44:6–11.
Hayman, B.I. 1954. The theory and analysis of diallel crosses. Genetics 39:789–809.
Iqbal, M., Navabi, A., Salmon, D.F., Yang, R.C., Murdoch, B.M., Moore, S.S., Spaner, D. 2007. Genetic analysis of flowering and maturity time in high latitude spring wheat. Euphytica 154:207–218.
Jinks, J.L. 1955. A survey of the genetical basis of heterosis in variety of diallel crosses. Heredity 9:223–238.
Khan, M.Q., Alm, K. Choudhary, M.A. 1992. Diallel cross analysis of some morphological traits in spring
wheat. Pakistan J. Agric. Sci. 37:328–339.
Nayeem, K.A. 1994. Genetic architecture of flowering and maturity in wheat (Triticum aestivum L.). Indian J. Genet.54(1):63–66.
Prodanovic, S. 1993. Genetic values of F1 wheat hybrids obtained in diallel crosses. Review of Research work at the faculty of Agriculture, Belgrade 38(2):25–27.
Rizza, F., Pagani, D., Stanca, A.M., Cattivelli, L. 2001. Use of chlorophyll fluorescence to evaluate the cold
acclimation and freezing tolerance of winter and spring oats. S. Afr. J. Bot. 120:389–396.
Sharma, S.K., Singh, K.P., Singh, I. 1991. Selection response for grain weight in some intermated populations of wheat (Triticum aestivum L.). Proc. Golden Jubilee Symposium: Indian Soc. Genet. Plant Breed. New
Delhi, Abstr. II: pp. 357.
Singh, G., Bhullar, G.S., Gill, K.S. 1988. Inheritance of yield and its components in an intervarietal cross of bread wheat. Crop Improv. 15:200–202.
Singh, M., Srivastava, J.P., Kumar, A. 1990. Effect of water on water potential components in wheat genotypes.
Indian J. Plant Physiol. 33:312–317.
Singh, M.K., Sharma, P.K., Tyagi, B.S., Singh, G. 2014. Combining ability analysis for yield and protein con-tent in bread wheat (Triticum aestivum L.). Indian J. Agric. Sci. 84(3):328–336.
Singh, P., Narayanan, S.S. 1993. Biometrical techniques in plant breeding. First Edn. Kalayani publishers, New
Delhi, India.
Singh, S.P., Singh, R.K., Singh, J., Agarwal, R.K. 1990. Combining ability for yield and some of its important components in induced mutants of bread wheat. Indian J. Genet. 50:167–170.
Ullah, S., Khan, A.S., Raza, A., Sadique, S. 2010. Gene action analysis of yield and yield related traits in spring wheat (Triticum aestivum). Int. J. Agric. Biol. 12:125–128.
Vanpariya, L.G., Chovatia, V.P., Mehta, D.R. 2006. Combining ability studies in bread wheat (Triticum aesti-vum L.). National J. Pl. Improv. 8(2):132–137.