Electrocardiogram Based Neonatal Seizure Detection
Barry R. Greene*
, Student Member, IEEE
, Philip de Chazal
, Member, IEEE
, Geraldine B. Boylan,
Seán Connolly, and Richard B. Reilly
, Member, IEEE
Abstract—A method for the detection of seizures in the new-born using the electrocardiogram (ECG) signal is presented. Using a database of eight recordings, a method was developed for automatically annotating each 1-min epoch as “nonseizure” or “seizure.” The system uses a linear discriminant classifier to process 41 heartbeat timing interval features. Performance assessment of the method showed that on a patient-specific basis an average accuracy of 70.5% was achieved in detecting seizures with associated sensitivity of 62.2% and specificity of 71.8%. On a patient-independent basis the average accuracy was 68.3% with sensitivity of 54.6% and specificity of 77.3%. Shifting the decision threshold for the patient-independent classifier allowed an increase in sensitivity to 78.4% at the expense of decreased specificity (51.6%), leading to increased false detections. The results of our ECG-based method are comparable with those reported for EEG-based neonatal seizure detection systems and offer the benefit of an easier acquisition methodology for seizure detection.
Index Terms—ECG, linear discriminant, neonatal, seizure detection.
I. INTRODUCTION
A
neonatal seizure is defined as a paroxysmal alteration in neurological function [1] and results from an excessive synchronous discharge of neurons. Seizures occur in 6%–13% of low birth weight infants and 1–2 per 1000 infants born at term [2]. Although changes in heartbeat timing have been described during neonatal seizures [1]–[4], they are much neglected in au-tomatic seizure detection research. Clinical evidence suggests that neonates with seizures have poor health outcomes, with morbidity in 50% of survivors, and a high (30%) probability of death [5]. Early detection and treatment of seizures may sig-nificantly improve prognosis, however, early detection can be difficult as neonatal seizures are often unaccompanied by no-ticeable clinical signs, particularly after treatment [6]. As a re-sult, there is a need for an automated system to notify physicians of the presence of seizures in the newborn and to enable timely medical intervention. Neonatal seizure detection algorithms areManuscript received July 19, 2005; revised August 5, 2006. This work was supported in part by the European Commission through the SIMILAR Network of Excellence—Research in Human-Machine Multimodal Interfaces Project FP6—507609.Asterisk indicates corresponding author.
*B. R. Greene is with the School of Electrical, Electronic & Mechanical En-gineering, University College Dublin, Ireland (e-mail: [email protected]). P. de Chazal is with BiancaMed Ltd, Dublin, Ireland (e-mail: philip. [email protected]).
G. B. Boylan is with Department of Paediatrics and Child Health, University College Cork, Cork, Ireland (e-mail: [email protected]).
S. Connolly is with Department of Clinical Neurophysiology, St. Vincent’s University Hospital, Dublin, Ireland (e-mail: [email protected]).
R. B. Reilly is with the School of Electrical, Electronic & Mechan-ical Engineering, University College Dublin, Dublin, Ireland (e-mail: [email protected]).
Digital Object Identifier 10.1109/TBME.2006.890137
primarily based on the electroencephalogram (EEG). There are a number of published neonatal seizure detection methods and we will briefly review four such methods, (those of Gotman [7], Liu [8] and Celka [9]). Faulet al.[10] provided a review and experimental comparison on the same data set of three of these methods. This particular data set was also used in this study and seizures were annotated by the same expert (G. B. Boylan). These results are included to give an unbiased objective com-parison between competing algorithms and to set our results in context. Where possible, we have tried to present and compare results in the same format as that used by Faulet al.Faulet al. define sensitivity as “the percentage of seizure epochs which were classified correctly” and the specificity as the percentage of nonseizure epochs which were classified correctly, where each EEG epoch was 1 min in duration.
The Gotman [7] method is a frequency-based method that assumes the dominant characteristic of neonatal seizures is pe-riodicity and was also the basis of the methods used by Liu [8] and Altenburg [11]. The method uses fast Fourier transform (FFT)-based frequency spectrum analysis to detect periodic discharge. The EEG is divided into 10-s windows, moving in 2.5–s increments. The frequency spectrum of each 10-s epoch is calculated and a number of features, such as the frequency and width of the dominant spectral peak as well as the relative power of that frequency band (the power in the frequency band is com-pared to the power in the same band in the background EEG) are extracted to detect neonatal seizures. Gotmanet al.report a good detection rate or “seizure sensitivity” of 71% with 1.7 false detec-tions/h. Good detection rate (GDR) is defined as the percentage of seizures identified from the EEG data by an expert in neonatal electroencephalography that is correctly identified by the system. These results were based on analysis of a data set containing EEG records from 43 neonatal subjects from three medical centers. The results for the Gotman method were validated in a subsequent paper [12] by analyzing a separate data set containing 281 h of EEG data from 54 patients again in three medical centers. The sensitivity for this set was 69% with an average false detection of 2.3/h. On their data set, Faulet al.report a sensitivity of 62.5% and a specificity of 64.0% for the Gotman method.
The Liu [8] method also relies on periodicity as the dominant characteristic of neonatal seizures in the EEG. The degree of periodicity in the autocorrelation of 30-s epochs of EEG data is scored and used to classify the epoch as seizure or nonseizure. Liuet al.report a sensitivity of 84% for this method and a speci-ficity of 98%. Faul et al.report a sensitivity of 42.9% and a specificity of 90.2% for the Liu method.
The Celka [9] method is a time-domain method employing patient-specific preprocessing. The preprocessing involves esti-mating an autoregressive moving average model of the prere-corded normal EEG. The inverse of this is applied to the signal being analyzed, leaving only seizure components and Gaussian
white noise. A singular value decomposition (SVD)-based algo-rithm is then used to extract seizure features from noise. A sen-sitivity of 93% and a false detection rate (FDR) of 4% were de-scribed for four neonatal subjects. Faulet al.report a sensitivity of 66.1% and a specificity of 56.0% for their modified Celka method, when tested on their data set. In the results reported by Celka, channels known to contain seizures were chosen for pro-cessing. Although this does not bias the results on a per-channel basis, a real-time seizure detection system would require pro-cessing and polling of all channels in parallel, as the spatial lo-cation of the seizure isa prioriunknown.
Hassanpouret al.[13] investigated time-frequency domain (TFD)-based neonatal seizure detection methods. The EEG was segmented into 30-s epochs. An SVD was performed on the TFD representation of each epoch. To discriminate between seizure and nonseizure activities in each EEG epoch using the TFD, this method uses two left and two right singular values (SVs). The left and right SVs correspond to the time-and frequency-domain components of the signal. The features extracted through the histograms of the four SVs are organized into a feature vector and fed into a trained neural network, to classify each feature vector as seizure or nonseizure. Results for eight babies gave an average sensitivity of 92.5% for a FDR of 3.7%. We present a performance comparison for this algorithm against the Gotman, Liu, and Celka neonatal seizure detection algorithms, demonstrating an impressive improvement for this method over the others. The EEG data used for training and testing this algorithm employed a database of 30-s seizure and nonseizure epochs as opposed to including continuous recordings of the duration and quality that would be found in real-world, neonatal intensive care unit (ICU) conditions. The results reported by Liuet al.were for EEG recordings selected for “typicality.”
In our opinion, selection of EEG epochs has the effect of op-timistically biasing results and we believe detection methods should be evaluated over several hours. Short-duration record-ings cannot be considered in the same light as results presented for methods such as Gotman, which use more realistic recording lengths and do not exclude any record regardless of length or quality.
Karayianniset al.[14] report a video-based method for mea-suring motion strength and motor activity in seizing neonates. Motor strength signals are extracted by measuring the area of the body parts that move during the seizure and the relative speed of the motion, using a combination of spatiotemporal sub-band decomposition of video, nonlinear filtering, and segmen-tation. By tracking the infants’ extremities in adjacent frames in a video image, the speed of limb movement can be calcu-lated using the Kanade Lucas Tomasi algorithm. The temporal signals produced by these methods provide the basis for distin-guishing myoclonic from focal-clonic seizures and differenti-ating these types of seizures from normal infant behaviors. This neonatal seizure detection method is the only published method that provides noncontact monitoring. A second important con-tribution of [14] is the distinction made between different types of neonatal seizures. However, clinical manifestations of seizure such as the physical movements detected by this method are, by no means present in all neonatal seizures (in [15] Bye and Flanagan found that 85% of seizures were subclinical) and as
a result this method cannot provide a complete solution to the problem, a limitation acknowledged by Karayianniset al.[16], [17]. Furthermore, many neonates under observation in the ICU are therapeutically paralyzed and so for these cases seizure-de-tection systems based on physical movement are not viable.
Several authors have published on the relationship of changes in the electrocardiogram (ECG) signal with adult epileptic onset and its utility for epileptic seizure detection. Quintet al. [18] studied the changes in the ECG during epileptic seizure onset in adults, and conclude that characteristic changes in mean heart period are frequently, if not always, present upon detection of seizure onset in adult EEG. Zijlmanset al.[19] attempted to rigorously document cardiac behavior during epileptic seizure onset in adults. They found that there was an increase in heart rate of at least 10 beats/min in 73% of seizures (93% of patients) around the point of seizure onset from a point 30 s prior to the moment of clinical or electrographic seizure onset. They did not find any correlation between cardiac abnormality and seizure. These results were for 281 seizures in 81 epileptic patients. The large size of this data set provides weight and statistical signif-icance to the results presented. Keremet al.[20] used the RR interval time series to forecast epileptic seizure in adults. Using successive heart rate timing intervals in an unsupervised fuzzy clustering algorithm they report a prediction sensitivity of 86% for eight epileptic patients.
II. AIM
The issues noted in the literature suggest that an approach to neonatal seizure detection based on signals other than the EEG is warranted. The aim of this study is to detect seizures in the newborn using the ECG signal, taking a supervised statistical pattern classification approach to the problem.
III. DATASET
TABLE I
DATACHARACTERISTICS FOREACH OF THEEIGHTRECORDINGS: NUMBER OF
SEIZUREEVENTS, DURATION OFRECORDING,ANDMEANSEIZUREDURATION
could be mapped to the time domain for the ECG signal. The ECG was considered in 60-s epochs, so each seizure event was rounded to the nearest minute when mapping annotations to the epoch domain. An epoch containing 50% seizure was labeled as a seizure epoch.
IV. METHOD
A. QRS Detection
Detection of the R wave maximum points in each ECG signal was performed using a QRS detection algorithm as described by Benitezet al.[21]. Before filtering, the mean of the ECG was removed from the signal. All ECG signals were filtered with a 20th-order finite impulse response band-pass filter (corner frequencies 8 and 18 Hz) to remove baseline wander, power-line noise, and out of band noise. The Hilbert transform was then taken of the first derivative of the signal to emphasize the R peaks. A moving-window peak search was carried out with an adaptive threshold; a step-back search was then performed to isolate the P peak. Neonatal ECG often manifests elevated P-wave so this was done to ensure robust detection of the R-wave maximum.
Correction for missing and extra QRS points was performed by comparing each RR interval to an estimate of the mean RR interval (defined as the time in seconds between adjacent R wave maximum points). The estimate of the mean RR interval was calculated by median filtering the RR interval time series and taking the mean of the result. Best results for correction were obtained by using a median filter of length 25. Missing QRS points were calculated by taking the ratio of the RR interval to the mean RR interval was then rounded to the nearest integer Z. Z-1 QRS points were then inserted between the current QRS point and the previous point. The interpolating points inserted were set equal to the mean RR interval as described by de Chazal
et al.[22]. Extra QRS points were corrected by comparing the sum of adjacent RR intervals to the robust mean RR interval estimate. If the sum was numerically closer to the mean than the individual interval, then the two intervals were merged to form a single interval.
B. Feature Extraction
A number of ECG window lengths were investigated. The variation of classification accuracy with window length along with the suitability of the window length was used to decide on the window length for the algorithm. As a result of this anal-ysis, the ECG was considered in epochs of 60 s. Features were extracted for each epoch. Sixty-second time windows were con-sidered suitable for the algorithm as the majority of neonatal seizures are found to be 60 s or longer in duration [1]. A se-quence of RR intervals was associated with each 60-s epoch. A large number of RR interval-based features were tested in this study and included: mean RR interval, relative mean RR interval, RR interval standard deviation, the relative mean stan-dard deviation, RR interval coefficient of variation, RR interval power spectral density (PSD), change in RR interval, relative change in the RR interval, and RR interval spectral entropy.
The mean RR interval feature (meanRR) was calculated by taking the mean of the RR interval sequence associated with each 60-s interval. Similarly, the RR interval standard deviation feature (stdRR) was calculated by taking the standard deviation of the RR intervals for each epoch. The coefficient of variation feature (cvRR) is defined as the ratio of the square of the stan-dard deviation to the mean value for each epoch. The change in RR interval feature (delRR) is defined as the mean difference between adjacent RR interval values for each epoch. The relative features were obtained by subtracting the mean of the feature for the four preceding epochs as well as the mean for the four subsequent epochs (meanRR_ratio, stdRR_ratio, delRR_ratio, and cvRR_ratio). It should be noted that the use of such relative features in a real-time system would lead to a 4-min detection delay in any real-time system.
TABLE II
VARIATION INCLASSIFICATIONACCURACY FOR THEPATIENTINDEPENDENT
CLASSIFIER ASWINDOWLENGTH ISVARIED IN THERANGE30–120 s
They describe spectral entropy as a measure of the spectral complexity of the time series. It is calculated using the formula:
(1)
where is the probability density function (PDF) at frequency . The PDF is calculated by normalizing the RR interval PSD with respect to the total spectral power. The spectral entropy was calculated for each 60-s epoch. Spectral entropy lends itself well to an online implementation as it has a low computational requirement.
The ECG-derived respiration signal (EDR) was calculated by calculating the area under the ECG signal at each QRS point, where the area is defined by 40 ms on either side of the QRS point. It was hypothesized that the EDR PSD may provide useful information about the onset of seizure based on earlier inves-tigations by the authors on changes in the respiration rate in neonates during seizure [26]. The EDR PSD was calculated in a similar manner as the RR interval PSD as described above. The EDR PSD contributed 32 features per epoch.
C. Feature Selection
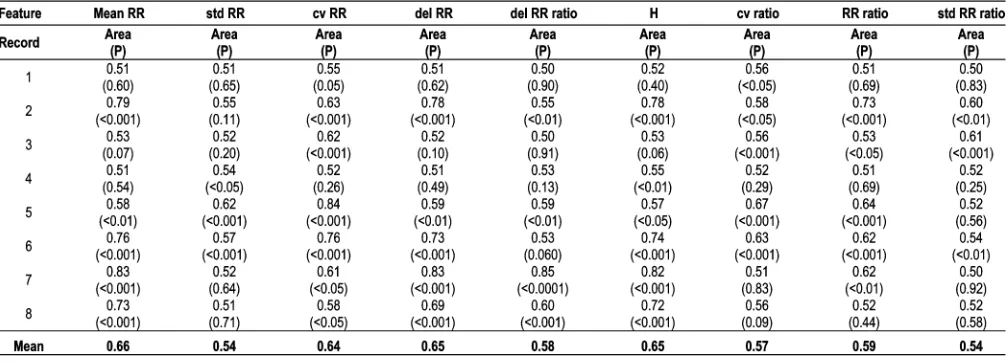
Several different combinations of features were applied to the classifier in order to determine the efficacy of different fea-ture subsets. Receiver operating characteristic (ROC) analysis [27] was performed on individual features to quantify the ability of each feature to discriminate between the seizure and non-seizure classes. The area under the ROC curve (ROC area) was used to select the best performing features. The larger the ROC area, the better the feature will discriminate between seizure and nonseizure epochs. Table II gives the ROC area and rank sum -value for each feature for each record, showing the statistical significances of the discriminability of each feature.
D. Classifier Model
Supervised linear discriminant (LD) classification was em-ployed in this study. An LD classifier finds the linear combina-tion of features that best discriminates among classes. Training of an LD classifier assumes that the classifier parameters can be estimated directly from the data. These parameters were calcu-lated using “plug-in” maximum likelihood estimation, assuming equal covariance matrices, Gaussian class distributions, and dif-ferent mean vectors for each class [28]. If a feature vector is
to be assigned to one of possible classes, a total of fea-ture vectors are available for training and feature vectors are available for training class then
(2)
The th feature vector for training in class is designated as . As a result, the class conditional mean vectors can be calculated using
(3)
The common covariance matrix is then calculated from the training data using
(4)
Feature vectors are then classified by assuming values for the prior probabilities for each class and calculating the discrim-inant value using
(5)
The final class is then that class with the largest discriminant value.
E. Classifier Performance Estimation
The performance of a patient-specific classifier was estimated using tenfold cross-validation on each record. This involves ran-domly splitting each record into ten sections or “folds.” Nine of these folds are used to train the classifier and the remaining fold is used to test the performance of the classifier. By rotating or “shuffling” the data and repeating the above procedure times and averaging the resulting accuracies for the test sets an unbi-ased estimate of the classifier performance can be obtained. In this study, 10 shuffles were used. This test provides an estimate of the performance of the system as a local or “patient-specific” classifier and can give a measure of the utility of this approach to neonatal seizure detection.
The patient-independent classifier performance was also esti-mated using cross-fold validation. This was done by training the classifier model on of the ECG records and using the th record to test the classifier performance and then rotating through the possible combinations of training and test sets, taking the mean of the result for all iterations as the patient-in-dependent classifier performance estimate. This test provides an idea of the classifier’s ability to generalize from the training set and classify from “unseen” records.
F. Classifier Performance Metrics
those used here. Our system is epoch-based so all results are quoted on an epoch basis. The sensitivity is defined as the percentage of labeled 60-s seizure epochs correctly classified as containing seizure while the specificity is defined as the percentage of labeled 60-s nonseizure epochs correctly clas-sified as nonseizure. The overall accuracy is defined as the percentage of 60-s epochs correctly classified by the system. We define a true detection as a seizure event correctly identified by the system. A false detection is a nonseizure epoch falsely identified as a seizure epoch by the system. The FDR is then the percentage of nonseizure epochs falsely identified as seizures epochs and is equivalent to (100-specificity). An ROC curve is a plot of class sensitivity against specificity as a threshold parameter is varied. The area under the ROC curve is equivalent to the Mann Whitney version of the two sample nonparametric Wilcoxon rank-sum statistic [27]. The ROC area, (calculated using trapezoidal numerical integration) is an effective way of comparing the performance of different features or classifiers. A random discrimination will give an area of 0.5 under the curve while perfect discrimination between classes will give unity area under the ROC curve.
G. Improving Classifier Performance
As the eight neonatal ECG records used in this study were of varying lengths, the contribution of each record to the LD clas-sifier training was weighted, so as to ensure each record con-tributed an equal amount. This was achieved by summing the covariance matrices and mean vectors for each record and aver-aging these across all records. As a result the covariance matrix and mean vectors for the weighted LD classifier becomes:
(6)
(7)
where is the number of records available for training, is the weighted covariance matrix and is the weighted mean vector for each class. Weighting of the training data was found to greatly improve the classification accuracy of the cross-record validation scheme. Weighting of the con-tribution of each class to the training data was implemented as described in [29]. The weighting was determined by the relative occurrence of each class in a record.
[image:5.594.301.552.64.258.2]The meanRR, stdRR, delRR, and cvRR patient features all had patient-specific values. Normalization of these features by subtracting the mean of the feature and dividing by the stan-dard deviation for each record was found to improve the classi-fier performance for the patient-independent classiclassi-fier. This pro-vided a record independent feature to be applied to the classifier. The performance of a LD classifier is degraded if the prob-ability distribution of the features is far from Gaussian. As a result performance may be improved by applying transforma-tions to force the distributransforma-tions of the relevant features into taking on a more Gaussian profile. Taking the natural logarithm of the
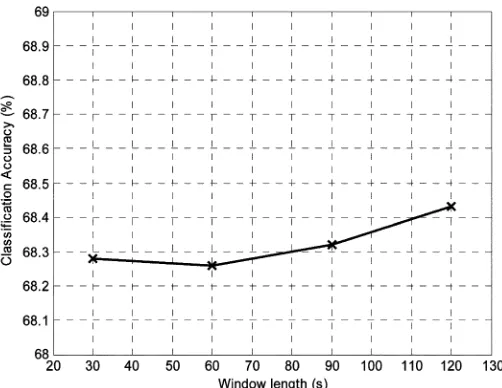
Fig. 1. The variation in classification accuracy for the patient-independent clas-sifier as window length is varied in the range 30–120 s.
PSD features and the spectral entropy yielded an increase in performance.
In any seizure detection system, it can be argued that there is a larger cost associated with incorrectly classifying a seizure epoch as a nonseizure epoch, than incorrectly classifying a non-seizure epoch as a non-seizure epoch. Identifying a nonnon-seizure epoch as a seizure epoch may lead to unnecessary anticonvulsant med-ication which could lead to ventilator dependency and increased morbidity. Consequently, increasing the sensitivity of the clas-sifier to seizure epochs, while decreasing the sensitivity of the system to nonseizure epochs, may be considered an acceptable tradeoff. Previously, the prior probabilities were set equal for the two classes . By biasing the priors in favor of the seizure class an increase in sensitivity was achieved at the expense of decreased specificity. It should be noted using un-equal prior probabilities does not change the parameters of the classifier. It simply allows the user to choose the most suitable operating point for the given population. Increased sensitivity can be achieved but this is always at the expense of increased false detections.
V. RESULTS
In order to determine the optimum ECG window length for the algorithm, a study was carried out to observe the variation in classification accuracy as window length is increased from 30–120 s. Table II shows how the classification accuracy of the patient-independent classifier varied with a number of a number of values of window length.
Varying the window length for this algorithm was not found to have any noticeable effect on the algorithm performance. Fig. 1 is a plot of the variation of ECG classification accuracy as the window length is varied from 30 to 120 s.
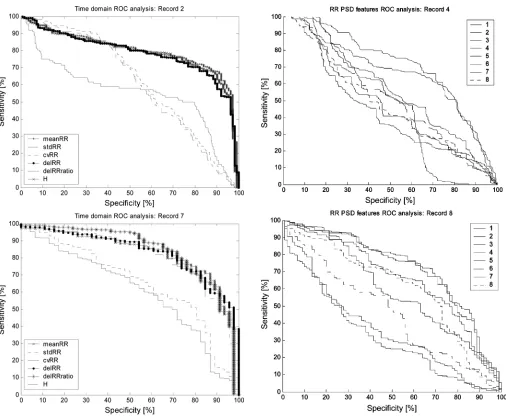
Fig. 2. ROC curves for the RR interval time domain features for the typical records 2 and 7. Visual analysis confirms that meanRR, delRR, and H are the best performing features.
performing better than random chance. The discrimination is said to be better than random chance if the rank-sum -value is less than 0.05. Fig. 2 shows the ROC curves for the time domain RR PSD features for records 2 and 7. Fig. 3 shows the first eight RR interval PSD features for records 4 and 8. The first eight RR PSD features for each record were found by ROC analysis to provide the best class discrimination and are included here for demonstration purposes. The performance metric used to evaluate each feature and select the best performing features was the area under the ROC curve. Table III gives the mean area under the ROC curve as well as -values for the Wilcoxon rank-sum test across all records for the time domain features.
Table IV gives the mean patient-specific results for each record. The mean accuracy of classification was 70.31% with a mean sensitivity of 61.70% and a mean specificity of 71.74%. The use of unequal prior probabilities in favor of seizure led to an increase in sensitivity to 75.52% and a decrease in accuracy and specificity to 66.04% and 57.70%, respectively.
Fig. 3. ROC curves for the RR interval PSD; features 1–8. First eight RR in-terval PSD features for the typical recordings 4 and 8. Visual analysis confirms the relatively poor performance of the RR PSD features when compared to the time domain RR interval features.
A cross-validation estimate of the patient-independent clas-sifier with equal prior probabilities gave an accuracy of 68.3%, a sensitivity of 54.6%, and a specificity of 77.3%. This corre-sponded to a FDR of 22.7%. The best tradeoff was achieved by setting the prior probability for the seizure class,
[image:6.594.304.547.69.469.2]TABLE III
AREAUNDER THEROC CURVES AND THEWILCOXONRANK-SUMp-VALUE FOREACHRECORD,FOR THERR INTERVALTIME-DOMAINFEATURES
TABLE IV
[image:7.594.44.548.95.276.2]PATIENT-SPECIFICCLASSIFICATIONRESULTS FOREQUAL ANDUNEQUALPRIORPROBABILITIES FOREACH OF THEEIGHTRECORDS
Fig. 4. Patient-independent classifier ROC curve.Area = 0:73,p < 0:001. Prior probabilities = 0:5, = 0:5.
of the training data by the relative occurrences of each class did not yield any improvement in performance.
Excluding the RR interval PSD features from the feature vector led to a 4% decrease in the mean patient-specific clas-sification accuracy (66%) and an 8% decrease in specificity (69%). However, the sensitivity was increased by 8% to 69%. In the patient-independent case, exclusion of the RR interval PSD features led to a decrease in performance across the board. Classification accuracy decreased by 1.49%–67.27%, sensitivity by 2%–52.66%, and specificity by 1%–76.10%. This reduction led to the decision to retain the RR interval PSD features in the algorithm. Table V gives the performance for both classifier configurations, for equal and unequal prior probabilities, as well as the results quoted by Faulet al.[10] on the same data set, for the Gotman, Liu and Celka methods.
VI. DISCUSSION ANDCONCLUSION
TABLE V
MEANCLASSIFICATIONPERFORMANCE FORBOTHPATIENT-SPECIFIC ANDPATIENT-INDEPENDENTECG-BASEDCLASSIFIERS
COMPARED TORESULTS FORTHREEEEG-BASEDMETHODS ASREPORTED BYFAULet al.
However, as discussed earlier, the results based on these algo-rithms may be biased. When our results are compared to the independent evaluation of three seizure detection methods by Faulet al.[10], the results presented here offer an improvement on reported EEG-based methods.
Caution must be exercised when comparing source results that have used different performance measures. As discussed earlier our results are reported in the same format and taken from the same data set used by Faulet al., allowing direct com-parison across methods. The results format used in this paper differs from that used in other reports of neonatal seizure al-gorithms [7], [30]. Our results are based entirely on classifica-tion of 60-s seizure and nonseizure ECG epochs. It is arguable that clinically relevant results for a seizure detection algorithm should give some measure of the number of seizure events cor-rectly detected, however, epoch-based results give a fair assess-ment of the performance of an algorithm from an engineering point of view. A similar point can be made about the reporting of false detection results. Previous algorithms have reported false detections in terms of “clusters” of false detections/h [7] rather than an epoch-based false detection/specificity measure as is
used here . Although this
can be a useful measure of clinical utility of the algorithm, it is not always a fair assessment of algorithm performance for the reason that an entire hour of false detections could theoretically be taken as a single false detection for that hour.
With unequal priors, a mean sensitivity of 75.52% for the patient-specific classifier was achieved, this is an improvement over the sensitivities reported in [10] for the Gotman, Liu, and Celka methods (62.5%, 42.9%, and 66.1%, respectively). Simi-larly, a mean specificity of 57.7% for this scheme compares fa-vorably with altered results reported by Faulet al.for Gotman and Celka.
The use of a statistical classifier presents a number of ad-vantages over threshold-based methods such as Gotman, Liu and Celka. The key advantage is that the thresholds values are automatically decided based on the available (real) training data supplied, avoiding using empirically derived thresholds in the classifier decision functions. A rigorous methodology was adopted in this study to ensure robust reliable results. A number of methods were used to verify the performance of this algorithm on the available data set. Cross-fold validation is an
unbiased estimate of classifier performance and was used to get performance estimates for the patient-specific and patient-in-dependent classifiers. The results quoted for this scheme were confirmed by ROC analysis. The patient-specific results were found to be better than the patient-independent results and leave open the possibility of patient-specific, ECG-based neonatal seizure detection systems. Improved feature normalization schemes may allow for improvement in the robustness of the generalized patient-independent classifier.
The influence of bias on performance estimates was lessened further as the training and test data were completely unselected; all records were included in the analysis regardless of duration or quality. This approach was taken with a view to producing re-alistic results using data as would be encountered in a neonatal ICU. However, as a result artifacts were included in the training data which may have led to classification error, further inac-curacies may have been introduced by imperfect detection of QRS points. Further uncorrected errors in the RR interval vector would lead to suboptimal performance.
A variety of time and frequency domain heartbeat timing fea-tures were tested and measures of their ability to discriminate between classes are supplied here (ROC area and Wilcoxon rank-sum test -value, Table II). As there were 32 RR PSD features used for classification of each epoch, there was po-tentially a large amount of redundant information contained in these features, considering the relatively small impact they have on the classification performance. The inclusion of the electro-cardiogram derived respiration (EDR) features did not impact the performance of the classifier. As a result these features were removed from further analysis. The EDR signal is highly sus-ceptible to artifact and noise, and so improved calculation of this quantity may yield improved classification performance. Possible future research directions include the use of other non-linear features to better describe the dynamical changes in the signal during seizure and the use of feature selection. Such ad-vances may allow the deployment of an ECG-based neonatal seizure detection system in a clinical environment.
instances. As a result this may have led to epochs labeled as non-seizure which genuinely contained non-seizure activity being taken as an incorrect classification leading to unfairly high FDR. This point has not been proven although it is certainly arguable that EEG and ECG manifestations do not have simultaneous onset. The ECG in the study was classified using two classes—seizure and nonseizure. By expanding this class list to include the many different electrographic neonatal seizure types [31] including subtle, focal, multifocal, etc., we would hope to improve the classifier performance. This would allow the classifier to take account of the different signal characteristics associated with each seizure type, corresponding to the different physiological responses of the patient to each.
A major advantage of an ECG-based seizure detection method is that the ECG is an inherently easier signal to acquire, with a higher signal to noise ratio to that of EEG and can be recorded on a single channel. The results presented here, present the option of portable, less cumbersome monitoring for neonatal seizures. A second possibility presented by this paper is the combination of EEG and ECG-based neonatal seizure classifiers to improve classification performance.
ACKNOWLEDGMENT
The authors would like to acknowledge the software contri-bution of C. O’Brien in the QRS detection. They would also like to acknowledge the useful technical discussions with E. Lalor. Acquisition of the data analyzed in this study was funded by an interdisciplinary grant from the Health Research Board of Ireland.
REFERENCES
[1] J. J. Volpe, Neurology of the Newborn, 4th ed. Philadelphia, PA.: Saunders, 2001.
[2] J. M. Rennie, “Neonatal seizures,”Eur. J. Pediatr., vol. 156, pp. 83–87, 1997.
[3] E. D. Novotny, “Neonatal seizures,” inOski’s Pediatrics: Principles and Practice, J. A. McMillan, C. D. DeAngelis, R. D. Feigin, and J. B. Warshaw, Eds.. London, U.K.: Lippincott Williams & Wilkins, 1999. [4] K. Watanabe, K. Hara, S. Miyazaki, M. Kuroyanagi, S. Asano, K. Kondo, K. Kuno, H. Jose, and K. Iwase, “Electroclinical studies of seizures in the newborn,”Folia Psychiatr. Neurol. Jpn., vol. 31, pp. 383–392, 1977.
[5] B. R. Tharp, “Neonatal seizures and syndromes,”Epilepsia, vol. 43, pp. 2–10, 2002.
[6] G. B. Boylan, J. M. Rennie, R. M. Pressler, G. Wilson, M. Morton, and C. D. Binnie, “Phenobarbitone, neonatal seizures, and video-EEG,”
Arch. Dis. Child Fetal Neonatal Educ., vol. 86, pp. 165–170, 2002. [7] J. Gotman, D. Flanagan, J. Zhang, B. Rosenblatt, A. Bye, and E. M.
Mizrahi, “Automatic seizure detection in newborns: methods and ini-tial evaluation,”Electroencephalogr. Clin. Neurophysiol., vol. 103, pp. 356–362, 1997.
[8] A. Liu, J. S. Hahn, G. P. Heldt, and R. W. Coen, “Detection of neonatal seizures through computerized EEG analysis,” Electroencephalogr. Clin. Neurophysiol., vol. 82, pp. 30–37, 1992.
[9] P. Celka and P. Colditz, “A computer-aided detection of EEG seizures in infants: a singular-spectrum approach and performance compar-ison,”IEEE Trans. Biomed. Eng., vol. 49, no. 5, pp. 455–462, May 2002.
[10] S. Faul, G. Boylan, S. Connolly, L. Marnane, and G. Lightbody, “An evaluation of automated neonatal seizure detection methods,”Clin. Neurophysiol., vol. 116, pp. 1533–1541, 2005.
[11] J. Altenburg, R. J. Vermeulen, R. L. M. Strijers, W. P. F. Fetter, and C. J. Stam, “Seizure detection in the neonatal EEG with synchronization likelihood,”Clin. Neurophysiol., vol. 114, pp. 50–55, 2003.
[12] J. Gotman, D. Flanagan, B. Rosenblatt, A. Bye, and E. M. Mizrahi, “Evaluation of an automatic seizure detection method for the newborn EEG,”Electroencephalogr. Clin. Neurophysiol., vol. 103, pp. 363–369, 1997.
[13] H. Hassanpour, M. Mesbah, and B. Boashash, “Time-frequency fea-ture extraction of newborn EEG seizure using SVD-based techniques,”
EURASIP J. Appl. Signal Process., vol. 16, pp. 2544–2554, 2004. [14] N. B. Karayiannis, S. Srinivasan, R. Bhattacharya, M. S. Wise, J.
D. Frost, Jr., and E. M. Mizrahi, “Extraction of motion strength and motor activity signals from video recordings of neonatal seizures,”
IEEE. Trans. Med. Imag, vol. 20, no. 9, pp. 965–980, Sep. 2001. [15] A. M. E. Bye and D. Flanagan, “Spatial and temporal characteristics of
neonatal seizures,”Epilepsia, vol. 36, pp. 1009–1016, 1995. [16] N. B. Karayiannis, G. Tao, J. Frost, D. James, M. S. Wise, R. A.
Hrachovy, and E. M. Mizrahi, “Automated detection of videotaped neonatal seizures based on motion segmentation methods,” Clin. Neurophysiol., vol. 117, pp. 1585–1594, 2006.
[17] G. B. Boylan and J. M. Rennie, “Automated neonatal seizure detec-tion,”Clin. Neurophysiol., vol. 117, pp. 1412–1413, 2006.
[18] S. R. Quint, J. A. Messenheimer, M. B. Tennison, and H. T. Nagle, “Assessing autonomic activity from the EKG related to seizure onset detection and localization,” presented at the 2nd Annu. IEEE Symp. Computer-Based Medical Systems, 1989.
[19] M. Zijlmans, D. Flanagan, and J. Gotman, “Heart rate changes and ECG abnormalities during epileptic seizures: prevalence and definition of an objective clinical sign,”Epilepsia, vol. 43, pp. 847–854, 2002. [20] D. H. Kerem and A. B. Geva, “Forecasting epilepsy from the heart rate
signal,”Med. Biol. Eng. Comput., vol. 43, pp. 230–239, 2005. [21] D. Benitez, P. A. Gaydecki, A. Zaidi, and A. P. Fitzpatrick, “The use
of the Hilbert transform in ECG signal analysis,”Comput. Biol. Med., vol. 31, pp. 399–406, 2001.
[22] P. de Chazal, C. Heneghan, E. Sheridan, R. Reilly, P. Nolan, and M. O’Malley, “Automated processing of the single-lead electrocardiogram for the detection of obstructive sleep apnoea,”IEEE Trans. Biomed. Eng., vol. 50, no. 6, pp. 686–696, Jun. 2003.
[23] M. LeVanQuyen, J. Martinerie, V. Navarro, P. Boon, M. D’Have, C. Adam, B. Renault, F. Varela, and M. Baulac, “Anticipation of epileptic seizures from standard EEG recordings,”Lancet, vol. 357, pp. 183–188, 2001.
[24] L. D. Iasemidis, D.-S. Shiau, W. Chaovalitwongse, J. C. Sackellares, P. M. Pardalos, J. C. Principe, P. R. Carney, A. Prasad, B. Veeramani, and K. Tsakalis, “Adaptive epileptic seizure prediction system,”IEEE Trans. Biomed. Eng., vol. 50, no. 5, pp. 616–627, May 2003. [25] R. Acharya, U. A. Kumar, P. S. Bhat, C. M. Lim, S. S. Iyengar, N.
Kannathal, and S. M. Krishnan, “Classification of cardiac abnormal-ities using heart rate signals,”Med. Biol. Eng. Comput., vol. 42, pp. 288–293, 2004.
[26] B. R. Greene, P. de Chazal, G. B. Boylan, R. B. Reilly, C. O’Brien, and S. Connolly, “Heart and respiration rate changes in the neonate during electroencephalographic seizure,”Med. Biol. Eng. Comput., vol. 44, pp. 27–34, 2006.
[27] M. Zweig and G. Campbell, “Receiver-operating characteristic (ROC) plots: a fundamental evaluation tool in clinical medicine,”Clin. Chem., vol. 39, pp. 561–577, 1993.
[28] R. O. Duda, P. E. Hart, and D. G. Stork, Pattern Classification. New York: Wiley Interscience, 2001.
[29] P. de Chazal, M. O’Dwyer, and R. B. Reilly, “Automatic classification of heartbeats using ECG morphology and heartbeat interval features,”
IEEE Trans. Biomed. Eng., vol. 51, no. 7, pp. 1196–1206, Jul. 2004. [30] M. A. Navakatikyan, P. B. Colditz, C. J. Burke, T. E. Inder, J.
Rich-mond, and C. E. Williams, “Seizure detection algorithm for neonates based on wave-sequence analysis,”Clin. Neurophysiol., vol. 117, pp. 1190–1203, 2006.
[31] E. M. Mizrahi and P. Kellaway, “Characterization and classification of neonatal seizures,”Neurology, vol. 37, pp. 1837–1844, 1987.
Philip de Chazal(M’94) received the B.E. degree in electronic engineering and the M.Biomed.E. and Ph.D. degrees in biomedical engineering from Uni-versity of New South Wales, Sydney, Australia, in 1989, 1995, and 1999, respectively.
He is cofounder and currently Chief Technical Of-ficer of BiancaMed, Dublin Ireland, a company pro-viding intelligent computer-based analysis of signals sensed from the human body. Previously he was a Re-search Scientist for the CSIRO, Sydney, a Biomedical Engineer for MedCare Systems, Sydney, and a Re-search Fellow at University College Dublin. His reRe-search interests include signal processing and pattern recognition for biomedical applications and image pro-cessing for multimodal applications.
Dr. de Chazal is a member of the IEEE Engineering in Medicine and Biology Society. He is a reviewer for IEEE TRANSACTIONS ONMULTIMEDIAand IEEE TRANSACTIONS ONBIOMEDICALENGINEERING.
Geraldine B. Boylanreceived the M.Sc. degree in physiology and the Ph.D. degree in clinical medicine from University College London, London, U.K.
She worked as a Clinical Scientist in Neonatal Medicine in Kings College Hospital London from 1996–2001. She is currently a Lecturer in Paediatrics in the Department of Paediatrics & Child health, University College Cork, Cork, Ireland. Her research interests concentrate on accurately diagnosing seizures or “fits” in newborn babies by monitoring electrical brain activity and studies of blood flow regulation during neonatal seizures. Much of her more recent work is of an interdisciplinary nature and aims to create a synergy between medicine and engineering by using the skills and techniques of engineering signal processing research to address important medical problems such as automated seizure detection.
Dr. Boylan was recently awarded a Science Foundation Ireland (SFI) Prin-cipal Investigator Career Advancement Award to develop this aspect of her research.
Seán Connolly received the M.B., M.Ch., and B.A.O. degrees in 1984 from the National University of Ireland, Galway, Ireland. In 1988, He received the MRCPI degree from the Royal College of Physicians of Ireland, Dublin, Ireland, in 1988. He received the M.D. degree from the National University of Ireland in 1994.
He was elected Fellow of the Royal College of Physicians of Ireland in 1998. From 1989 to 1996, he worked and trained in clinical neurophysiology at The Middlesex Hospital, London, U.K., Newcastle General Hospital, Newcastle, U.K., and the Massachusetts General Hospital, Boston, MA. Since July 1996 he has been Consultant in Clinical Neurophys-iology at St Vincent’s University Hospital, Dublin, Ireland. Dr. Connolly is current Dean of the Irish Institute of Clinical Neuroscience and is also a member of the British Society of Clinical Neurophysiology, the Association of British Neurologists, the American Association of Neuromuscular and Electrodiagnostic Medicine, and the American Academy of Neurology.
Richard B. Reilly(M’92-SM’04) received the B.E., M.Eng.Sc., and Ph.D. degrees in 1987, 1989, and 1992, all in electronic engineering, from the National University of Ireland, Dublin, Ireland.
In 1988, he joined Space Technology Ireland and the Department de Recherche Spatiale (CNRS group), Paris, France, developing DSP-based on-board experimentation for the NASA satellite WIND. In 1990, he joined the National Reha-bilitation Hospital, Dublin, and in 1992 became a Post-Doctoral Research Fellow at University College Dublin, Dublin, Ireland, focusing on signal processing for speech and gesture recognition. Since 1996, he has been on the academic staff at the School of Electrical, Electronic and Mechanical Engineering, University College Dublin, where he is currently Associate Professor and researches into neurological signal processing and multimodal signal processing.
Dr. Reilly was the 1999/2001 Silvanus P. Thompson International Lecturer for the Institution of Electrical Engineers (IEE). In 2004, he was awarded a U.S. Fulbright Award for research collaboration into multisensory integration with the Nathan Kline Institute for Psychiatric Research, New York. He is a member of the IEEE Engineering in Medicine and Biology Society and Signal Processing Society. He is the Republic of Ireland representative on the Execu-tive Committee of the IEEE United Kingdom and Republic of Ireland Section. He is an Associate Editor for IEEE TRANSACTIONS ONMULTIMEDIAand also a reviewer for IEEE TRANSACTIONS ONBIOMEDICAL ENGINEERING, IEEE
TRANSACTIONS ON NEURALSYSTEMS AND REHABILITATIONENGINEERING,