Developing Global Pedotransfer Functions to Estimate Available Soil Phosphorus
1
2
Yones Khaledian
1, John N. Quinton
2, Eric C. Brevik
3*, Paulo Pereira
4, Mojtaba
3Zeraatpisheh
54
5
1 – Department of Agronomy, Iowa State University, Ames, IA, USA 6
2 – Lancaster Environment Centre, Lancaster University, Lancaster, UK 7
3 – Department of Natural Sciences, Dickinson State University, Dickinson, ND, USA; 8
9
4 – Environmental Management Center, Mykolas Romeris University, Ateities g. 20, LT-08303 Vilnius, Lithuania 10
5 – Department of Soil Science, College of Agriculture, Isfahan University of Technology, 84156-83111 Isfahan, Iran 11
* - corresponding author 12
13
Abstract 14
There are a large number of investigations that estimate available soil phosphorous (P),
15
but a paucity of global data on available soil P. One significant modern challenge is developing
16
low cost, accurate approaches to predict available soil P that are useful to scientists around the
17
world. We conducted a global meta-analysis using data on available soil P from 738 sites, 640 in
18
the USA and 149 in 14 other countries. Four different methods of determining available soil P,
19
New Zealand (NZ), acid oxalate, Bray and Mehlich 3 were represented in the dataset. Inputs
20
evaluated for inclusion in the pedotransfer functions to predict available soil P were clay (C), fine
21
silt, (FSi) coarse silt (CSi), very fine sand (VFS), fine sand (FS), medium sand (MS), coarse sand (CS),
22
very coarse sand (VCS), organic carbon (OC), pH, calcium (Ca), magnesium (Mg), potassium (K),
iron (Fe), aluminum (Al), and manganese (Mn). Available soil P was estimated for: 1) the entire
24
dataset, 2) only the USA, and 3) the non-USA dataset. The best models to estimate available soil
25
P were obtained for the NZ method (using the co-variates C, FSi, CSi, VFS, MS, CS, OC, Fe, Al, Mn,
26
Ca, Mg, and pH) and for the acid oxalate method (using the co-variates C, FSi, Fe, Al, Mn, Ca, and
27
Mg). Although estimation of available soil P determined with the acid oxalate method was poor
28
for the entire dataset, good estimates were obtained for the USA and non-USA datasets
29
separately. Models for the Bray and Mehlich 3 methods only predicted available soil P well for
30
the non-USA dataset. Using pedotransfer function models to estimate available soil P could
31
provide an efficient and cost effective way to estimate global distributions of a soil property that
32
is important for a number of agricultural and environmental reasons.
33 34
Key Words: Genetic Algorithm; Soil Properties; Simulation; Statistical Models 35
36
1. Introduction 37
Soil phosphorus (P) is essential to living organisms and often a limiting factor for plant
38
growth and biomass production in forests, grasslands, and croplands (Trichet et al., 2009; Smith
39
et al., 2015). It is also a limiting element for algal growth, thus contributing to eutrophication and
40
subsequent effects on ecosystem services associated with freshwater (Carpenter et al., 2008).
41
Soil P is among the most limited nutrients in the soil system because much of it is in forms
42
that are not available to plants. This has resulted in the soil P cycle being strongly affected by
43
human management and land use, especially in agricultural areas where P has been used
44
intensively to fertilize the soils in industrialized agricultural systems to boost the availability of P
to crops (Bryant et al., 2006). The use of P fertilizers has resulted in large soil P surpluses in
46
countries such as China, India, and the United States (West et al., 2014) as well as parts of Europe
47
(Lemercier et al., 2008, Follain et al., 2009), creating a risk of ecosystem contamination.
48
Moreover, P is indispensable in physiological and biochemical processes (Simpson et al., 2011).
49
Hence, the availability of P controls the growth and development of crops (Wyngaard et al.,
50
2016).
51
In soils, P is derived mainly from weathering of the primary mineral apatite (Zhou et al.,
52
2018) and the addition of inorganic and organic fertilizer. Total P content is high in most soils,
53
however, only a small portion (about 13%; Sayers et al., 2008) is available for agricultural plants
54
and microorganisms, because most P is bound strongly in soil particles and incompletely
55
weathered material or is occluded as a secondary mineral. It is estimated that worldwide soil P
56
content (0-50 cm) is 3.6±3 Pg in labile form, 8.6±6 Pg in organic form, 12.2±8 Pg in occluded form,
57
and 3.2±2 Pg in secondary pools (Yang et al., 2013). The average total P in soils ranges from 200
58
mg/kg in older/highly weathered soils to 800 mg/kg in younger/less developed soils (Ijaz et al.,
59
2017); the average amount of organic P in soils ranges between 30% and 65% of the total P
60
(Condron and Tiessen, 2005). The concentration of P in the soil solution is influenced by
61
interactions between physical, chemical and biological processes (Hinsinger, 2013; Messiga et al.,
62
2015). P adsorption and desorption are complex processes that depend on the charge
63
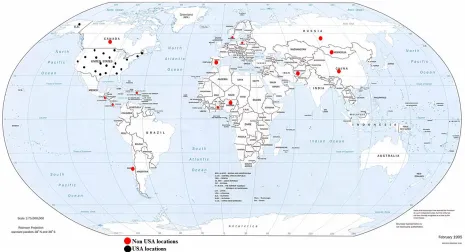
characteristics of the mineral and organic surfaces and the concentration and forms of P in the
64
soil solution (Haygarth et al. 2005). These processes are highly pH dependent, as this alters both
65
the characteristics of the phosphate ions in solution and the charge characteristics of the soil
66
surfaces. In soils with high aluminum (Al) and iron (Fe) oxide contents P may be strongly bound
to mineral surfaces. However, in soils rich in carbonates (CaCO3) both surface reactions between
68
P and precipitation of P-CaCO3 compounds occur (von Wandruszka, 2006) and various
Ca-69
phosphate minerals form (Beauchemin et al., 2003), making the P unavailable to plants (Haygarth
70
et al., 2013).
71
Since P is often a limiting soil factor for plant growth and excess P can have negative
72
impacts on the environment, better ways to estimate soil P levels and spatial distribution would
73
be useful to help scientists and stakeholders manage this important element, especially in
74
developing nations (Borggaard et al., 2004, Krause et al., 2016). This latter point is extremely
75
important because of the lack of resources to conduct frequent and thorough soil
76
characterizations in these areas (Khaledian et al., 2017a, b). One option for estimating available
77
soil P contents is to use pedotransfer functions. These consist of equations or sets of equations
78
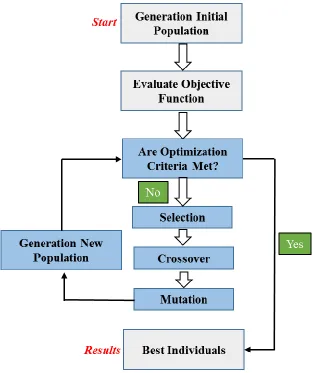
that allow the value of a soil property to be estimated from other properties that can be
79
determined with simpler, faster, more efficient and/or less expensive techniques or that is
80
already available due to previous work. Pedotransfer functions have usually been developed
81
from multiple linear regression (MLR) models. Recently some functions have been developed
82
using genetic algorithms (GA) to optimize the coefficients that may have been utilized in MLR
83
(Hosseini et al., 2016; Khaledian et al., 2017a).
84
There have been previous attempts to develop pedotransfer functions related to available
85
soil P, however, these have been limited in their geographic extent. Kleinman et al. (1999)
86
developed a pedotransfer function to estimate available soil P using 59 soil samples in the USA
87
and achieved R2=0.91 for multivariate pedotransfer functions containing Al, Fe, soil organic
88
matter, and pH as input variables. Likewise, researchers in the UK (Withers et al., 2017, R2 from
0.64-0.87), Brazil (Valadares et al., 2017b, R2 = 0.73 and 0.94), Scandinavia (Mundus et al., 2017,
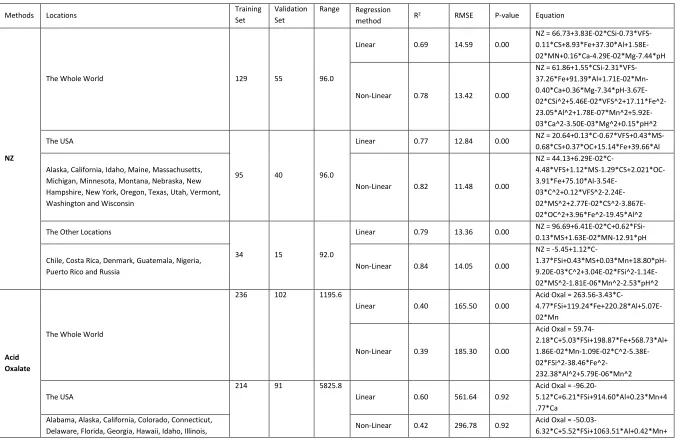
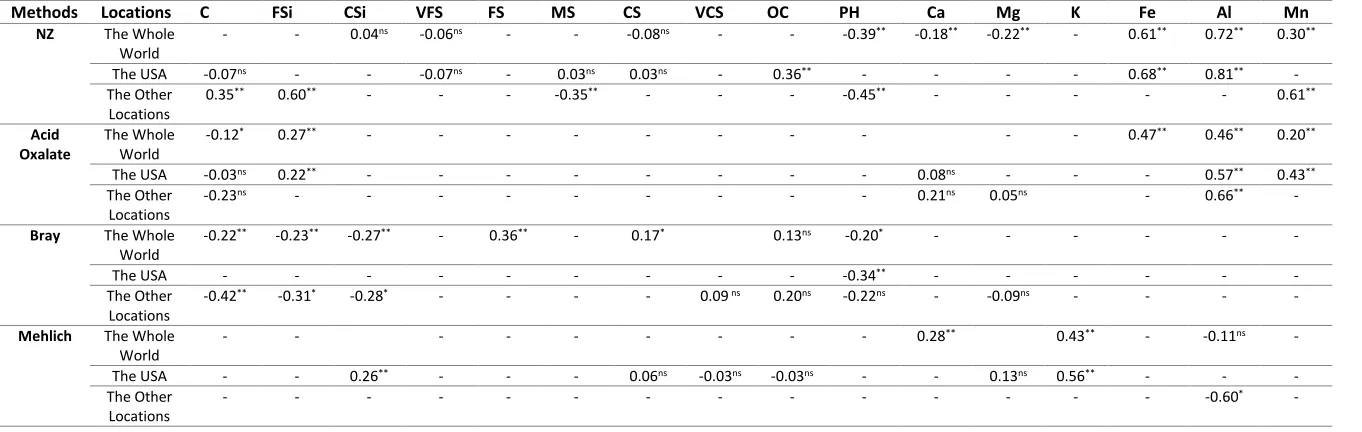
90
R2 ranged from 0.46 to 0.83 using a Mitscherlich equation) and Iran (Seilsepour et al., 2008,
91
R2=0.92; Keshavarzi et al., 2016, R2= 0.61 for training set and R2= 0.50 for testing set; Hosseini et
92
al., 2017, R2 from 0.77-0.91) estimated available soil P based on several soil properties. However,
93
in each of these studies the samples came from a limited geographic distribution and focused on
94
a single available soil P test. Other studies involving pedotransfer functions for P-related issues
95
have focused on soil phosphate adsorption capacity (Borggaard et al., 2004), available phosphate
96
ions (Achat et al., 2011), phosphate adsorption-desorption curves (Peña and Torrent, 1990;
97
Scheinost and Schwertmann, 1995), P mobilization (Borda et al. 2010), or remaining P (Cagliari et
98
al., 2011). With the exception of Borggaard et al. (2004), which included a wide geographic range
99
of samples (Canada, Denmark, Ghana, and Tanzania), these were all local (field scale) or regional
100
(single country or a portion of a country) studies.
101
In this paper we aim 1) to provide the first pedotransfer functions for the global estimation of
102
available soil P, utilising a dataset that consisted of available soil P from world-wide locations and
103
2) to evaluate pedotransfer functions for multiple soil P tests for the global data and national
104
data sets from the global, USA, and non-USA locations.
105 106
2. Materials and Methods 107
2.1. Data Collection 108
We collected data using the USA Natural Resources Conservation Services (NRCS) and
109
National Cooperative Soil Survey (NCSS) database (http://ncsslabdatamart.sc.egov.usda.gov/)
110
targeting the collection of data generated between 2000 and 2014. This process resulted in 738
available soil P samples, 640 in the USA and 149 in other nations; Afghanistan, Canada, Chile,
112
China, Costa Rica, Denmark, Ghana, Guatemala, Mongolia, Nigeria, Poland, Puerto Rico, Russia
113
and Spain (14 countries) (Figure 1).
114
The following information was available for each sampling point: clay (C), fine silt (FSi),
115
coarse silt (CSi), very fine sand (VFS), fine sand (FS), medium sand (MS), coarse sand (CS), very
116
coarse sand (VCS), organic carbon (OC), pH, calcium (Ca), magnesium (Mg), potassium (K), Fe, Al,
117
and manganese (Mn). Soil texture was determined with sieve and pipette (NRCS analysis code
118
3A1a). Soil OC was measured with acid dichromate digestion and FeSO4 titration (analysis code
119
6A1c). Soil pH was determined using a 1:1 water to soil ratio (analysis code 4C1a2a). Fe, Al, and
120
Mn were determined with ammonium oxalate extraction (analysis codes 6C9b, 6G12b, and 6D5b,
121
respectively). Ca, Mg, and K were determined as NH4OAC extractable bases (analysis codes 6N2e,
122
6O2d, and 6Q2b, respectively). Four different approaches for determining available P were
123
investigated, the New Zealand (NZ) (analysis code 6S4), acid oxalate (analysis code 4G2), Bray
124
(analysis code 4D3a1) and Mehlich 3 (analysis code 4D6a1) methods.
125
Prior to data analysis, observations were grouped into categories depending on their
126
location. Owing to the large number of potential variables being evaluated to create the
127
pedotransfer functions, particular attention was given to determining variables that were related
128
to available soil P. Therefore, before obtaining the pedotransfer formula, we omitted the
129
variables that did not have a significant effect on estimation of soil P using a stepwise regression
130
model.
131 132
After selecting the variables that most influenced the prediction of available soil P, we tested
134
the fit of linear (y = ax + c) and nonlinear quadratic regression (y = ax² + bx + c) formulas for 1)
135
the entire dataset, 2) the USA, and 3) the other countries (14 countries). Following that, the
136
formulas were optimized by genetic algorithms, and finally the fitted graphs prepared by test
137
samples. All analysis was performed using XLSTAT publisher (Data Analysis for Microsoft Excel,
138
Addinsoft, Paris, France)
139
Genetic algorithms solve complex optimization issues based on natural genetics; see
140
Holland (1975) for details and Cropper and Comerford (2005) and Johari et al. (2010) for soil
141
science applications. The algorithm used included three basic operators: the selection, crossover
142
and mutation (Cieniawski et al., 1995) (Figure 2). Genetic algorithms are based on the concept of
143
evolution by natural selection as solutions are evolved in a stochastic, iterative manner. The
144
algorithm procedure consists of the following steps (Nelson and Odeh, 2009): 1. Start at initial
145
time (t= 0); 2. Initialize a population of individuals (rules) P(t); 3. Evaluate the fitness of each
146
individual by evaluating how well a rule predicts the distribution using a random subset of
147
observations (training dataset) and save the best individuals in a rule archive; 4. Test against
148
fitness criterion and terminate this rule archive if the criterion is met; otherwise 5. Increase time
149
counter; 6. Create a new set of individuals using the rule archive and random generators; 7. Apply
150
heuristic operators to population; 8. Go back to 3.
151
For all methods and datasets about 70% of the data was randomly selected to train the
152
models and the remaining data (around 30%) was used as a validation dataset. The one exception
153
was the data for the other countries determined with the Mehlich 3 method, which only had 12
154
samples. Therefore, the entire other countries Mehlich 3 dataset was used for full-cross
validation in this one instance. Finally, in order to find the influential variables in different
156
subsets, the correlation (Pearson) of variables was considered. Significant differences were
157
considered at a p<0.05.
158 159
3. Results 160
To find the best regression model(s) to predict soil P by different extraction methods, six
161
regression equations (linear and non-linear equations) were evaluated for all datasets. Table 1
162
gives the values of the fit indictors with the pedotransfer formulas. The NZ method had promising
163
R2 and RMSE values for all evaluated datasets (Table 1); however, a more accurate model was
164
produced for the USA than for the entire dataset and the other locations’ data (Table 1). The
165
formulas for linear regression in Table 1 indicate that when predicting available soil P around the
166
globe, the importance of Al, Fe and Mn should be considered, because higher R2 and RMSE values
167
were achieved when including them. The most influential variables in the nonlinear and linear
168
regression is Al (Table 2). In the USA, Al and Fe played influential roles in estimating available soil
169
P, while including Mn in the regression achieved higher coefficients in the other nations’
170
equations. The R2 values for all nonlinear models in the three datasets (R2=0.78, 0.82 and 0.84
171
for the entire dataset, the USA, and the other nations, respectively) were better than for the
172
linear models, but the linear regression for the USA was also promising (R2= 0.77).
173
The acid oxalate method had higher R2 and lower RMSE values for the linear regressions
174
for the entire dataset and the USA locations, and for both the linear and nonlinear regressions
175
for the other country locations. However, R2 and RMSE values for the non-linear regression were
176
not significant for the USA dataset (Table 1). Al played an important role in predicting available
soil P in almost all the formulas. The importance of Ca, Al and Mn in the entire dataset and Ca,
178
Mg and Al in other parts of the world is clear (Table 1, 2). The nonlinear and linear models
179
(R2=0.62 and 0.85) for other countries and the linear (R2=0.60) and nonlinear (R2=0.42) models
180
for the USA showed promising results, but the entire dataset models did not. Linear regression
181
models estimated available soil P better than the nonlinear regression models for the entire
182
dataset (Table 1). Nevertheless, accuracy indicators (R2 and RMSE, Table 1) showed that the input
183
variables could not adequately predict available soil P using the entire dataset.
184
Results from the Bray and Mehlich 3 methods showed that apart from the USA dataset
185
for the Mehlich 3 method and the other country locations for the Bray method, the R2 and RMSE
186
values for the other regressions were not promising (Table 1, 2).
187
188
4. Discussion 189
Compared to previous work, the study has considered samples from a wide geographic
190
distribution. The fact that available P across a wide range of soil and environmental settings could
191
be predicted using a number of relatively stable soil properties, such as sand, silt, and clay, along
192
with other soil properties that could potentially change over shorter time periods, such as pH,
193
extractable Ca, and total organic carbon provides the opportunity to make rapid regional and
194
global assessments of P availability, something that is of use to both agricultural and
195
environmental planners. Although different methods have been developed to test for available
196
soil P, often because of the different soil conditions and properties that are encountered and
197
different crops that are produced in various parts of the world, relationships with good predictive
ability were developed for both the NZ and acid oxalate available P methods. However,
199
relationships for the Mehlich 3 test were poorer.
200
The pedotransfer functions allowed identification of the key variables controlling P
201
availability for large scale assessments. Except for the Bray method, at least one of Al, Fe, and
202
Mn were used in all the pedotransfer functions to predict available soil P (Table 1), indicating the
203
importance of these variables. Available soil P is known to be closely related to the concentration
204
of Fe and Al (Vincent et al., 2012; Seguel et al., 2015) as Al and Fe oxides are the main phosphate
205
adsorbents in soils (Borggaard, 1990, 2002). Borggaard et al. (2004) found close relationships
206
between amounts of adsorbed phosphate and soil contents of some forms of Al and Fe and
207
created pedotransfer functions for predicting adsorbed phosphate from Al and Fe oxide contents
208
that were quantified by selective extractions. The relationship between available soil P and Fe
209
was weaker in this study than for Al, agreeing with the findings of Karlsson et al. (2008) and
210
Turner et al. (2003).
211
Soil texture is another important factor for predicting available soil P in the pedotransfer
212
functions (Table 1). Texture can substantially affect the chemical characteristics of soil, including
213
the formation of stable P-Al-organic matter bonds and P leaching from soil (Negassa and
214
Leinweber, 2009; Sugihara et al., 2012), which in turn is linked to plant available P. The influence
215
of fine particles such as C, FSi and CSi were important in all pedotransfer functions except those
216
for the Mehlich 3 method (Table 1). Clay content was significantly correlated to P in almost all
217
the models, as P can be adsorbed on the surfaces of clay minerals (Shen et al., 2011; Ulén and
218
Snäll, 2007). Clay mineralogy is also important for determining the P-sorption capability of clays.
219
Clay minerology was not a variable investigated in this study and represents a potential direction
of future research. For the Mehlich 3 method, coarse soil texture components, such as CS, VCS
221
and CSi were important in the prediction equations for the USA dataset. This may be because soil
222
texture is important in determining P leaching from soils through its influence on soil hydrology
223
(Negassa and Leinweber, 2009).
224
The importance of Ca and Mg in the entire dataset and in other parts of the world for the
225
acid oxalate method is interesting, given that the acid oxalate method is typically used in acidic
226
soils. This could be because the acid oxalate method causes excessive solubilization of non-labile
227
P pools, (Six et al., 2012; Valadares et al., 2017a), as e.g. Ca-P, therefore Ca shows amongst the
228
predictor variables because Ca from Ca-P is being released into solution. Mg is probably a
229
predictor variable given that Ca and Mg have similar chemical behavior in soils (Havlin et al.,
230
2005).
231
In our study soil OC was used in the pedotranfer functions for all available soil P methods,
232
except for the acid oxalate method. Soil OC can influence available soil P by providing binding
233
sites (Kang et al., 2009), and the transformation of organic P strongly influences overall P
234
bioavailability in soils (Shen et al., 2011). Yang et al. (2013) note that organic P is a major part of
235
the global soil P pool.
236
It is clear that agricultural practices will have a significant influence over available P and,
237
as we have not included them as variables in our work, will be one of the major sources of
238
uncertainty in the study. Given that fertilizer application accounts for 42 % of total P inputs to
239
agricultural ecosystems, or 25 % of total plant P uptake in fertilized soils (Wang et al., 2010),
240
fertilizer inputs of P are likely to account for a meaningful amount of the variation not explained
241
by the pedotransfer models presented here. Therefore future attempts to develop available P
pedotransfer functions may benefit from finding a way to account for fertilizer inputs. Our
243
pedotransfer functions also did not incorporate crops, something that represents a limitation for
244
the equations.
245 246
5. Conclusions 247
This research fills a clear gap in our ability to estimate available soil P at a global scale.
248
Pedotransfer functions were developed for the common available soil P tests for global datasets
249
Non-linear functions provided the best predictions of available soil P for global and non-global
250
datasets. Including fertilizer and soil management practices may improve these predictions
251
further.
252
Our work has demonstrated that the development of pedotransfer functions for available
253
soil P over large areas using routinely collected soil survey data is possible. This could help
254
address issues such as food security by providing initial estimates of soil fertility and global
255
environmental concerns related to available soil P.
256
257
References 258
Achat, D.L., Augusto, L., Morel, C., Bakker, M.R., 2011. Predicting available phosphate ions from
259
physical–chemical soil properties in acidic sandy soils under pine forests. Journal of Soils
260
Sediments 11, 452–466.
261
Beauchemin, S., Hesterberg, D., Chou, J., Beauchemin, M., Simard, R.R., Sayers, D.E., 2003.
262
Speciation of phosphorus in phosphorus-enriched agricultural soils using x-ray absorption
near-edge structure spectroscopy and chemical fractionation. Journal of Environmental
264
Quality 32, 1819-1819.
265
Borda, T., Withers, P.J.A., Sacco, D., Zavattaro, L., Barberi, E., 2010. Predicting mobilization of
266
suspended sediments and phosphorus from soil properties: a case study from the
267
northwest Po valley, Piemonte, Italy. Soil Use and Management 26, 310–319.
268
Borggaard, O.K., 1990. Dissolution and Adsorption Properties of Soil Iron Oxides. DSc Thesis.
269
Royal Veterinary and Agricultural University, Copenhagen.
270
Borggaard, O.K., 2002. Soil Chemistry in a Pedological Context, 6th ed. DSR Forlag, Frederiksberg.
271
Borggaard, O.K., Szilas, C. Gimsing, A.L., Rasmussen L.H. 2004. Estimation of soil phosphate
272
adsorption capacity by means of a pedotransfer function. Geoderma 118, 55–61.
273
Bryant, R., Gburek, W., Veith, T., Hively, W., 2006. Perspectives on the potential for
274
hydropedology to improve watershed modeling of phosphorus loss. Geoderma, 131, 299–
275
307.
276
Cagliari, J.,Veronez, M.R., Alves, M.E., 2011. Remaining phosphorus estimated by pedotransfer
277
function. Revista Brasileira de Ciencia do Solo 35, 203–212.
278
Carpenter, S.R., 2008. Phosphorus control is critical to mitigating eutrophication. Proceedings of
279
the National Academy of Sciences of the United States of America 105, 11039–11040.
280
Condron L.M., Tiessen H., 2005. Interactions of organic phosphorus in terrestrial ecosystems. In:
281
Turner B.L., Frossard E., Baldwin D.S. (eds): Organic Phosphorus in the Environment.
282
Wallington, CAB International, 295–307.
Cropper, W., Comerford, N., 2005. Optimizing simulated fertilizer additions using a genetic
284
algorithm with a nutrient uptake model. Ecological Modelling 185, 271–281.
285
Follain, S., Schvartz, C., Denoroy, P., Villette, C., Arrouays, D., Walter, C., Lemercier, B., Saby,
286
N.P.A. 2009. From quantitative to agronomic assessment of soil available phosphorus
287
content of French arable topsoils. Agronomy for Sustainable Development 29, 371-380.
288
Havlin, J.L., Beaton, J.D., Tisdale, S.L., Nelson, W.L. 2005. Soil fertility and fertilizers, 7th Ed.
289
Pearson-Prentice Hall, Upper Saddle River, NJ.
290
Haygarth, P., Condron, L., Heathwaite, A.L., Turner, B., Harris, G., 2005. The phosphorus transfer
291
continuum: linking source to impact with an interdisciplinary and multi-scaled approach.
292
Science of the Total Environment 344, 5–14.
293
Haygarth, P.M., Bardgett, R.D., Condron, L.M., 2013. Nitrogen and phosphorus cycles and their
294
management, Soil Conditions and Plant Growth. Blackwell Publishing Ltd, pp. 132–159.
295
Hinsinger, P., 2013. Plant-induced changes in soil processes and properties. In: Gregory, P.J.,
296
Nortcliff, S. (Eds.), Soil Conditions and Plant Growth. Blackwell Publishing Ltd., Oxford.
297
Hosseini, M., Agereh S.R., Khaledian Y., Zoghalchali H.J., Brevik E.C., Naeini S.A.R.M.. 2017.
298
Comparison of multiple statistical techniques to predict soil phosphorus. Applied Soil
299
Ecology 114, 123–131.
300
Hosseini, M., Naeini, S.A.R.M., Dehghani A.A., Khaledian, Y., 2016. Estimation of soil mechanical
301
resistance parameter by using particle swarm optimization, genetic algorithm and
302
multiple regression methods. Soil and Tillage Research 157, 32–42.
303
Ijaz, W., Ahmed, M., Asim, M., Aslam, M., 2017. Models to Study Phosphorous Dynamics Under
304
Changing Climate, Quantification of Climate Variability, Adaptation and Mitigation for
Agricultural Sustainability, in: Ahmed, M., Stockle, C.O. (eds.), Quantification of Climate
306
Variability, Adaptation and Mitigation for Agricultural Sustainability. Springer, Cham. pp.
307
371-386.
308
Johari, A., Javadi, A., Habibagahi, G.A., 2010. Modelling the mechanical behaviour of unsaturated
309
soils using a genetic algorithm-based neural network. Computers and Geotechnics 38, 2–
310
13.
311
Kang, J., Hesterberg, D., Osmond, D.L., 2009. Soil organic matter effects on phosphorus sorption:
312
A path analysis. Soil Science Society of America Journal 73, 360–366.
313
Karlsson, T., Persson, P., Skyllberg, U., Morth, C.M., Giesler, R., 2008. Characterization of Iron (III)
314
in organic soils using extended X-ray absorption fine structure spectroscopy.
315
Environmental Science and Technology 42, 5449–5454.
316
Keshavarzi, A., El-Sayed, E.O., Bateni, S.M., Pradhan, B., Vasu, D., Bagherzadeh, A. 2016. Modeling
317
of available soil phosphorus (ASP) using multi-objective group method of data handling.
318
Modeling Earth Systems and Environment 2, 157. doi:10.1007/s40808-016-0216-5
319
Khaledian, Y., Brevik, E.C., Pereira, P., Cerdà, A., Fattah, M.A., Tazikeh, H., 2017a. Modeling soil
320
cation exchange capacity in multiple countries. Catena 158, 194–200.
321
Khaledian, Y., Kiani, F., Ebrahimi, S., Brevik, E.C., Aitkenhead‐Peterson, J., 2017b. Assessment and
322
monitoring of soil degradation during land use change using multivariate analysis. Land
323
Degradation and Development 28, 128–141.
Kleinman, P.J., Bryant, R., Reid, W., 1999. Development of pedotransfer functions to quantify
325
phosphorus saturation of agricultural soils. Journal of Environmental Quality 28, 2026–
326
2030.
327
Krause, A., Nehls, T., George, E., Kaupenjohann, M., 2016. Organic wastes from bioenergy and
328
ecological sanitation as a soil fertility improver: a field experiment in a tropical Andosol.
329
SOIL 2, 147–162.
330
Lemercier, B., Gaudin, L., Walter, C., Aurousseau, P., Arrouays, D., Schvartz, C., Saby, N.P.A.,
331
Follain, S., Abrassart, J., 2008. Soil phosphorus monitoring at the regional level by means
332
of a soil test database. Soil Use and Management 24, 131–138.
333
Messiga, A.J., Ziadi, N., Mollier, A., Parent, L.E., Schneider, A., Morel, C., 2015. Process-based
334
mass-balance modeling of soil phosphorus availability: Testing different scenarios in a
335
long-term maize monoculture. Geoderma 243-244, 41–49.
336
Mundus, S., Carstensen, A., Husted, S., 2017. Predicting phosphorus availability to spring barley
337
(Hordeum vulgare) in agricultural soils of Scandinavia. Field Crops Research 212, 1–10.
338
Negassa, W., Leinweber, P., 2009. How does the Hedley sequential phosphorus fractionation
339
reflect impacts of land use and management on soil phosphorus: a review. Journal of Plant
340
Nutrition and Soil Science 172, 305–325.
341
Nelson, M., Odeh, I., 2009. Digital soil class mapping using legacy soil profile data: a comparison
342
of a genetic algorithm and classification tree approach. Soil Research, 47(6), 632-649.
343
Peña, F., Torrent, J., 1990. Predicting phosphate sorption in soils of Mediterranean regions.
344
Fertilizer Research 23, 173–179.
Sayers, J.K., Johnston, A.E., Curtin, D. 2008. Efficiency of soil and fertilizer phosphorus use:
346
Reconciling changing concepts of soil phosphorus behaviour with agronomic information.
347
FAO Fertilizer and Plant Nutrition Bulletin. Food and Agriculture Organization of the
348
United Nations, Rome.
349
Scheinost, A.C., Schwertmann, U., 1995. Predicting phosphate adsorption-desorption in a soil
350
scape. Soil Science Society of America Journal 59, 1575–1580.
351
Seguel, A., Barea, J.M., Cornejo, P., Borie, F., 2015. Role of arbuscular mycorrhizal symbiosis in
352
phosphorus-uptake efficiency and aluminum tolerance in barley growing in acid soils.
353
Crop and Pasture Science 66, 696–705.
354
Seilsepour, M., Rashidi, M., Khabbaz, B.G., 2008. Prediction of soil available phosphorus based
355
on soil organic carbon. American-Eurasian Journal of Agriculture and Environmental
356
Science 4, 189–193.
357
Shen, J., Yuan, L., Zhang, J., Li, H., Bai, Z., Chen, X., Zhang, W., Zhang, F., 2011. Phosphorus
358
Dynamics: From Soil to Plant. Plant Physiology 156, 997–1005.
359
Simpson, R.J., Oberson, A., Culvenor, R.A., Ryan, M.H., Veneklaas, E.J., Lambers, H., Lynch, J.P.,
360
Ryan, P.R., Delhaize, E., Smith, F.A., Smith, S.E., Harvey, P.R., Richardson, A.E., 2011.
361
Strategies and agronomic interventions to improve the phosphorus-use efficiency of
362
farming systems. Plant Soil 349, 89–120.
363
Six, L., Pypers, P., Degryse, F., Smolders, E., Merckx, R. 2012. The performance of DGT versus
364
conventional soil phosphorus tests in tropical soils - An isotope dilution study. Plant and
365
Soil 359, 267–279.
Smith, D.R., Francesconi, W., Livingston, S.J., Huang, C., 2015. Phosphorus losses from monitored
367
fields with conservation practices in the Lake Erie Basin, USA. Ambio 44, 319–331.
368
Sugihara, S., Funakawa, S., Nishigaki, M., Kilasara, M., Kosaki, T., 2012. Dynamics of fractionated
369
P and P budget in soil under different land management in two Tanzanian croplands with
370
contrasting soil textures. Agriculture Ecosystems and Environment 162, 101–107.
371
Trichet, P., Bakker, M.R., Augusto, L., Alazard, P, Merzeau, D., 2009. Fifty years of pine fertilization
372
experiments in the Landes of Gascogne (France). Forest Science 55, 390–402.
373
Turner, B.L., Mahieu, N., Condron, L.M., 2003. Quantification of myo-inositol hexakisphosphate
374
in alkaline soil extracts by solution P-31 NMR spectroscopy and spectral deconvolution.
375
Soil Science 168, 469–478.
376
Ulén, B., Snäll, S. 2007. Forms and retention of phosphorus in an illite-clay soil profile with a
377
history of fertilisation with pig manure and mineral fertilisers. Geoderma 137, 455-465.
378
Valadares, S.V., Alvarez V, V.H., Santos, W.O., Paes, J.L.D.A., Lins, C.B. and Novais, R.F., 2017a.
379
Sensitivity of soil P availability tests to Ca-P in Oxisols. Communications in Soil Science and
380
Plant Analysis 48, 1834–1842.
381
Valadares, S.V., Cropper, W.P., Lima Neves, J.C., Leite, H.G., Barros, N.F., Gerber, S., 2017b.
382
Pedotransfer Functions to Estimate Parameters for Soil Phosphorus Models. Soil Science
383
Society of America Journal 81, 210–213.
384
Vincent, A.G., Schleucher, J., Grobner, G., Vestergren, J., Persson, P., Jansson M., Giesler R., 2012.
385
Changes in organic phosphorus composition in boreal forest humus soils: the role of iron
386
and aluminum. Biogeochemistry 108, 485–499.
Von Wandruszka, R., 2006. Phosphorus retention in calcareous soils and the effect of organic
388
matter on its mobility. Geochemical Transactions 7, 6.
389
West, P.C., Gerber, J.S., Engstrom, P.M., Mueller, N.D., Brauman, K.A., Carlson, K.M., Cassidy, E.S.,
390
Johnston, M., MacDonald, G.K., Ray, D.K., Siebert, S., 2014. Leverage points for improving
391
global food security and the environment. Science 345, 325-328.
392
Withers, P.J., Hodgkinson, R.A., Rollett, A., Dyer, C., Dils, R., Collins, A.L., Bilsborrow, P.E., Bailey,
393
G., Sylvester-Bradley, R., 2017. Reducing soil phosphorus fertility brings potential
long-394
term environmental gains: A UK analysis. Environmental Research Letters 12, p.063001.
395
Wyngaard, N., Cabrera, M.L., Jarosch, K.A., Bunemann, E.K., 2016. Phosphorus in the coarse soil
396
fraction is related to soil organic phosphorus mineralization measured by isotopic
397
dilution. Soil Biol. Biochem. 96, 107–118.
398
Yang, X., Post, W.M., Thorton, P.E., Jain, A., 2013. The distribution of soil phosphorous for global
399
biogeochemical modeling. Biogeosciences 10, 2525–2537.
400
Zhou, J., Bing, H., Wu, Y., Sun, H., Wang, J., 2018. Weathering of primary mineral phosphate in
401
the early stages of ecosystem development in the Hailuogou Glacier foreland
402
chronosequence. European Journal of Soil Science, 69(3), 450-461.
Table 1. Performance indices for each model (R2, RMSE, regression method and P Value) with their equations.
Methods Locations Training
Set
Validation Set
Range Regression
method R
2 RMSE P-value Equation
NZ
The Whole World 129 55 96.0
Linear 0.69 14.59 0.00
NZ = 66.73+3.83E-02*CSi-0.73*VFS- 0.11*CS+8.93*Fe+37.30*Al+1.58E-02*MN+0.16*Ca-4.29E-02*Mg-7.44*pH
Non-Linear 0.78 13.42 0.00
NZ = 61.86+1.55*CSi-2.31*VFS- 37.26*Fe+91.39*Al+1.71E-02*Mn- 0.40*Ca+0.36*Mg-7.34*pH-3.67E- 02*CSi^2+5.46E-02*VFS^2+17.11*Fe^2- 23.05*Al^2+1.78E-07*Mn^2+5.92E-03*Ca^2-3.50E-03*Mg^2+0.15*pH^2 The USA
95 40 96.0
Linear 0.77 12.84 0.00 NZ = 20.64+0.13*C-0.67*VFS+0.43*MS-0.68*CS+0.37*OC+15.14*Fe+39.66*Al
Alaska, California, Idaho, Maine, Massachusetts, Michigan, Minnesota, Montana, Nebraska, New Hampshire, New York, Oregon, Texas, Utah, Vermont, Washington and Wisconsin
Non-Linear 0.82 11.48 0.00
NZ =
44.13+6.29E-02*C- 4.48*VFS+1.12*MS-1.29*CS+2.021*OC-
3.91*Fe+75.10*Al-3.54E- 03*C^2+0.12*VFS^2-2.24E- 02*MS^2+2.77E-02*CS^2-3.867E-02*OC^2+3.96*Fe^2-19.45*Al^2
The Other Locations
34 15 92.0
Linear 0.79 13.36 0.00 NZ = 96.69+6.41E-02*C+0.62*FSi-0.13*MS+1.63E-02*MN-12.91*pH
Chile, Costa Rica, Denmark, Guatemala, Nigeria,
Puerto Rico and Russia Non-Linear 0.84 14.05 0.00
NZ =
-5.45+1.12*C- 1.37*FSi+0.43*MS+0.03*Mn+18.80*pH- 9.20E-03*C^2+3.04E-02*FSi^2-1.14E-02*MS^2-1.81E-06*Mn^2-2.53*pH^2
Acid Oxalate
The Whole World
236 102 1195.6
Linear 0.40 165.50 0.00
Acid Oxal =
263.56-3.43*C- 4.77*FSi+119.24*Fe+220.28*Al+5.07E-02*Mn
Non-Linear 0.39 185.30 0.00
Acid Oxal =
59.74-2.18*C+5.03*FSi+198.87*Fe+568.73*Al+ 1.86E-02*Mn-1.09E-02*C^2-5.38E-
02*FSi^2-38.46*Fe^2-232.38*Al^2+5.79E-06*Mn^2
The USA
214 91 5825.8
Linear 0.60 561.64 0.92
Acid Oxal =
-96.20-5.12*C+6.21*FSi+914.60*Al+0.23*Mn+4 .77*Ca
Alabama, Alaska, California, Colorado, Connecticut,
Delaware, Florida, Georgia, Hawaii, Idaho, Illinois, Non-Linear 0.42 296.78 0.92
Acid Oxal =
Indiana, Iowa, Maine, Maryland, Massachusetts, Michigan, Minnesota, Mississippi, Montana, Nebraska, Nevada, New Hampshire, New Jersey, New Mexico, New York, North Carolina, North Dakota, Ohio, Oklahoma, Oregon, Pennsylvania, South Carolina, South Dakota, Tennessee, Texas, Utah, Vermont, Virginia, Washington, West Virginia, Wisconsin and Wyoming
3.11*Ca+3.44E-02*C^2-4.62E-02*FSi^2- 463.31*Al^2-4.60E-05*Mn^2+6.92E-03*Ca^2
The Other Locations 28 12 705.1 Linear 0.62 110.20 0.00 Acid Oxal =
39.19-4.80*C+1175.29*Al+8.33*Ca-4.08*Mg
Chile, China, Costa Rica, Denmark, Ghana, Guatemala,
Poland and Puerto Rico Non-Linear 0.85 91.40 0.00
Acid Oxal =
33.46- 2.26*C+1276.51*Al+7.39*Ca+1.46*Mg- 3.52E-02*C^2-112.11*Al^2-4.10E-02*Ca^2-4.01E-02*Mg^2
Bray
The Whole World
101 43 91.9
Linear 0.27 19.70 0.00
Bray1 = 22.52+1.71E-03*C+7.90E-02*FSi+0.12*CSi+0.68*FS+0.72*CS+2.19 *OC-5.10*pH
Non-Linear 0.31 19.00 0.00
Bray1 = 98.09-1.04*C-0.60*FSi- 0.40*CSi+1.25*OC-16.99*pH+9.84E- 03*C^2+1.01E-02*FSi^2+6.45E-03*CSi^2+6.43E-02*OC^2+1.00*pH^2
The USA 68 28 72.3 Linear 0.00 9.62 0.00 Bray1 = 42.02-5.78*pH
Alaska, Delaware, Hawaii, Illinois, Louisiana, Montana, North Carolina, Oklahoma, Pennsylvania, South Dakota, Tennessee, Vermont and Virginia
Non-Linear 0.28 12.42 0.00 Bray1 = 124.16-35.31*pH+2.56*pH^2
The Other Locations
34 14 91.9
Linear 0.64 18.74 0.09
Bray1 = 131.27-0.70*C-0.29*FSi- 1.27*CSi+1.27*VCS+2.40*OC+3.96*Mg-17.63*pH
Canada, Ghana, Nigeria, Poland, Costa Rica and
Guatemala Non-Linear 0.89 12.35 0.09
Bray1 = 779.56-2.02*C+4.11*FSi- 3.51*CSi+2.48*VCS+25.30*OC- 21.12*Mg-247.63*pH+1.37E-02*C^2- 9.95E-02*FSi^2+0.13*CSi^2-3.76E- 02*VCS^2-5.64*OC^2+0.75*Mg^2+19.69*pH^2 Mehlich
The Whole World
83 35 86.1
Linear 0.23 24.75 0.00 Mehlich = 12.09-32.35*Al-0.41*Ca+24.58*K
Non-Linear 0.44 17.40 0.00
Mehlich = 2.92+9.06*Al+1.89*Ca- 5.35*K-20.02*Al^2-4.45E-02*Ca^2+11.57*K^2
The USA 74 31 86.1 Linear 0.63 19.06 0.044 Mehlich =
California, Connecticut, Delaware, Iowa, Kansas, Michigan, Mississippi, Nevada, New Mexico, North Dakota, Oregon, Vermont, West Virginia and Wyoming
Non-Linear 0.62 13.29 0.044
Mehlich = -0.17-3.77E-02*CSi+1.46*CS-
1.89*VCS+0.18*OC- 3.82*Mg+40.47*K+0.02*CSi^2+2.48E-
02*CS^2-1.58E-02*VCS^2-0.07*OC^2+4.30E-02*Mg^2-7.169*K^2
The Other Locations 12 - 76.6 Linear 0.36 23.76 0.044 Mehlich = 44.99-41.36*Al
Costa Rica and Poland Non-Linear 0.38 24.70 0.044 Mehlich = 49.93-79.664*Al+30.46*Al^2
Note: clay (C), fine silt (FSi), coarse silt (CSi), very fine sand (VFS), fine sand (FS), medium sand (MS), coarse sand (CS), very coarse sand (VCS), total organic carbon (OC), extractable iron (Fe),
Table 2. Correlation (Pearson) between soil co-variates and extraction methods for different datasets. Significant differences are indicated as p < 0.05* and p <0.01**. ns, not significant
Methods Locations C FSi CSi VFS FS MS CS VCS OC PH Ca Mg K Fe Al Mn
NZ The Whole World
- - 0.04ns -0.06ns - - -0.08ns - - -0.39** -0.18** -0.22** - 0.61** 0.72** 0.30**
The USA -0.07ns - - -0.07ns - 0.03ns 0.03ns - 0.36** - - - - 0.68** 0.81** -
The Other Locations
0.35** 0.60** - - - -0.35** - - - -0.45** - - - - - 0.61**
Acid Oxalate
The Whole World
-0.12* 0.27** - - - - - - - - - - 0.47** 0.46** 0.20**
The USA -0.03ns 0.22** - - - - - - - - 0.08ns - - - 0.57** 0.43**
The Other Locations
-0.23ns - - - - - - - - - 0.21ns 0.05ns - 0.66** -
Bray The Whole World
-0.22** -0.23** -0.27** - 0.36** - 0.17* 0.13ns -0.20* - - - - - -
The USA - - - -0.34** - - - - - -
The Other Locations
-0.42** -0.31* -0.28* - - - - 0.09 ns 0.20ns -0.22ns - -0.09ns - - - -
Mehlich The Whole World
- - - 0.28** 0.43** - -0.11ns -
The USA - - 0.26** - - - 0.06ns -0.03ns -0.03ns - - 0.13ns 0.56** - - -
The Other Locations
- - - -0.60* -
Note: clay (C), fine silt (FSi), coarse silt (CSi), very fine sand (VFS), fine sand (FS), medium sand (MS), coarse sand (CS), very coarse sand (VCS), total organic carbon (OC), extractable iron (Fe),