947
Computer Vision to Classify Various Soil Types to
Improve Agricultural Development
Aranga Arivarasan, Dr.M.Karthikeyan
Abstract: India is big country in the universe basically very much dependant on Agricultural. One of the important aspects in agricultural development heavily relies on the appropriate soil type. From the beginning of human history the relationship with the soil has influenced the ability to cultivate crops to achieve the success of civilization. The soil endorses as the foundation of agriculture because of the relationship between humans, earth and food sources. In computer Vision the CBIR is most widely used measures while dealing with the images. In the proposed system an efficient approach to identify eight different soil types based on the color and texture of the soil image is achieved through implementing the CBIR principles. As initial process HSV histogram and the Tamura texture features are extracted from the soil images to train the Support Vector machine. Next the Support Vector Machine is tested with a new soil type to identify its category. The distance metric used here is universally well known Manhaten distance metric. The experimental results were evaluated with eight different category of soil type. Each soil type contains 25 images to compute 200 images for the dataset. The proposed system yields better predominance compared with existing models by achieving an overall accuracy of 80.21 percentages.
KeyWords: Soil,Agriculture, Color,Texture,HSV,Tamura,SVM, Shape.
————————————————————
1.
INTRODUCTION
Human society has developed the resources of our planet in unprecedented, creative and practical ways that have contributed to human development and permanent world societies. Of these resources, soil and water gave us the opportunity to produce humans through food, agriculture, for our dependence. The link between soil and agriculture made the human able to translate from a hunting society to an agricultural society. The human effect is the main effect of human action to eliminate firefighting and the atmosphere environment used to clear the bloom. The initial plant was burnt, and the animals in the surrounding people near the early people can enjoy the animals and to increase the growth of some pancakes. They and other factors for example, the pressure of population, climate change, and good economic defenses will help to build the basic structure of a revolutionary revolution and change the contact between people and the world. The agricultural change of horticulture has changed the change in the form of human history and did not change the Earth's nutrition.
The man was given the first grade in the morning of the ninth period, given the essential nutrients to the soil, and laid the foundation for human pancakes. Even though the earth is often called "fruit packages", not all lands are good for agriculture. The best soil for agriculture is to be used for mining minerals sand: 0.05-2 mm, lotion: 0.002-0.05 mm, clay <0,002 mm, organic matter (SOM), air and water. The balanced participation of these elements enables water and escape, oxygen in the region, nutrition that facilitates the growth of the product and provides physical support to plants. The distribution of these elements into a land is shaped by five structures family, time, weather, living things and topography. Each of these elements has a direct and broader role to play in the impact of land benefits for agriculture. Different type of crops needs different kinds of soil to grow better. Clay type of soil is best for growing Cabbage and broccoli and is not considered good for root vegetables. Because of its dense texture it creates problems for roots to expand. Sand soil is best for root based vegetables like turnips, parsnips, and carrots. Loam type of soil helps grow the best possible crops because it provides the necessary elements. Silt It is very fertile soil that has nutrients for good development. Lettuce, cabbage, carrots, turnips, and many other vegetables flourish in silt. Peat type of soil is best in case of growing Legumes, root crops, cabbage, and spinach. The use of internet and computer vision has advanced a lot. So the formers need to be updated with technology and latest agriculture news to get best out of soil by using the new trends. The technology should also provide the appropriate required knowledge from the hidden patterns of soil to help development in the field of agricultural.
____________________
Aranga Arivarasan is a Research Scholar who is working as Assistant Professor in Division of Computer and Information Science, Annamalai University, India. He completed his B.Sc[Computer Science] and M.Sc[Computer Science] From Madras university in 1998 and 2000 respectively, the M.B.A and M.Phil[Computer Science] from Annamalai University in 2005 and 2007 respectively.
Fig 1. Soil Structure
Soil structure refers to the shape of the soil clumps in any given soil. Soil structure is an important factor for water drainage through the soil and the suitability of a soil to hold structures.The Earth consists of four basic elements: sand, salt, clay and organic matter. Basic information about expertise in the soil can be found in the Land Survey, but also needs to know how they can affect the soil. Organic matter contains dead plants, natural, animal and microorganisms. OM has the privilege of storing water content that helps to provide to the plats during the dry season. Sand is the biggest particles of soil which can be at a size between 0.5 mm to 2 mm. other sand particles bigger than this size is considered as the stones and gravels. The sand does not hold water particles within it. It allows the water to drain trough it. Because of this nature it doesn’t hold any nutrition for the plats to grow. Silt is the intermediate soil particles which can be at a size of 0.002mm to 0.05 mm. It consists of small amount of water holding capability as well as nutrient holding capability. It can be found at the water ways. Clay has the smallest particles having the size lower than 0.002 mm. The clay is a good water and nutrient holder. It is very good for plants. Loam is considered as the ideal soil type. It is a mixture of sand, silt and clay.
2. MATERIALS AND METHODS
2.1. Color Feature Descriptors
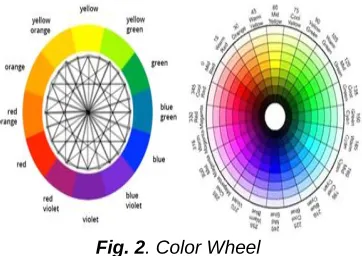
The colors affect us in many different ways, both physically and mentally. Good use of color will help you to achieve peace of mind. Red is designed to increase blood pressure, while blue is keeps us calm. The basic tool for combining the colors is color wheel or color circle which was developed by Sir Isaac Netwton in 1966. It is shown in Fig,1.The most common version of color wheel is with 12 colors based on RYB or artistic color model. Color circle is drawn based on red yellow and blue.
Fig. 2. Color Wheel
In common phenomena the primary colors Red, yellow and blue are the 3 pigment colors that cannot be mixed or formed by any other color combination. The rest of the colors are derived from these 3 hues. The Secondary Colors are Green, orange and purple these colors are formed by mixing or combining the primary colors. Tertiary colors are known as Yellow-orange, red-orange, red-purple, blue-purple, blue-green and yellow-green these colors are formed by the combination of a primary secondary color. Always the hue is a two word name as blue-green, red-violet, and yellow-orange because it is the combination of the primary and secondary colors
2.2. Texture Feature Descriptors
Texture is a general notion that can be attributed to all objects available in nature. The texture relates mostly to a specific, spatially repetitive (micro) structure of surfaces. These surfaces are formed by repeating a unique element or many elements in various relative spatial positions. Always the texture representation includes local variations of scale, orientation or some other geometric and optical elements of an image. Within a limitation the natural textured surfaces and artificially created visual patterns of an image is defined as a texture. Synthesized textures For human understanding the texture involves various qualitative structural features, like fineness, coarseness, smoothness, granularity, lineation, directionality, roughness, regularity, randomness, and so on. These features are shown in Fig.3.To extract the desired texture type these features are defined in a special arrangement. To describe the textures it is very difficult to use human classifications as a basis for fundamental definitions of image textures, because there is no specific way to associate these features, easily perceived by human vision, with computational models.
949 Variety of many computational methods leads to the way for
indexing and retrieving textures have been found after several years of research and development through texture analysis and synthesis. The textural features describe the local arrangements of image signals in the spatial domain or in the Fourier domain or other spectral transforms. Always the textural features will follow a particular random field model of textured images. Detecting of textures of an image relies through the spatial, frequency or perceptual properties.
3.
SYSTEM
OVERVIEW
OF
IMAGE
CLASSIFICATION USING CONTENT-BASED
IMAGE RETRIEVAL METHOD
3.1. HSV Histogram
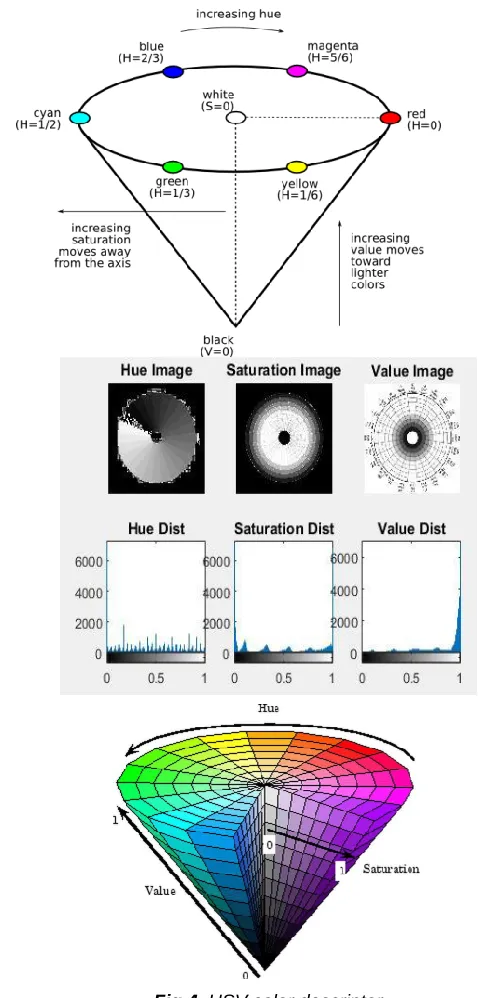
Hue, Saturation, and Value (HSV) are a general color model that is often used instead of the RGB color model. HSV may also be called HSB (hue, saturation and brightness). The RGB and CMYK are very much related with the primary colors, But the HSV is defined as similar as how humans understand color. The HSV is based on three values: hue, saturation, and value. This color space describes colors known as hue or tint in terms of their shade which is the saturation or amount of gray and their brightness value. At the same time the HSB, which replaces the term brightness for value, refers to the same color model. It is much easy to work with HSV because to isolate the color present in an image is a easier task. So it is necessary to convert the image to HSV. The HSV color represent the hue cause to occur the color you want, saturation brings how intense the color is in the image and value defines the lightness of the image. In Fig.4. the wheel denote a mild red color and 240 denote a blue color. In MATLAB, the hue ranges from 0 to 1 instead of 0 to 360. The HSV color wheel is described as a cone or cylinder, but always with these three components are Hue the color portion of the color model, which is expressed in terms of number from 0 to 360 degrees as shown in Table.1. Saturation is the amount of gray in the color, from 0 to 100 percent. Reducing the saturation value toward zero to include gray and that will produces a faded effect. On the other hand in situations the saturation is also expressed in a range from just 0–1, where 0 represent true gray and 1 is a true primary color. Value the brightness or intensity of the color is much related with saturation ranges from 0–100 percent, where 0 is full black, and 100 is the brightest and reveals the true color.
Fig.4. HSV color descriptor
Table. 1. HSV color Range
Color Angle
Red 0-60
Yellow 60-120 Green 120-180
Cyan 180-240
Blue 240-300
The graph or a plot of distribution of the pixel intensities in an image is known as histogram. A histogram can be calculated both for the gray scale image as well as for the color image also. The first case have only single channel so single histogram can be derived. In the second case can derive three histograms because there are three channels, calculating the histogram of an image is very useful as it gives an intuition regarding some properties of the image such as the tonal range, the contrast and the brightness. For our CBIR the hue scale is divided into eight groups, saturation is divided into two groups, and the intensity scale is divided into two groups.
{
(
)
(
)
(
)
{
{
{
{
By combining each of these groups, in total 32 cells to represent a 64-component of HSV color histogram can be extracted. The three scales having a different number of groups because among the three hues is considered as the most important one following intensity in number two and finally the saturation. The respective histogram component is updated by one for each pixel having the corresponding color combination. It is well understood that the better way of indexing of the histograms will lead to the increased performance of a CBIR to a great extent.
3.2. Tamura Texture
The three widely used texture extraction approaches are statistical measures which identifies the relation with contrast, correlation and entropy known as aspect properties. The next one is stochastic models. It assumes the stochastic process result as texture. The structure measures assume the repetition of little atomic texture. Always the perceptual features are very much significant in the process of clustering or categorization. By the human the Tamara texture features are extracted based on the psychophysical studies of characterizing elements like coarseness, contrast, directionality, line-likeness, regularity and roughness. The contrast is to what extent the black or
white distribution is biased with gray levels q varies in the image I.
Where
|
∑
|
Directionality is the edge strength and the directional angle of an image. Hear in Tamara the pixelwise derivatives of Prewitt edge detector is used to find the directionality of an image.
(|
| |
|)
By counting the number of edge pixels corresponding to the directional angles and the edge strength which is greater than a threshold value a histogram is derived. With the help of that histogram it is easy to determine the strong orientation of an image which reaches peak for a highly directional image. The most fundamental texture feature Coarseness has a direct relationship to scale and repetition rates. It is very much related with spatial variations of gray level distances which are the primitive elements implicit to the size are used to form the texture. For a fixed window size texture with smaller number of texture elements is said that more coarser than the one which has larger number. An image will contain texture sat in several scales. The aim of the coarseness is to identify the largest size in which a texture exists, and also where a smaller micro texture is present. The algorithm is followed to identify the coarseness
Step 1: At each pixel P(x,y) compute six average for the windows of size k=0,1,2,..,5
Around the pixel. The average over the neighborhood of size 2k X 2k at the point (x,y) is
∑
∑
Where I(i,j) is the gray level at image pixel (i,j) coordinates. Step 2: At each pixel
Compute the absolute difference at each scale Ek(x,y)
between pairs of no overlapping averages on opposite sides of different directions.
|
|
|
|
{
}
Find the value of k that maximizes Ek(x,y) in either direction.
Select the scale with the largest variation: Ek =
max(E1,E2,E3,…..) the best pixel window size sbest is 2 K
|
(
)
(
)|
951 3.3. SVM
A support vector machine (SVM) performs classification by constructing an N-dimensional hyperplane that optimally separates the data into two categories. SVM models are closely related to neural networks. In fact, a SVM model using a sigmoid kernel function is equivalent to a two-layer, feed-forward neural network. Using a kernel function, SVM’s are an alternative training method for polynomial, radial basis function and multi-layer perceptron classifiers in which the weights of the network are found by solving a quadratic programming problem with linear constraints, rather than by solving a non-convex, unconstrained minimization problem as in standard neural network training. The goal of SVM modeling is to find the optimal hyperplane that separates clusters of vector in such a way that cases with one category of the target variable are on one side of the plane and cases with the other category are on the other size of the plane. It is shown in Fig.5. The vectors near the hyperplane are the support vectors. SVM learning is a useful statistic machine learning technique that has been successfully applied in the pattern recognition area. If the data are linearly non-separable but nonlinearly separable, the nonlinear support vector classifier will be applied. The basic idea is to transform input vectors into a high-dimensional feature space using a nonlinear transformation, and then to do a linear separation in feature space. To construct a nonlinear support vector classifier, the inner product is replaced by a kernel function. The SVM has two layers. During the learning process, the first layer selects the basis, (as well as the number), from the given set of bases defined by the kernel the second layer constructs a linear function in this space. This is completely equivalent to constructing the optimal hyperplane in the corresponding feature space. The SVM algorithm can construct a variety of learning machines by use of different kernel functions. Some of them are as follows.
Polynomil kernal K(x,y) = ((x,y)+1)d
Radial basis function with Gaussian kernel of width c>0 K(x,y) = exp(-|x-y|2/c)
Neural networks with tanh activation function K(x,y) = tanh(k(x,y)+c)
Gaussian radial basis function (RBF) K(x,y) = exp(-|x-y|2)
Fig.5. SVM separating Hiperplane
Laplace RBF kernel K(x,y) = exp(-(|x – y|/σ))
4.
EXPERIMENTAL RESULTS
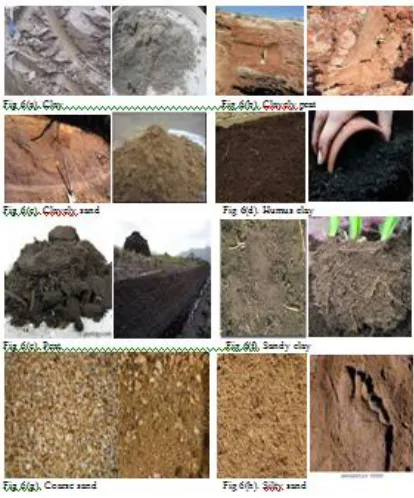
For our experimental set up 8 different categories of sand type were considered. The types are 1.Clay, 2.Clayely peat, 3.Clayely sand, 4.Humus clay, 5.Peat, 6 Sandy clay, 7.Coarse sand and 8.Silty sand. In Fig 6 for each category two sample images were shown.
Fig. 7(a). HSV Features of Sample soil Image
Fig.7(b). Coarseness of sample soil Image
In Fig.7(a). The hsv histogram features and in Fig.7 (b). The relevant images to the features are show. This is for a sample image which is used to test the proposed system. In Fig.8. the SVM training method and testing method is figured.
Fig.8. Training and Testing by SVM.
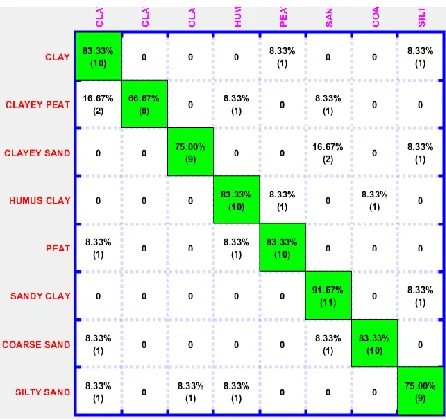
Fig.9. Confusion matrix.
From the Fig.9. the proposed system retrieves the results. With the results we can calculate the precision, recall values for the appropriate classification process. The proposed system yields an accuracy of 80.21%, the Precision is 6.6 the Recall is 8.3 and the F_Measure value is 7.4
5.
CONCLUSION
953
REFFERENCES
[1] Else K.Bunemanna, Giulia B ongiorno, Zhanguo Baic Rachel E Creamer, Gerlinde De Deyn, Ron de Goede, Luuk Fleskens, Violette Geissen, Thom W.Kuyper, Paul Mäder, Mirjam Pulleman, Wijnand Sukkel, Jan Willem van Groenigen, Lijbert Brussaard, ―Soil quality – A critical review‖, Soil Biology and Biochemistry, vol 120, pp105-125, 2018.
[2] Charles N. Merfield ―Integrated Weed Management in Organic Farming‖, Organic Farming, pp. 117-180, 2019.
[3] Vladimir Simansky, Martin Juriga, Jerzy Jonczak, Lukasz Uzarowicz, Wojciech Stepien,‖ How relationships between soil organic matter parameters and soil structure characteristics are affected by the long-term fertilization of a sandy soil‖, Geoderma, vol. 342,pp.75-84, 2019.
[4] Aleksandra A.Nikiforova, Olaf Bastian, Maria E.Fleis, ,axim V.Nyrtsov, Aleksandr G.Khropov, ―Theoretical development of a natural soil-landscape classification system: An interdisciplinary approach‖, CATENA, vol. 177, pp. 2838-245, 2019.
[5] Giovanni Forte, Eugenio Chioccarelli, Melania De Falco, Pasquale Cito, Antonio Santo, IunioIervolino, ―Seismic soil classification of Italy based on surface geology and shear-wave velocity measurements‖, Soil Dynamics and Earthquake Engineering, vol. 122, pp. 79-93, 2019.
[6] Andrei DORNIK, Lucian DRAGU, Petru URDEA, ―Classification of Soil Types Using Geographic Object-Based Image Analysis and Random Forests‖, Pedosphere, vol. 28(6), pp. 913-925,2018.
[7] Jose Manuel Moreno-Maroto, Jacinto Alonso-Azcarate, ―What is clay? A new definition of ―clay‖ based on plasticity and its impact on the most widespread soil classification systems‖, Applied Clay Science, vol. 161, pp. 57-63, 2018.
[8] Zhao Chunhui, Gao Bing, Zhang Lejun, Wan Xiaoqing, ―Classification of Hyperspectral Imagery based on spectral gradient, SVM and spatial random forest‖, Infrared Physics & Technology, vol. 95, pp. 61-69,2018.
[9] M.S.Suchithra, Maya L.Pai, ―Improving the prediction accuracy of soil nutrient classification by optimizing extreme learning machine parameters‖, Information Processing in Agriculture, In Press, Available online 21 May 2019.
[10]Deepak Kumar Jain, Surendra Bilouhan Dubey, Rishin Kumar Choubey, Amit Sinhal, Siddharth Kumar Arjaria, Amar Jain, Haoxiang Wangd, ―An approach for hyperspectral image classification by optimizing SVM using self organizing map‖, Journal of Computational Science, vol.25, pp. 252-259, 2018.
[11]M.S.Sirsata, E.Cernadas, M.Fernández-Delgado, R.Khan, ―Classification of agricultural soil parameters in India‖, Computers and Electronics in Agriculture, vol. 135, pp. 269-279, 2017.
[12]Wei Wu, Ai-Di Li, Xin-Hua He, Ran Ma, Hong-Bin Liu, Jia-KeLv, ―A comparison of support vector