RESEARCH ARTICLE
APPLICATION OF STOCHASTIC ANALYSIS AND MODELING TECHNIQUES IN SIMULATING THE
OUTFLOW SERIES FROM LAKE TANA CATCHMENT, ETHIOPIA
Belete, Mulugeta Azeze
1*, Yilma Seleshi
3and Hartmut Eckstädt
21School of Water Resources and Civil Engineering, Bahir Dar University, Bahir Dar, Ethiopia, 2Institute of Sanitary Engineering, Rostock University, Rostock, Germany,
3Civil Engineering Department, Addis Ababa Institute of Technology Addis Ababa University, Addis Ababa, Ethiopia
ARTICLE INFO ABSTRACT
Lake Tana is the biggest fresh water body in Ethiopia. Recently the Lake and its catchment water resources have been identified as one of the most important sources for hydropower, irrigation, and fishery development. However, there are huge uncertainties in estimating the water balance terms of both the Lake and its catchment. These will have an effect in developing the resources in a sustainable manner. The purpose of this article is to model and simulate the outflow series from the catchment measured at the Outlet of the Lake. This will give an opportunity to look the development impacts and their sustainability from the net supply perspective. A first order autoregressive model with model parameters Ø1= 0.7845 and σa = 0.612 is identified as an adequate model to represent the
deseasonalized series of the net supply of the catchment.
Copyright, IJCR, 2013, Academic Journals. All rights reserved.
INTRODUCTION
An important aspect of water resources development is planning, designing and operation of reservoirs (Jain, 2003). However, reservoirs are capital intensive and environmentally sensitive projects that need careful planning and management. But in very few places nature gives very indispensable reservoirs such as Lake Tana which is a natural reservoir in Ethiopia. In this article the terms reservoir and Lake are used synonymously. Lake Tana is the largest fresh water body in Ethiopia with a maximum depth of 14m and mean depth of 9m. It is located from 11.62oN to 12.31oN latitude and from 37.01oE to 37.64oE longitude with average natural altitude of 1786meter above sea level (m asl). At similar elevation the lake has a surface area of about 3060km2 with length of 74km
and 68km width and storage capacity of 29km3. The Lake catchment including the Lake area has an area of 15320 km2 with an average elevation of 2025m asl. It is the head water of the Blue Nile River which is one of the major tributary to Nile River. There are four perennial rivers (Gilgil Abbay, Megech, Ribb, and Gumera) and many other seasonal streams in the catchment that fed Lake Tana. Blue Nile, which is named Abay locally, is the only natural outflow from the Lake. At the natural outlet of the Lake a weir has been constructed and commissioned in 1996. The weir regulates water storage in Lake Tana over a 3 m range from 1,784 m to 1,787 masl. The active storage of the Lake between these levels is about 9,100 million cubic meters (Mm3), which is approximately 2.5 times the average annual outflow from the Lake. The hydrology of Lake Tana catchment is not well documented in the scientific literatures except in very few journal articles and reports that present estimate of the water balance of the Lake. Although
*Correspondence Address: Belete, Mulugeta Azeze, Rostock, Germany
there are still huge uncertainties associated with the hydrology of Lake Tana catchment, the hydrologic study conducted by SMEC International Pvt. Ltd. indicates that the estimated annual inflow into the lake is about 4.9 Billion cubic meters (Bm3), direct annual rainfall over the lake 3.8(Bm3), Evaporation from the lake 5(Bm3), and the Lake outflow is about 3.7 (Bm3) (SMEC 2008b). Kebede et al. (2005) have also estimated the water budget component of the lake, and make a preliminary sensitivity analysis of Lake Level and Lake Outflow to rainfall changes. Wale et al. (2009) has estimated the runoff from ungauged catchments using regionalization as 880mm per year with a water balance closure error of 5%. Rientjes et al. (2011) have also dealt with regionalisation studies for the purpose of simulating Lake Tana level. But SMEC (2008b) has indicated the tricky in regionalization approach as the catchments generating the base flow and surface run off for some of the major tributaries like Gilgel Abay are not concurrent. Chebud (2009) has also tried to model the Lake stage and estimated the water balance of Lake Tana. The inflow based approaches and attempts in managing the Lake and its catchment water resources are associated with huge uncertainties which can be seen clearly in the discrepancies of values of the water balance terms estimated by various studies.
Lake Tana sub-basin has immense natural resources potential for growth. The Government of Ethiopia (GoE)’s in its Plan for Accelerated and Sustained Development to End Poverty (PASDEP) had identified Tana as the first of the five proposed growth corridors (zones) in the country (MoFED 2006). Huge investment plans have been prepared to develop the water resources of the sub-basin. In line with this the constructions of some water conveyance and storage structures for
ISSN: 0975-833X
International Journal of Current Research
Vol. 5, Issue, 06, pp.1577-1581, June,2013
INTERNATIONAL JOURNAL OF CURRENT RESEARCH
Article History:
Received 20th
March, 2013 Received in revised form 24th
April, 2013 Accepted 10th
May, 2013 Published online 15th
June, 2013
Key words:
hydropower and irrigation development have been started. Tana-Beles hydropower and irrigation development project, that has an installed capacity of 460MW and supplied by Lake Tana at an average supply rate of 77m3/s (SMEC, 2008c), is the biggest projects in the sub-basins. The construction of this hydropower project is completed and commissioned in May, 2010. The construction of a storage Dam for irrigation of 7000ha of land on Koga River, a tributary to Gilgel Abay, is also completed and the constructions of other Dams are still going on. In Lake Tana Catchment the availability of hydro-meteorological data is very scanty. Relatively longer periods of reliable records are only available for the Lake Level and Lake Outflow measured at Bahir Dar, a town located just at the shore of the Lake and its outlet. Other gauging stations for runoff measurement are located at the upstream locations of the major tributaries of the lake and many stations suffer from sedimentation, bank scouring, and in a few cases from bank overflow during high river stages (SMEC 2008a). Only 40% of the catchment area is covered by runoff measuring gauge stations. This indicates not only the inadequacy of the hydrometric stations spatial coverage but also the problems in getting reliable data from existing stations. The absences of sufficient and reliable records of inflows to the Lake have hindered effective use of conventional approaches to assess the characteristics and responses of Lake Tana in various development scenarios. However, this need not delay or restrict our attempt to find other alternative methods that will help us towards the creation of more sustainable water resource systems planning and management scenarios in Lake Tana’s catchment. The Outflow measured at the outlet of the catchment i.e. at the outlet of the lake is its net supply that can be used indirectly to evaluate the overall impacts of upstream developments on the characteristics and performances of the Lake. If we look the situation from net supply perspective than inflow we will be able to understand it and make clear conceptualization.
Everyone involved in water resource systems development and management has an obligation to see that those systems provide sufficient quantities and qualities, at acceptable price and reliabilities, and at the same time protect the environment and preserve the biodiversity and health of ecosystems for future generation (Loucks, 2000). Though Lake Tana and its catchment are very valuable resources its management needs very careful planning and operation that neither withdraw significant water from the Lake nor allow the storage of excessive floods. Therefore, in response to the increased rate of development in Lake Tana catchment’s there is an intensified need to examine the catchment’s water resources system performances and their sustainability. Quantifying performance measuring indices like reliability and resilience of Lake Tana and reassessing them in light of various development scenarios and information is one of the classical problems that have not been solved yet.
Water resources systems performance measures are receiving considerably increased attention by the scientific community. Reliability, resilience, and vulnerability indexes have been identified and used as a measure of system performance characteristics. Likewise the performance of a reservoir or reservoir systems is assessed in terms of its reliability, resilience, and vulnerability. The definitions of reliability,
of previous investigators see for example Wurbs and Bergman, (1990); Vogel and Bolognese (1995); and Thomas and Dan Rosbjerg (2004). In general reliability provides a measure of how often a system fails. Resilience provides a measure of how long a failure will last, and vulnerability provides a measure of how severe failures may become. A failure is defined as the inability of reservoir system to deliver a specified yield or service. The most common definition of probability of failure is the proportion of time units or periods such as months during which the reservoir cannot meet the demand under the adopted operating rule.
In Lake Tana catchment, the observed Outflow at the outlet of the catchment is a single realization that has been generated from the natural stochastic processes that can be modelled. An appropriate stochastic model to this series can be fitted and the fitted model will then be used to generate various statistically similar realizations. The synthetic generated realizations will then be used to reassess the characteristics and performance measuring indices of the Lake. Usually in reservoir design and analysis synthetic inflows are generated and used to determine the characteristics and performance indices of a reservoir. Because using historic data alone has a limitation in that the future may not be an exact replica of the past. For this purpose looking the problem indirectly from the net supply perspective and attempting to model it is very fundamental. The purpose of this article is therefore to model and simulate the Outflow (net supply) of Lake Tana catchment which can be used as in input to indirectly reassess the characteristics and performance measuring indices of Lake Tana and sustainability of other developments endeavours in its catchment.
METHODS AND MATERIALS
The planning and management of water resources systems involves the collection and analysis of many hydro-meteorological data which are known with the property of possessing an inherent natural variability. Because observations measured from natural phenomena posses an inherent probabilistic structure, time series models are employed for modelling water resources systems. Time series is defined as a sequence of values arranged in their order of occurrence in time (Box et al., 1994). A set of quantitative observations such as stream flow measured in discrete time interval and arranged in chronological order is an ideal example of time series. The time series to be analyzed may then be considered as one realization of the underlying stochastic process. For example, the Outflow series recorded at the outlet of Lake Tana catchment is a single realization among other perhaps many different possible realizations of the stochastic process. However, it is obvious that there is not just one realization of such a process. In principle there are an arbitrary number of realizations which all have the same statistical properties as they all result from the same stochastic process. One of the major uses of time-series modelling is generation of synthetic values for many other realizations. The generation of synthetic time series often consists of the generation of independent variables in a series defined as a random process. Salas et al. (1988); Box et al. (1994); and Hipel et al. (1994) have detail explanation on time series analysis. The usual stochastic model development, calibration,
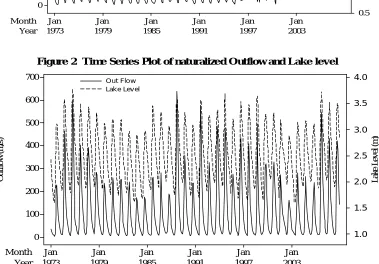
outflow series from Lake Tana catchment. Monthly data for Lake Tana water level and its Outflow have been collected for a period of 36 year since 1973 to 2008. Visual inspection of plots of the series against time show clear non-homogeneity and seasonality as shown in Figure 1. The reason for the non-homogeneity is because of the regulation of the Outflow since 1996. After detecting the regulation effect the outflow series is naturalized. This has been done by first naturalizing the Lake Level for the period from 1996 to 2008. Naturalizing the Lake level has been made by limiting the maximum and minimum levels, based on the characteristics of the unregulated lake level recorded in the period from 1973 to 1995, and interpolating the regulated Lake levels in accordance with the restrictions. After naturalized the Lake level a relationship has been developed for the unregulated lake level and outflow and then the relationship has been applied to estimate the naturalized outflow in the period from 1996 to 2008. The graphs in Figure 2 show the time series plots of naturalized Lake Level and Outflow.
The quality and characteristics of the naturalized Outflow series i.e. the net supply series has been further examined before running to the modelling process. The presences of outliers, trend, and the stability of variance and mean of the data sets have to be examined. Wilcox (2009) has indicated the importance of box plot in assessing the existence of outliers. Hence, the presences of outliers for the naturalized Outflow series has been assessed using box plot and found that the series is free from outlier. Dahmen and Hall (1990) have recommended the use of Spearman’s rank-correlation method to investigate the presences of linear trends. Assessing the stability of variance and mean is very essential and critical in time series analysis especially in the analysis of stationary time series. The stabilities of mean and variance of Lake Tana net supply series have been assessed using the procedures outlined in Dahmen and Hall (1990). The assessment shows the stabilities of both the mean and variance of the Outflow series. Some of its statistical characteristic is presented in Table 1.
Year Month
2003 1997
1991 1985
1979 1973
Jan Jan
Jan Jan
Jan Jan
700
600
500
400
300
200
100
0
4.5
4.0
3.5
3.0
2.5
2.0
1.5
1.0
0.5
O
u
tF
lo
w
(
m
/s
)
L
a
k
e
L
e
v
e
l
(m
)
observ ed OutFlow Observ ed Lak e Level
Figure 1 Time Series Plot of observed Outflow and Lake Level
Year Month
2003 1997
1991 1985
1979 1973
Jan Jan
Jan Jan
Jan Jan
700
600
500
400
300
200
100
0
4.0
3.5
3.0
2.5
2.0
1.5
1.0
O
u
tf
lo
w
(
m
/s
)
L
a
k
e
L
e
v
e
l
(m
)
O ut Flow Lak e Lev el
[image:3.612.121.500.441.705.2]Table 1. Statistical characteristics of naturalized Outflow from Lake Tana catchment
Average (Mm3
)
Std.Dev (Mm3
)
Coefficient of variation (%)
Minimum (Mm3
)
Maximum(Mm3
) Skewness
Jan 71.58 16.24 22.68 35.78 106.18 0.04
Feb 47.45 11.77 24.80 21.20 73.80 0.02
Mar 31.58 8.63 27.33 16.02 50.10 0.28
Apr 19.44 3.99 20.54 12.44 28.84 0.31
May 13.86 2.65 19.13 8.56 19.46 0.09
Jun 13.96 4.75 34.01 6.52 27.24 0.79
Jul 37.25 17.25 46.30 11.55 71.83 0.54
Aug 176.5 84.3 47.74 63.7 330.0 0.51
Sep 334.6 136.4 40.76 160.7 638.1 0.59
Oct 302.9 99.6 32.89 134.0 543.7 0.56
Nov 190.45 57.48 30.18 106.18 307.82 0.41
Dec 120.98 33.17 27.41 69.63 193.53 0.56
65 60 55 50 45 40 35 30 25 20 15 10 5 1 1.0 0.8 0.6
0.4 0.2
0.0 -0.2 -0.4
-0.6
-0.8 -1.0
Lag
A
u
to
c
o
rr
el
at
io
[image:4.612.118.480.79.206.2]n
Figure 3 Autocorrelation Function for Deseasolized Outflow time series
(with 5% significance limits for the autocorrelations)
65 60 55 50 45 40 35 30 25 20 15 10 5 1 1.0 0.8 0.6 0.4
0.2 0.0 -0.2
-0.4 -0.6 -0.8
-1.0
Lag
P
a
rt
ia
l
A
u
to
c
o
rr
e
la
ti
o
[image:4.612.136.464.370.727.2]n
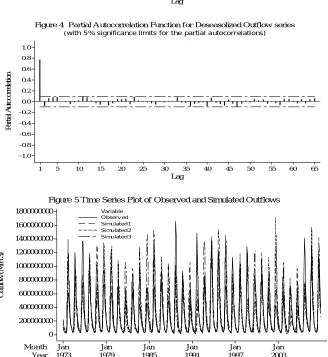
Figure 4 Partial Autocorrelation Function for Deseasolized Outflow series
(with 5% significance limits for the partial autocorrelations)
1800000000
1600000000
1400000000
1200000000
1000000000
800000000
600000000
400000000
200000000
0
O
u
tf
lo
w
(
M
m
^3
)
O bserv ed Simulated1 Simulated2 Simulated3 Variable
Figure 5 Time Series Plot of Observed and Simulated Outflows
Following the data quality and characteristics assessments an attempt was made to model the Outflow series. The naturalized Outflow series as shown in Figure 2 has a clear seasonality. Hipel et al. (1994) have recommended the use of deseasonalized models for such kind of time series. The series is then deseasonalized by subtracting the seasonal mean from each season and also dividing this by the seasonal standard deviation. Plots of the autocorrelation function and partial autocorrelation functions of deseasonalized series, shown in Figure 3 and 4, are used to identify the suitable candidate models. Finally, the adequacy of the selected model in describing the time series under consideration has been assessed and ensured by examining graphs of the residual autocorrelation function, partial autocorrelation function and normality plots.
RESULT AND DISCUSSION
The modelling process shows that the deseasonalized volume metric Outflow series from Lake Tana catchment can be adequately represent by first order Autoregressive model, AR(1). Values of the model parameters, Ø1 and σa2, are
estimated and found to be 0.7845 and 0.612 respectively. It is a good evidence and example for the scientific community in the area of stochastic hydrology that the presence of storage like Lake Tana has an effect on serial correlations of the outflow series. Synthetic seasonal series of the Outflow can be generated by invoking an inverse deseasonalization process. This can be performed by multiplying the generated deseasonalized series by each season standard deviation and adding the mean of each season. For this purpose the mean and standard deviation of each season shown in Table 1 can be applied. Plots of observed and simulated outflow series are shown in Figure 5. The characteristics and performance measuring indices of the Lake can then be assessed with current and what if scenario based approaches by applying certain level of reduction on its net supply capacity.
REFERENCES
Box, George E. P.; Jenkins, Gwilym M.; Reinsel, Gregory C. 1994. Time series analysis. Forecasting and control. 3rd. Englewood Cliffs: Prentice Hall.
Chebud, Yirgalem A.; Melesse, Assefa M. 2009. Modelling lake stage and water balance of Lake Tana, Ethiopia. In
Hydrol. Process 23 (25), pp. 3534–3544.
Dahmen, E. R.; Hall, M. J. 1990. Screening of hydrological data. Tests for stationarity and relative consistency. Wageningen, the Netherlands: International Institute for Land Reclamation and Improvement.
Jain, S. K.; Singh, V. P. 2003. Water resources systems planning and management. 1st. Amsterdam, Boston: Elsevier.
Kebede, S.; Travi, Y.; Alemayehu, T.; Marc, V. 2005. Water Balance of Lake Tana and Its sensitivity to Fluctuations in Rainfall, Blue basinn, Ethiopia. In Journal of
Hydrology, 316, pp. 233-247.
Loucks, Daniel P. 2000. Sustainable Water Resources Management. In water International, 25 (1), pp. 3–10. Ministry of Finance and Economoc Development (MoFED).
2006. A Plan for Accelerated and Sustained developmnet to End Poverty (PASDEP). Addis Ababa.
Rientjes, T. H. M.; Perera, B. U. J.; Haile, A. T.; Reggiani, P.; Muthuwatta, L. P. (2011): Regionalisation for lake level simulation – the case of Lake Tana in the Upper Blue Nile, Ethiopia. In Hydrol. Earth Syst. Sci 15 (4), pp. 1167–1183.
Salas, J. D. 1980. Applied modeling of hydrologic time series. Littleton, Colo: Water Resources Publications.
SMEC. 2008a. Hydrological Study of the Tana-Beles Sub-Basins. Hydrological monitoring network review and recommendations. SMEC international Pty Ltd. Addis Ababa.
SMEC. 2008b. Hydrological Study of the Tana-Beles Sub-Basins. Surface Water Inverstigation. SMEC international Pty Ltd. Addis Ababa.
SMEC. 2008c.: Hydrological Study of the Tana-Beles Sub-Basins. Ecological Studies with Emphasis on Biological Resources. SMEC international Pty Ltd. Addis Ababa. Thomas, R.K.; Dan, R. 2004. Choice of reliability, resilience
and vulnerability estimators for risk assessments of water resources systems. In Hydrological Sciences.
Vogel, R.M.;Bolognese, R.A. 1995. Storage-reliability-resilience- yield relations for over-year water supply systems. Water resources research, pp. 645-654.
Wale, A.; Rientjes, T. H. M.; Gieske, A. S. M.; Getachew, H. A. 2009. Ungauged catchment contributions to Lake Tana's water balance. In Hydrol. Process.
Wilcox, Rand R. 2009. Basic Statistics. Understanding Conventional Methods and Modern Insights. New York: Oxford University press.
Wurbs, R.A; Bergman, C.A .1990. Evaluation of Factors Affecting Reservoir Yield Estimates. In Journal of
Hydrology, 112, pp. 219–235.