ISSN Print: 2161-7570
DOI: 10.4236/ojg.2018.86032 Jun. 14, 2018 529 Open Journal of Geology
Thickness Variations in the Lithospheric
Mantle and the Low Velocity Zone of the
Adamawa Plateau (Cameroon) from
Teleseismic Receiver Functions
Serge H. Pokam Kengni
1,2*, Charles T. Tabod
1,2, Eric N. Ndikum
1,3, Alain-Pierre Kamga Tokam
1,
Pascal Gounou Pokam
11Department of Physics, Faculty of Science, University of Yaounde I, Yaounde, Cameroon 2Department of Physics, Faculty of Science, The University of Bamenda, Bamenda, Cameroon 3Department of Physics, HTTC Bambili, The University of Bamenda, Bamenda, Cameroon
Abstract
Teleseismic events recorded by stations located in the Adamawa Plateau have been treated using the inversion method of receiver functions. These six sta-tions are part of a network of 32 large strip seismic stasta-tions installed in Ca-meroon between 2005 and 2007. This method allowed us to investigate the li-thospheric mantle in that region. The results obtained from the velocity model have been compared to some existing results in this region. These results show the existence of a thick crust having an average thickness of about 35.2 km and a corresponding S wave velocity of 3.7 km/s. For an average S wave veloc-ity of 4.4 km/s the lithospheric mantle appears to be thin in nature and has a thickness that varies from 39 km and 49.6 km. Beyond the lower lithospheric mantle, there exists a low velocity zone, whose thickness varies between 20 km and 43.9 km. The variation of the low velocity zone leads to variation of the lower boundary of the lithospheric mantle boundary at the depths ranging from 73.8 km and 85 km.
Keywords
Low Velocity Zone, Receiver Function, Teleseismic, Lithospheric Mantle, Adamawa Plateau
1. Introduction
Situated between latitudes 6˚ and 8˚ North and longitudes 11˚ and 16˚ East, the How to cite this paper: Kengni, S.H.P.,
Tabod, C.T., Ndikum, E.N., Kamga Tokam, A.-P. and Pokam, P.G. (2018) Thickness Variations in the Lithospheric Mantle and the Low Velocity Zone of the Adamawa Plateau (Cameroon) from Teleseismic Receiver Functions. Open Journal of Geol-ogy, 8, 529-542.
https://doi.org/10.4236/ojg.2018.86032
Received: May 7, 2018 Accepted: June 11, 2018 Published: June 14, 2018
Copyright © 2018 by authors and Scientific Research Publishing Inc. This work is licensed under the Creative Commons Attribution International License (CC BY 4.0).
DOI: 10.4236/ojg.2018.86032 530 Open Journal of Geology Adamawa plateau in Cameroon (Figure 1) presents itself like a volcanic axis characterized by region of the fissured basaltic volcanism. The fault leaving Foumban joins this region and cuts across it nearly diagonal. It can also be noted that, this region is one of the zones in Cameroon where one can meet several geological accidents.
The basement of this region consists of a Precambrian magmatic gneiss com-plex (Figure 1) that recorded Pan-African granitization [2]. That basement is overlain by a sequence of basaltic to andesitic lavas that are largely of Tertiary age [3]. These lavas are essentially alkaline indicating an affinity to continental rifts [4]. The sedimentary formations here are mainly composed of conglome-rates and marl of the Cretaceous Mbere and Djerem Troughs, [3] [5]. These formations have undergone intense tectonic activities resulting in the displace-ment of basin structures which were frequently filled by volcanic material up-welling through deep fractures in the Adamawa region. Three major tectonic structures are associated with the Adamawa plateau: the Cameroon Volcanic Line (CVL), the Foumban Shear Zone (FSZ) and the South Adamawa Trough
(Figure 1). The FSZ is part of the Central African Shear Zone (CASZ), which is a
[image:2.595.259.486.567.671.2]succession of major Pan-African faults, trending ENE-WSW and extending over about 2000 km from Cameroon to Sudan [6] [7]. This shear zone in Central Cameroon is characterized by a wide band of mylonites that display a dextral sense of displacement [2] [7]. In a pre-opening of the South Atlantic, these faults extend towards western Brazil through the Pernambuco fault [8]. The South Adamawa Trough corresponds to the Cretaceous Mbere and Djerem sedimen-tary basins, limited to the North by the CASZ and characterized by conglome-rates and mylonites localized along the fault zone [3] [9]. Two areas of seismicity exit, one of which is linked to Foumban fault and crosses the Adamawa Plateau while the other is associated with the north border of the Congo Craton. A ma-jority of the earthquakes recorded in the Adamawa plateau region are generally in relation with the activity of the Volcanic Line of Cameroon [10]. The gravity analysis in the area by [11] highlighted a N70˚ trending anomaly coinciding with the strike of the fractures affecting the basement [12] used joint inversion of Rayleigh wave group velocities and receiver functions to study the structure of
DOI: 10.4236/ojg.2018.86032 531 Open Journal of Geology the crust beneath Cameroon. The lithosphere beneath Cameroon is characte-rised by a heterogeneous crust with a relatively constant thickness and a low ve-locity uppermost mantle at the edge of the Congo Craton [13].
Previous geophysical research works studied the lithosphere without estab-lishing its boundary and depth. This study will strive at examining the boundary of the lithosphere.
2. Data and Methodology
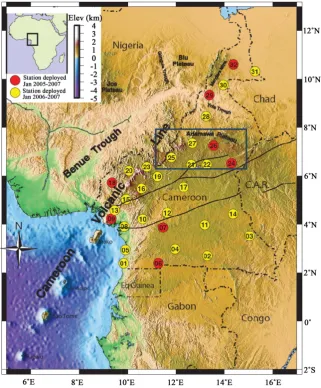
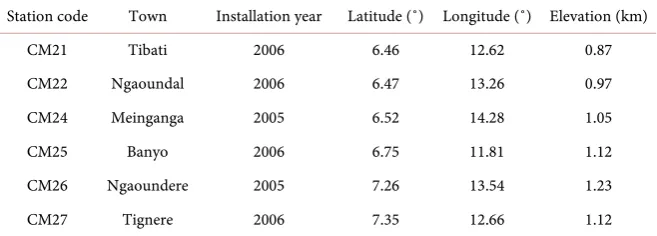
[image:3.595.212.534.294.683.2]The data used for this study were recorded between January 2005 and February 2007 by the Cameroon Broadband Seismic Experiment, which consisted of 32 portable broad-band seismometers installed across the country (Figure 2). Each station (Table 1) was equipped with a broad-band seismometer (Guralp CMG-3T or Streckeisen STS-2), a 24-bit Reftek digitizer and a GPS (Global Posi-tioning System) clock.
DOI: 10.4236/ojg.2018.86032 532 Open Journal of Geology Table 1. Characteristics of the different stations used to record the teleseismic events.
Station code Town Installation year Latitude (˚) Longitude (˚) Elevation (km)
CM21 Tibati 2006 6.46 12.62 0.87
CM22 Ngaoundal 2006 6.47 13.26 0.97
CM24 Meinganga 2005 6.52 14.28 1.05
CM25 Banyo 2006 6.75 11.81 1.12
CM26 Ngaoundere 2005 7.26 13.54 1.23
CM27 Tignere 2006 7.35 12.66 1.12
Data were recorded continuously at a rate of 40 samples per second. In the study area, two stations (red color) were installed in 2005 January and operated during 2 years; the remaining four stations (yellow color) operated only during the second year of the experiment. The station spacing during the second year (2006) of operation was about 50 to 150 km.
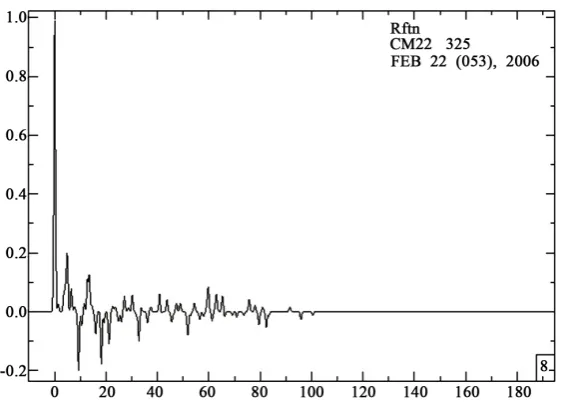
Data from the Cameroon Broadband Seismic Experiment have been used to perform inversion of P-wave receiver functions. Receiver functions are chrono-logical temporal series computed using the seismic components recorded at the large band station. They are generated by the time domain iterative deconvolu-tion method of [14], applied to seismograms rotated into vertical, radial and transverse components and can be used to image velocity contrasts across dis-continuities.
2.1. Estimation of the Receiver Functions
Receiver functions were computed using data from teleseismic events (Table 2) that occurred at epicentral distances between 30˚ and 95˚ with magnitudes ≥5.5.
To compute the receiver functions, visual inspection is first applied in order to confirm the presence of the signal and if the different types of waves which ap-pear on the three components of the seismogram can be identified (Figure 3).
DOI: 10.4236/ojg.2018.86032 533 Open Journal of Geology Figure 3. Three components of seismogram recorded at station CM22 for event of 22/02/2016.
Figure 4. Example of the receiver function computed from station CM22 us-ing teleseismes events. The horizontal axis represents the time in second (s) while the vertical axis represents the amplitude of P-wave in meter (m).
Table 2. Events with magnitude Mb ≥ 5.5 used for the study.
Event date
[image:5.595.211.538.560.734.2]DOI: 10.4236/ojg.2018.86032 534 Open Journal of Geology
2.2. Inversion of the Receiver Functions
Receiver functions are traditionally inverted to obtain an S-wave velocity model that produces an estimation of shear velocity structure under a given seismic sta-tion. There is no guarantee that a unique inversion result will be obtained, as the method seeks to minimize the differences between observed and synthetic re-ceiver functions. The inversion was performed using the method developed by
[16] [17]. The method is based on a linearized inversion procedure that
mini-mizes a weighted combination of least squares norms for each data set, a model roughness norm and a vector-difference norm between inverted and pre-set model parameters. The velocity models obtained are consequently a compromise between fitting the observations, model simplicity and a priori constraints. The starting model used in this inversion consisted of an isotropic medium of con-stant velocity layers that increase in thickness with depth. The thicknesses of the first, second and third layers are, respectively, 45 km, 90 km and 80 km, while the thickness increases at each instant to 5 km between 0 and 45 km depth, to 10 km between 45 and 135 km and 20 km below a depth of 135 km and a linear shear wave velocity increase in the crust from 3.2 to 4.0 km/s and 4.0 to 4.7 km/s in the lithospheric mantle overlying a flattened PREM (Preliminary Reference Earth Model) model [18] for the mantle.
3. Results and Discussion
3.1. Results
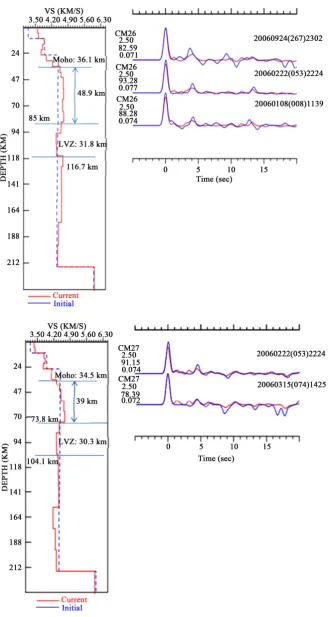
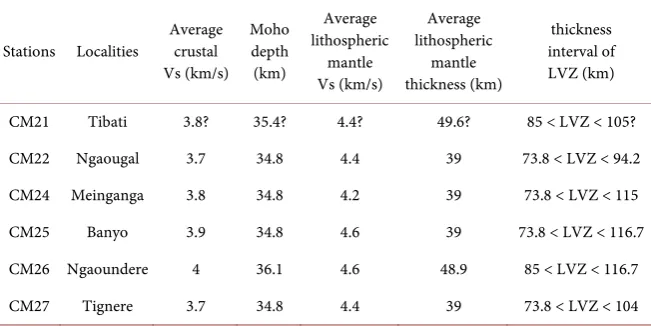
Results from the inversion of the receiver functions computed for the six stations studied are shown in Figure 5. The interpretations are summarized in Table 3
and Table 4 presented a head.
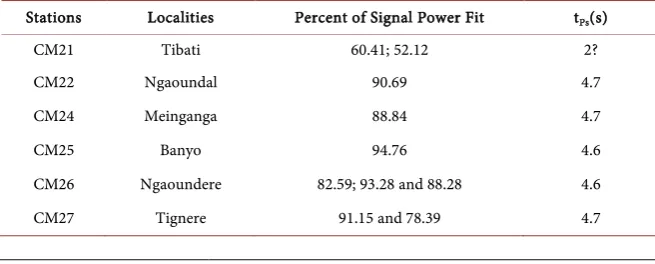
Table 3 summarizes the main information given by the curves of the synthetic
[image:6.595.209.537.608.740.2]receiver functions above and Table 4 regroups the main information that the velocity model curves convey.
Table 3 shows that the synthetic receiver functions have very important
per-cent of Signal Power Fit (>80%) apart of that corresponding to CM21 located at Tibati. This justifies a stability of the curves of current and initial model and it causes the wave to undergo a rare conversion. The times of Ps conversion (tPs) are practically uniform at close to 0.2 s.
Table 3. Interpretation of synthetic receiver functions.
Stations Localities Percent of Signal Power Fit tPs(s)
CM21 Tibati 60.41; 52.12 2?
CM22 Ngaoundal 90.69 4.7
CM24 Meinganga 88.84 4.7
CM25 Banyo 94.76 4.6
CM26 Ngaoundere 82.59; 93.28 and 88.28 4.6
DOI: 10.4236/ojg.2018.86032 538 Open Journal of Geology Table 4. Interpretation of the inversion curves.
Stations Localities Average crustal Vs (km/s) Moho depth (km) Average lithospheric mantle Vs (km/s) Average lithospheric mantle thickness (km) thickness interval of LVZ (km)
CM21 Tibati 3.8? 35.4? 4.4? 49.6? 85 < LVZ < 105? CM22 Ngaougal 3.7 34.8 4.4 39 73.8 < LVZ < 94.2 CM24 Meinganga 3.8 34.8 4.2 39 73.8 < LVZ < 115 CM25 Banyo 3.9 34.8 4.6 39 73.8 < LVZ < 116.7 CM26 Ngaoundere 4 36.1 4.6 48.9 85 < LVZ < 116.7 CM27 Tignere 3.7 34.8 4.4 39 73.8 < LVZ < 104
Table 4 shows from the velocity models that the mean velocity of the S waves
is 3.7 km/s in the crust and more than 4 km/s in the lithospheric mantle. Dis-continuities are localized; firstly at an average depth 35.1 km between for the crust and upper mantle (Moho) and secondly with variation from 73.8 km to 85 km at the boundary between the lithospheric and asthenosphere. The lithos-pheric mantle and the low velocity zone thicknesses varies between 39 km and 49.6 km and between and 73.8 km and 116.7 km respectively.
3.2. Discussions
3.2.1. Comparison of the Synthetic Receiver Function by Localities Comparing the different synthetics receivers functions, it is observed that the current (red colour) and initial (blue color) synthetic receiver functions are sta-ble (Percent of Signal Power Fit is more than 80%) and the time of Ps conversion phase practically homogeneous at 0.2 s except for CM21 located at Tibati where they are not stable. This non stability would be due to the Foumban shear fault that crosses the Tibati locality.
3.2.2. Comparison with Previous Estimates
The uniformity of the time of Ps conversion at the level of the moho (Table 3) and the low amplitudes as seen on the synthetic receiver functions suggest a homogenous nature of the crust in the Adamawa plateau region Tokam et al.
(2010). The small length interval of the secondary wave velocity Vs at the crust and lithospheric mantle expresses the fact that the lithospheric mantle is thin in the Adamawa plateau region.
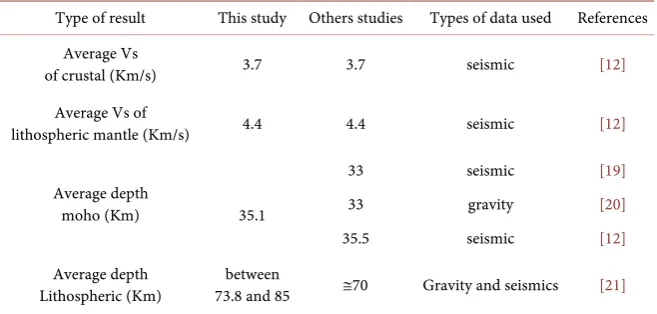
Comparison with the previous estimations are showed in Table 5.
Table 5 shows that, estimates of average S-wave velocity Vs in the crust and
DOI: 10.4236/ojg.2018.86032 539 Open Journal of Geology Table 5. Comparing with previous estimates.
Type of result This study Others studies Types of data used References Average Vs
of crustal (Km/s) 3.7 3.7 seismic [12]
Average Vs of
lithospheric mantle (Km/s) 4.4 4.4 seismic [12]
Average depth
moho (Km) 35.1
33 seismic [19]
33 gravity [20]
35.5 seismic [12]
Average depth
Lithospheric (Km) 73.8 and 85 between ≅70 Gravity and seismics [21]
3.2.3. Comparison the Lithospheric Mantle and the Thickness Low Velocity Zone (LVZ) of Different Localities
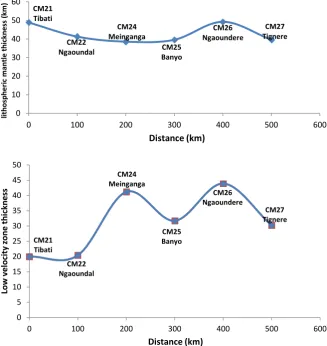
A comparison of the lithospheric mantle and low velocity zone thickness (LVZ) for localities in the Adamawa plateau region is shown in Figure 6.
These figures show that the lithospheric mantle and low velocity zone thick-nesses are not uniform in this region but that they are variable which also entails a variation of the depth of the lithospheric mantle in this region.
4. Conclusions
DOI: 10.4236/ojg.2018.86032 540 Open Journal of Geology Figure 6. Comparison the lithospheric mantle thickness and the thickness Low velocity zone (LVZ) of different localities.
Acknowledgements
We wish to express our gratitude to the team and sponsor of the Cameroon broadband seismic experiment for the data that was colled and has been used in this work.
References
[1] Ngnotué, T., Nzenti, J.P., Barbey, P. and Tchoua, F.M. (2000) The Ntui-Betamba High Grade Gneisses in Cameroon. Journal of African Earth Sciences, 31, 369-381. https://doi.org/10.1016/S0899-5362(00)00094-4
[2] Dumont, J.F. (1987) Etude structurale des bordures Nord et Sud du plateau de l’Adamaoua: Influence du contexte atlantique. Géodynamique,2, 55-68.
[3] Le Maréchal, A. and Vincent, P.R. (1971) Le fossé crétacé du Sud Adamaoua (Cameroun). Office de la Recherche Scientifique et Technique outre-mer: Série Géologie (Cahiers O.R.S.T.O.M.: Série Géologie),3, 67-83.
[4] Kampunzu, A.B., Caron, J.H. and Lubala, R.T. (1986) The East African Rift, Magma Genesis and Astheno-Lithospheric Dynamism. Episodes,9, 211-216.
[5] Lasserre, M. (1961) Étude géologique de la partie orientale de l’Adamaoua (Cameroun Central) et les principales sources minéralisées de l’Adamaoua. Bulletin
CM21 Tibati CM22 Ngaoundal CM24 Meinganga CM25 Banyo CM26 Ngaoundere CM27 Tignere 0 10 20 30 40 50 60
0 100 200 300 400 500 600
lit ho sp he ric m an tle th ic kn es s ( km) Distance (km) CM21 Tibati CM22 Ngaoundal CM24 Meinganga CM25 Banyo CM26 Ngaoundere CM27 Tignere 0 5 10 15 20 25 30 35 40 45 50
0 100 200 300 400 500 600
DOI: 10.4236/ojg.2018.86032 541 Open Journal of Geology de la Direction Mines et Geologie du Cameroun, No. 4, 130 p.
[6] Cornacchia, M. and Dars, R. (1983) Un trait structural majeur du continent africain. Les linéaments centrafricains du Cameroun au Golfe d’Aden. Bulletin de la Société Géologique de France,25, 101-109. https://doi.org/10.2113/gssgfbull.S7-XXV.1.101 [7] Ngako, V., Jegouzo, P. and Nzenti, J.P. (1991) Le Cisaillement Centre Camerounais.
Rôle structural et géodynamique dans l’orogenèse panafricaine. Compte Rendus de l’Academie des sciences de Paris, t. 313, sér. II, 457-463.
[8] De Almeida, F.F.M., Hasui, Y., Brito Neves, B.B. and Fuck, R. (1991) Brasiliano Structural Provinces: An Introduction. Earth Science Reviews,17, 1-29.
https://doi.org/10.1016/0012-8252(81)90003-9
[9] Ngangom, E. (1983) Etude tectonique du fossé de la Mbéré et du Djerem, Sud Adamaoua. In: Popoff, M. and Tiercelin, J.J., Eds., Rifts et fossés anciens, Centres de Recherches e Exploration-Production Elf-Aquitaine Pau, Vol.7, 339-347.
[10] Tabod, C.T., Fairhead, J.D., Stuart, G.W., Ateba, B. and Ntepe, N. (1992) Seismicity of the Cameroon Volcanic Line, 1982-1990. Tectonophysics,212, 303-320. https://doi.org/10.1016/0040-1951(92)90297-J
[11] Noutchogwe, T.C., Tabod, C.T. and Manguelle-Dicoum, E. (2006) A Gravity Study of the Crust Beneath the Adamawa Fault Zone, West Central Africa. Journal of Geophysics and Engineering,3, 82-89. https://doi.org/10.1088/1742-2132/3/1/009 [12] Tokam, A., Tabod, C.T., Nyblade, A.A. and Julià, J. (2010) Structure of the Crust
beneath Cameroon, West Africa, from the Joint Inversion of Rayleigh Wave Group Velocities and Receiver Functions. Geophysical Journal International, 183, 1061-1076. https://doi.org/10.1111/j.1365-246X.2010.04776.x
[13] Guidarelli, M. and Aoudia, A. (2016) Ambient Noise Tomography of the Cameroon Volcanic Line and Northern Congo Craton: New Constraints on the Structure of the Lithosphere. Geophysical Journal International,204, 1756-1765.
https://doi.org/10.1093/gji/ggv561
[14] Ligorría, J.P. and Ammon, C.J. (1999) Iterative Deconvolution and Receiver Func-tion EstimaFunc-tion. Bulletin of the Seismological Society of America, 89, 1395-1400. [15] Julià, J. (2007) Constraining Velocity and Density Contrasts across the Crust:
Man-tle Boundary with Receiver Function Amplitudes. Geophysical Journal Internation-al,171, 286-301. https://doi.org/10.1111/j.1365-2966.2007.03502.x
[16] Julià, J., Ammon, C.J., Herrmann, R.B. and Correig, A.M. (2000) Joint Inversion of Receiver Function and Surface Wave Dispersion Observations. Geophysical Journal International,143, 99-112.https://doi.org/10.1046/j.1365-246x.2000.00217.x [17] Julià, J., Ammon, C.J. and Herrmann, R.B. (2003) Lithospheric Structure of the
Arabian Shield from the Joint Inversion of Receiver Functions and Surface Wave Group Velocities. Tectonophysics,371, 1-21.
https://doi.org/10.1016/S0040-1951(03)00196-3
[18] Dziewonski, A.M. and Anderson, D.L. (1981) Preliminary Reference Earth Model.
Physics of the Earth and Planetary Interiors,25, 297-356.
[19] Stuart, G.W., Fairhead, J.D., Dorbath, L. and Dorbath, C. (1985) A Seismic Refrac-tion Study of the Crustal Structure Associated with the Adamawa Plateau and Ga-roua Rift, Cameroon, West Africa. Geophysics Journal Royal Astronomical Society, 81, 1-12.https://doi.org/10.1111/j.1365-246X.1985.tb01346.x
DOI: 10.4236/ojg.2018.86032 542 Open Journal of Geology
887-901.https://doi.org/10.1016/S0899-5362(00)00058-0
[21] Plomerova, J., Babuska, V., Dorbath, L., Dorbath, R. and Lillie, R.J. (1993) Deep Li-thospheric Structure across the Central African Shear Zone in Cameroon. Geo-physical Journal International,115, 381-390.
![Figure 1. Geologic map of study area (modified frompanafrican Gneiss; 4: Panafrican Metasediments; 5: Envelope of cretaceous sediments; 6: paleoproterozoic gneiss; 2: Syn-tectonic panafrican granite; 3: Principal undifferentiated [1])](https://thumb-us.123doks.com/thumbv2/123dok_us/9285799.423162/2.595.259.486.567.671/frompanafrican-panafrican-metasediments-cretaceous-paleoproterozoic-panafrican-principal-undifferentiated.webp)