ISSN Online: 2168-5444 ISSN Print: 2168-5436
DOI: 10.4236/ijmpcero.2018.72012 May 4, 2018 141 Int. J. Medical Physics, Clinical Engineering and Radiation Oncology
Experimental Evaluation of CT Number
Changes in 320-Row CBCT Volume
Scan for Proton Range Calculation
Ryuta Hirai
1,2*, Ryosuke Kohno
3, Yu Kumazaki
2, Tetsuo Akimoto
4,
Hidetoshi Saitoh
5, Shingo Kato
1,21Department of Radiation Oncology, Saitama Medical University, Saitama, Japan
2Department of Radiation Oncology, Saitama Medical University International Medical Center, Saitama, Japan 3The University of Texas, MD Anderson Cancer Center, Houston, TX, USA
4Division of Particle Therapy, National Cancer Center Hospital East, Chiba, Japan
5Division of Radiological Sciences, Faculty of Health Sciences, Tokyo Metropolitan University, Tokyo, Japan
Abstract
We investigated the longitudinal positional dependence of CT number in 320-row Cone Beam Computed Tomography (CBCT) volume scan (320-row volume scan) using a simple geometric phantom (SGP) and a chest simulation phantom (CSP) in order to evaluate its effect on proton range calculation. The SGP consisted of lung substitute material (LSM) and a cylindrical phantom (CP) made of high-density polyethylene. The CSP was an anthropomorphic phantom similar to the human chest. The two phantoms were scanned using 320-row volume scan in various longitudinal positions from the central beam axis. In experiments using the SGP, an image blur at the boundary of the two materials became gradually evident when the LSM was placed far away from the beam central axis. The image blur of the phantom was consistent with the gradation in CT number. The maximum difference in CT numbers between the 64-row helical scan and 320-row volume scan at the boundary of the two materials was consistent with approximately 50% of the relative proton stop-ping power. In contrast, the CT number profile in each longitudinal position was fairly consistent and longitudinal positional dependence rarely occurred in the CSP experiments. Pass lengths of CT beams through areas with widely different electron densities were shorter, and thus did not significantly impact CT numbers. Based on findings from the CSP experiments, we considered 320-row volume scan to be feasible for proton range calculation in clinical set-tings, although the relatively large longitudinal positional dependence of CT number should be accounted for when doing so.
How to cite this paper: Hirai, R., Kohno, R., Kumazaki, Y., Akimoto, T., Saitoh, H. and Kato, S. (2018) Experimental Evaluation of CT Number Changes in 320-Row CBCT Volume Scan for Proton Range Calculation. International Journal of Medical Physics, Clinical Engineering and Radiation Oncology, 7, 141-150.
https://doi.org/10.4236/ijmpcero.2018.72012
Received: February 26, 2018 Accepted: May 1, 2018 Published: May 4, 2018
Copyright © 2018 by authors and Scientific Research Publishing Inc. This work is licensed under the Creative Commons Attribution International License (CC BY 4.0).
DOI: 10.4236/ijmpcero.2018.72012 142 Int. J. Medical Physics, Clinical Engineering and Radiation Oncology
Keywords
320-Row CBCT Volume Scan, CT Number, Proton Range, Relative Stopping Power
1. Introduction
320-row Cone Beam Computed Tomography (CBCT) volume scan (320-row volume scan) has 320 detector rows in the longitudinal direction, which enables a scan with a width of 16 cm (±8 cm from the beam central axis) at 0.275 s/rotation. This method offers high time-resolution, because temporal errors can be minimized. Diagnostically, 320-row volume scan has been used for various types of imaging such as coronary CT angiography and myocardial blood flow assessments [1] [2].
320-row volume scan may also be useful in the field of radiation therapy. Some studies have reported on 4D photon and proton treatment planning using helical or conventional 4DCT images [3] [4] [5]. In general, 16 to 64-row CT helical scan is used for photon/proton treatment planning, but 320-row volume scan is rarely used. Indeed, only a few studies have reported on the use of 320-row volume scan for motion assessment of a moving target in radiation therapy planning [6]. To the best of our knowledge, no report has used 320-row volume scan for dose calculations. 320-row volume scan has the potential to ob-tain more accurate 4DCT images than helical or conventional CT, and may be useful in 4D proton treatment planning.
However, since 320-row volume scan has certain characteristics that differ from helical and conventional scans, its effects on CT number must be examined prior to clinical use. For instance, the imaging range per rotation in 320-row vo-lume scan is wider than that for helical or conventional 4DCT, because the de-tector rows increase longitudinally. As X-ray intensity on the cathode side dif-fers from that on the anode side of the X-ray tube, changes in CT number in the longitudinal position may occur due to this heel effect [7]. In addition, the large cone angle of 320-row volume scan may affect the CT image, especially in areas distant from the beam central axis. These factors may cause inaccurate image reconstruction [8]. Therefore, a thorough evaluation of the feasibility of 320-row volume scan for clinical use in proton treatment planning is war-ranted.
DOI: 10.4236/ijmpcero.2018.72012 143 Int. J. Medical Physics, Clinical Engineering and Radiation Oncology
2. Materials and Methods
2.1. Simple Geometric Phantom Experiment
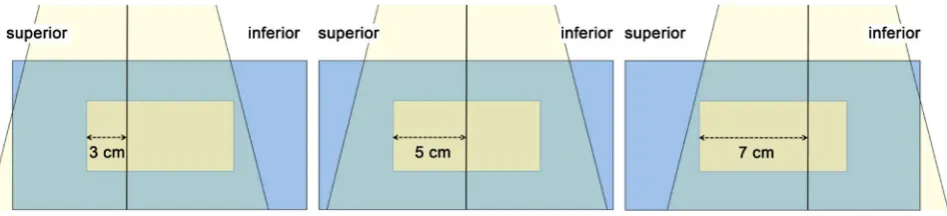
A simple geometric phantom (SGP) was prepared to compare CT number pro-files for 320-row volume scan and 64-row helical scan as the reference. The in-spiratory phase of the lung substitute material (LSM) (LN-300: Gammex, FL, USA) was inserted into a cylindrical phantom (CP) made of high-density polye-thylene (Niporon Hard®: Tosoh, Tokyo, Japan) (Figure 1). The longitudinal
edge position of the LSM was changed from 3 cm to 7 cm superior to the beam central axis in 1-cm increments (Figure 2).
[image:3.595.213.535.348.486.2]This study used CT equipment (Aquilion ONETM: Toshiba Medical Systems, Tochigi, Japan) and scanned the phantom with two scan modes, including a vo-lume scan using a 320-row detector and a helical scan using a 64-row detector by static scans. Scan conditions for both were 120 kV, 500 mA, 0.5 s exposure time per rotation, and 0.5 mm slice thickness. Circular regions of interest (ROI) (1 cm in diameter) were placed at the center of the phantom in all CT slices. CT num-ber profiles of the ROI were measured longitudinally in each phantom position as mentioned above. Longitudinal positional dependence of CT numbers
Figure 1. Schematic of the simple geometric phantom (SGP). The SGP consisted of lung substitute material (LSM) (a) and a cylindrical phantom (CP) (b). The LSM was a lung-simulated phantom with a diameter of 5 cm and length of 10 cm, with a physical density of 0.3 g cm−3 and an electron density of 0.976 × 1023 cm−3. The CP was a soft
tis-sue-simulated phantom with a diameter of 19.7 cm and length of 20 cm, with a physical density of approximately 0.95 g cm−3 and an electron density of approximately 3.3 × 10²³
cm−3.
[image:3.595.65.539.589.697.2]DOI: 10.4236/ijmpcero.2018.72012 144 Int. J. Medical Physics, Clinical Engineering and Radiation Oncology was compared between 64-row helical scan and 320-row volume scan.
2.2. Chest Simulation Phantom Experiment
A chest simulation phantom (CSP) (Lung Man: Kyoto Kagaku, Kyoto, Japan) was used to compare CT number profiles of the two scan modes. The phantom was made of polyurethane for the soft tissue and epoxy for the skeleton (Figure 3) and measured 430 mm in width, 480 mm in height, and 940 mm in chest cir-cumference. The simulated tumor (1 cm in diameter) (Tough Water: Kyoto Ka-gaku, Kyoto, Japan) was inserted in an arbitrary position of the CSP lung field.
The phantom was first scanned using 64-row helical scan to obtain reference data by static scan. Second, 320-row volume scan was performed with the beam central axis at the center of the simulated tumor. Following this, other volume scans were performed with the phantom position offset at 6 cm superior or infe-rior from the beam central axis. The ROI was placed in the slice at the center of the simulated tumor (Figure 4). CT number profiles of the ROI were measured, and differences in CT numbers were calculated for the helical scan versus vo-lume scan of each position.
3. Results
3.1. Simple Geometric Phantom Experiment
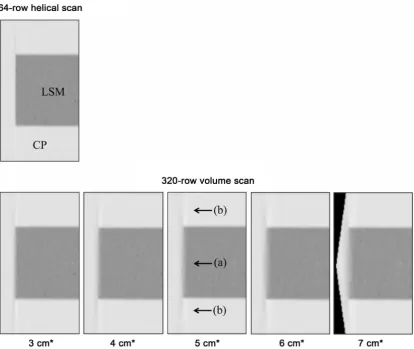
Sagittal CT images of each scan condition are shown in Figure 5. The image blur at the boundary between the CP and the LSM became gradually evident, when the position of the CP moved far away from the beam central axis. A streak-like artifact was also observed at the edge of the LSM.
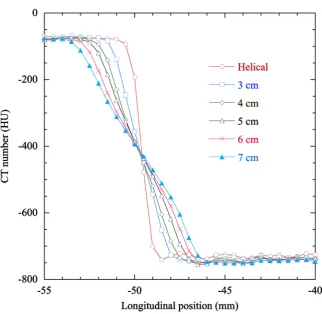
[image:4.595.236.511.510.683.2]CT numbers of the ROI changed from approximately −80 Hounsfield Units (HU) to approximately −750 HU, when the CT slice position was changed from the CP to the LSM. CT number profiles obtained at the edge of the LSM are shown in Figure 6. The image blur of the phantom was consistent with the
DOI: 10.4236/ijmpcero.2018.72012 145 Int. J. Medical Physics, Clinical Engineering and Radiation Oncology Figure 4. Placement of the ROI in the CT image to measure CT number profiles. CT image of the CSP with the simulated tumor (white arrow). The ROI was placed in the slice at the center of the simulated tumor (arrowhead) and CT profiles were obtained.
[image:5.595.94.509.335.684.2]DOI: 10.4236/ijmpcero.2018.72012 146 Int. J. Medical Physics, Clinical Engineering and Radiation Oncology Figure 6. CT number profiles in the SGP. X-axis indicates the longitudinal edge position of the LSM from the beam central axis.
gradual change in CT number, and the blur length was approximately 3.5 mm in 320-row volume scan, when the edge of the LSM was placed 3 cm superior from the beam central axis. When the edge positions were 4 cm, 5 cm, 6 cm, and 7 cm from the beam center, the corresponding blur lengths were 5 mm, 5.5 mm, 6 mm, and 7 mm, respectively. Maximum differences in CT numbers between 64-row helical scan and 320-row volume scan at each phantom position are pre-sented in Table 1. These differences ranged from approximately 160 HU to ap-proximately 260 HU.
3.2. Chest Simulation Phantom Experiment
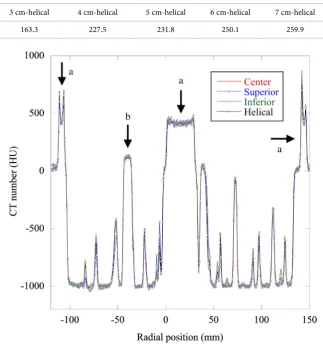
CT number profiles obtained using either 64-row helical scan or 320-row vo-lume scan were fairly consistent across all conditions (Figure 7). Mean values for the differences in CT numbers ranged from 2.5 - 5.2 HU. The number of voxels in which the differences in CT numbers exceeded 100 HU was 16 voxels/364 voxels (4.4%) in the profile.
4. Discussion
DOI: 10.4236/ijmpcero.2018.72012 147 Int. J. Medical Physics, Clinical Engineering and Radiation Oncology Table 1. Maximum differences in CT numbers between 64-row helical scan and 320-row volume scan (HU).
3 cm-helical 4 cm-helical 5 cm-helical 6 cm-helical 7 cm-helical
163.3 227.5 231.8 250.1 259.9
Figure 7. CT number profiles of the CSP. Peak areas of the profiles corresponded to bony structures (a) and the simulated tumor (b).
evident, when the position of the LSM was placed far away from the beam cen-tral axis with 320-row volume scan. The image blur of the phantom was consis-tent with the gradation in CT number (Figure 6).
DOI: 10.4236/ijmpcero.2018.72012 148 Int. J. Medical Physics, Clinical Engineering and Radiation Oncology the stoichiometric calibration method [9] [10] [11]. This difference is consistent with approximately 50% of the relative proton stopping power for this condi-tion, which could affect proton range. In addicondi-tion, the image blur and streak-like artifact may affect delineation of the target volume and organs at risk in treat-ment planning.
In experiments using the CSP, CT number profiles obtained using either 64-row helical scan or 320-row volume scan were fairly consistent across all conditions (Figure 7). CT numbers of the two scan modes were fairly compara-ble even when 320-row volume scans were performed with the phantom posi-tion offset at 6 cm superior or inferior to the beam central axis. The CSP had relatively fine geometry, and we observed shorter pass lengths for the CT beam through areas with widely different electron densities. For this reason, we con-sider the partial volume effect to not have significantly impacted CT numbers in 320-row volume scan. However, the component placed in the phantom was rela-tively small. When a larger component is used, the pass length of the CT beam may be longer, and the image blur could become more evident.
The number of voxels in which the differences in CT numbers was >100 HU comprised only 4.4%, and the mean differences in CT numbers between the two scan modes ranged from 2.5 - 5.2 HU in experiments using the CSP. The mean difference in CT number of 5.2 HU is generally consistent with approximately 1.8% of the proton range for the inspiratory phase of the lung, 1.1% for the ex-piratory phase of the lung, 0.3% for water, and 0.1% for cortical bone for 235 MeV proton beams. When proton beams pass through 5 cm of the inspiratory phase of the lung as they approach the target, a range error of approximately 0.9 mm occurs. This uncertainty in proton range is considered negligible when compared with other factors that induce changes in proton range [13]-[19]. As a result, we consider the changes in CT number when using 320-row volume scan to minimally affect proton range. However, the relatively large longitudinal posi-tional dependence of CT number should be considered.
This study has a limitation regarding proton dose calculations. Given the dif-ficulty of proton dose measurements in a heterogeneous medium, we did not conduct a dosimetric study. Further investigation will be needed to achieve ac-curate proton dose measurements.
5. Conclusion
The uncertainty in proton range caused by the longitudinal positional depen-dence of CT number in 320-row volume scan is considered negligible. Our find-ings from experiments using an anthropomorphic phantom suggest that the in-fluence of 320-row volume scan on proton range calculation in the clinical set-ting is minimal.
Acknowledgements
DOI: 10.4236/ijmpcero.2018.72012 149 Int. J. Medical Physics, Clinical Engineering and Radiation Oncology School of Medicine, Fukushima Medical University) for his assistance.
Funding
This work was supported in part by a grant from Toshiba Medical Systems.
References
[1] Tomizawa, N., Kanno, S., Maeda, E., Akahane, M., Torigoe, R. and Ohtomo, K. (2014) Minimizing the Acquisition Phase in Coronary CT Angiography Using the Second Generation 320-Row CT. Japanese Journal of Radiology, 32, 391-396.
https://doi.org/10.1007/s11604-014-0321-1
[2] Kikuchi, Y., Oyama-Manabe, N., Naya, M., Manabe, O., Tomiyama, Y., Sasaki, T., Katoh, C., Kudo, K., Tamaki, N. and Shirato, H. (2014) Quantification of Myocardi-al Blood Flow Using Dynamic 320-Row Multi-Detector CT as Compared with 15O-H2O PET. European Radiology, 24, 1547-1556.
https://doi.org/10.1007/s00330-014-3164-3
[3] Matsugi, K., Nakamura, M., Miyabe, Y., Yamauchi, C., Matsuo, Y., Mizowaki, T. and Hiraoka, M. (2013) Evaluation of 4D Dose to a Moving Target with Monte Carlo Dose Calculation in Stereotactic Body Radiotherapy for Lung Cancer. Radio-logical Physics and Technology, 6, 233-240.
https://doi.org/10.1007/s12194-012-0193-y
[4] Li, H., Liu, W., Park, P., Matney, J., Liao, Z., Chang, J., Zhang, X., Li, Y. and Zhu, R.X. (2014) Evaluation of the Systematic Error in Using 3D Dose Calculation in Scanning Beam Proton Therapy for Lung Cancer. J Appl Clin Med Phys, 15, 4810.
https://doi.org/10.1120/jacmp.v15i5.4810
[5] Liu, W., Schild, S.E., Chang, J.Y., Liao, Z., Chang, Y., Wen, Z., Shen, J., Stoker, J.B., Ding, X., Hu, Y., Sahoo, N., Herman, M.G., Vargas, C., Keole, S., Wong, W. and Bues, M. (2016) Exploratory Study of 4D versus 3D Robust Optimization in Inten-sity Modulated Proton Therapy for Lung Cancer. International Journal of Radiation Oncology, Biology, Physics, 95, 523-533.
https://doi.org/10.1016/j.ijrobp.2015.11.002
[6] Coolens, C., Bracken, J., Driscoll, B., Hope, A. and Jaffray, D. (2012) Dynamic Vo-lume vs Respiratory Correlated 4DCT for Motion Assessment in Radiation Therapy Simulation. Medical Physics, 39, 2669-2681. https://doi.org/10.1118/1.4704498
[7] Mori, S., Endo, M., Nishizawa, K., Tsunoo, T., Aoyama, T., Fujiwara, H. and Mu-rase, K. (2005) Enlarged Longitudinal Dose Profiles in Cone-Beam CT and the Need for Modified Dosimetry. Medical Physics, 32, 1061-1069.
https://doi.org/10.1118/1.1877852
[8] Coolens, C., Breen, S., Purdie, T.G., Owrangi, A., Publicover, J., Bartolac, S. and Jaf-fray, D.A. (2009) Implementation and Characterization of a 320-Slice Volumetric CT Scanner for Simulation in Radiation Oncology. Medical Physics, 36, 5120-5127.
https://doi.org/10.1118/1.3246352
[9] Schneider, U., Pedroni, E. and Lomax, A. (1996) The Calibration of CT Hounsfield Units for Radiotherapy Treatment Planning. Physics in Medicine & Biology, 41, 111-124. https://doi.org/10.1088/0031-9155/41/1/009
DOI: 10.4236/ijmpcero.2018.72012 150 Int. J. Medical Physics, Clinical Engineering and Radiation Oncology
[11] Kanematsu, N., Matsufuji, N., Kohno, R., Minohara, S. and Kanai, T. (2003) A CT Calibration Method Based on the Polybinary Tissue Model for Radiotherapy Treatment Planning. Physics in Medicine & Biology, 48, 1053-1064.
https://doi.org/10.1088/0031-9155/48/8/307
[12] Inaniwa, T., Tashima, H. and Kanematsu, N. (2017) Optimum Size of a Calibration Phantom for x-Ray CT to Convert the Hounsfield Units to Stopping Power Ratios in Charged Particle Therapy Treatment Planning. Journal of Radiation Research, 1-9.
[13] Schuemann, J., Dowdell, S., Grassberger, C., Min, C.H. and Paganetti, H. (2014) Site-Specific Range Uncertainties Caused by Dose Calculation Algorithms for Pro-ton Therapy. Physics in Medicine & Biology, 59, 4007-4031.
https://doi.org/10.1088/0031-9155/59/15/4007
[14] Chvetsov, A.V. and Paige, S.L. (2010) The Influence of CT Image Noise on Proton range Calculation in Radiotherapy Planning. Physics in Medicine & Biology, 55, 141-149. https://doi.org/10.1088/0031-9155/55/6/N01
[15] Yang, M., Zhu, S.R., Park, P.C., Titt, U., Mohan, R., Virshup, G., Clayton, J. and Dong, L. (2012) Comprehensive Analysis of Proton Range Uncertainties Related to Patient Stopping-Power-Ratio Estimation using the Stoichiometric Calibration.
Physics in Medicine & Biology, 57, 4095-4115.
https://doi.org/10.1088/0031-9155/57/13/4095
[16] Schaffner, B. and Pedroni, E. (1998) The Precision of Proton Range Calculations in Proton Radiotherapy Treatment Planning: Experimental Verification of the Rela-tion between CT-HU and Proton Stopping Power. Physics in Medicine & Biology, 43, 1579-1592.https://doi.org/10.1088/0031-9155/43/6/016
[17] Espana, S. and Paganetti, H. (2011) Uncertainties in Planned Dose Due to the Li-mited Voxel Size of the Planning CT When Treating Lung Tumors with Proton Therapy. Physics in Medicine & Biology, 56, 3843-3856.
https://doi.org/10.1088/0031-9155/56/13/007
[18] Kumazaki, Y., Akagi, T., Yanou, T., Suga, D., Hishikawa, Y. and Teshima, T. (2007) Determination of the Mean Excitation Energy of Water from Proton Beam Ranges.
Radiation Measurements, 42, 1683-1691.
https://doi.org/10.1016/j.radmeas.2007.10.019