Automatic Liver Segmentation from Abdominal MRI
Images using Active Contours
Roaa G. Mohamed
Computer Science Dept,Faculty of Computer & info. Sciences, Ain Shams
University, Cairo 11566, Egypt.
Noha A. Seada
Computer Systems Dept,Faculty of Computer & info. Sciences, Ain Shams
University, Cairo 11566, Egypt.
Salma Hamdy
Computer Science Dept,Faculty of Computer & info. Sciences, Ain Shams
University, Cairo 11566, Egypt.
Mostafa G. M.
Mostafa
Computer Science Dept, Faculty of Computer & info. Sciences, Ain Shams
University, Cairo 11566, Egypt.
ABSTRACT
Automatic segmentation of the liver and hepatic lesions is an important step towards deriving quantitative biomarkers for accurate clinical diagnosis and computer-aided decision support systems. This paper presents a system for the automatic segmentation of the liver from Magnetic Resonance Images (MRI). The system works without the need for setting manual seed points or setting a region of interest. Instead, the proposed system automatically detects and segments the liver through relying on its anatomical features for detection and using active contour for segmentation. The proposed segmentation system begins with localizing the liver or a part of it from a given MRI image using biggest components analysis. The extracted liver part is later used as a mask for full liver segmentation using active contour. The proposed system is fully automatic, works on different cases of MRI images (different sizes, healthy and abnormal liver). The detection and segmentation of the liver succeeded in 95% of the test cases acquired from different MRI imaging modalities.
General Terms
Image processing, Computer Vision.
Keywords
Medical Image Analysis, Automatic Liver Segmentation, Active Contour Model
1.
INTRODUCTION
Segmentation is a term refers to the process of dividing the image into several identical areas in terms of characteristics and features of the image [1], [2] according to some criteria of similarity such as color, density, texture etc.[3]. The result of segmentation depends on the quality of the input image (noise and brightness) [4]. Segmentation depends on a specific condition or a number of specific occurrences up on which the required area could be identified and segmented. There are many image segmentation techniques from which are: edge based, threshold-based and region-based techniques. The technique is chosen based on the type of the image and the problem being considered [5][1][6].These techniques are used to convert image data into meaningful information, depending on the pixels of the image in terms of how to divide the regions and how to merge the neighboring pixels that have the same characteristics of the first pixel selected (seed pixel) [1]. Image segmentation plays a vital role in many image analysis fields like image processing, image retrieval, image compression, image editing, and computer vision. As well as its importance in such diverse fields as educational research, criminal detection and textile industry[7]–[9]. In the medical field, the segmentation is the main and important step in many tasks because of its importance in dividing the image into
different and non-overlapping areas; that assist radiologists in their diagnosis and early detection of various diseases[6][7][10].
The center of human health is the liver and without a healthy liver no one can survive. The liver plays vital roles in almost all body functions. Liver diseases are one of the most common diseases. According to the International Agency for Research on Cancer (IARC), liver cancer is one of the most common causes of death worldwide. Liver disease can be diagnosed accurately using surgical methods (liver biopsy) or using non-surgical methods (medical imaging) [11]. A biopsy is a medical test involving extraction of sample cells or tissues by a needle, for examination to determine the presence or extent of disease commonly performed by a surgeon, interventional radiologist, or an interventional cardiologist. There are many different types of biopsy procedures. Although liver biopsy is the gold standard for diagnosing many liver diseases but it has several limitations for diagnosing some liver lesions [12]. Biopsy procedures are primarily useful for detecting advanced fibrosis only as well as they are insufficiently precise for assessing disease progression or the effect of therapy, whereas novel imaging techniques may assess fibrosis more directly [13]. The diagnosis based on liver biopsy may be confusing; in general it has many drawbacks, such as sampling error, cost, and risk of complications [12].
variation of soft tissue better than others[20]. MRI provides better information for diagnostic purposes and develops a therapeutic response and thus results in more accurate results appreciated by radiologists [21][22]. MRI with specific contrast behaves better than some other image technologies in patients with hepatic metastasis of reduced size [22].
The automatic liver segmentation from abdominal MRI images is important in the medical field since it is the first and essential step to analyze and diagnose liver diseases, perform liver volume measurement and 3D liver volume rendering. Automatic liver segmentation is a very challenging task, due to various factors: first, in MRI abdominal images the liver appears in over than 150 slices of a given MRI study. Second, the irregularity in the liver shape, size and appearance between patients makes it a challenge to build a general model to use for segmentation. Third, the MRI images are grey scale images and the liver shares its intensity distribution with its surrounding organs (e.g., heart, stomach, right kidney and the spleen). This makes it more challenging especially for automatic liver detection. Forth, indefinite shape of the lesions (tumors or other abnormalities) and low intensity contrast between lesions and intensity similarity of the lesions tissues to those of nearby tissues may result in serious intensity inhomogeneity. Finally, several artifacts of pulsation, motion, and partial volume ECTS are also among the variety of factors that make automatic liver segmentation a challenging task [23] [20].
The rest of this paper is organized as follows: Section 2 presents a literature survey for liver segmentation from MRI and CT images. Our proposed system is presented in section 3.Section 4 presents and discusses the experimental results together with performance evaluation of the proposed system. Finally, the conclusion is presented in section 5.
a) CT image b) US image
c)PET image
d)MRI image
Figure1: Types of medical images used for liver diagnosis
2.
RELATED WORK
Automated liver segmentation from MRI and CT abdominal images has been tackled by multiple researchers, who have dealt with the different challenges facing the segmentation process using various methodologies. Oliver Gloger et.al. in [23] presented fully automatic approach to segment liver from MRI images based on using region growing and thresholding techniques. They first applied multi-class linear discriminant analysis as a fast and efficient dimensionality reduction technique and then generated probability maps to be further used for liver segmentation. F. Lopez-Mir et.al in [24] presented a new method for liver segmentation based on the watershed transform and stochastic partitions. They initially selected the first slice to localize the liver and then applied the segmentation algorithm. Finally, based on the liver gray level
properties and the inter-slice location of the adjacent organs, a classifier was implemented to obtain the final mask to segment the liver from all the slices. The experimental results demonstrated the effectiveness of the proposed algorithm. H. Masoumi et.al. in[25] begin their work with preprocessing using edge preserved noise reduction to enhance the image. Their proposed algorithm for liver area extraction is a combined algorithm that uses neural networks and watershed algorithm. D. Chi et.al. in [25] studied an automatic segmentation technique for liver (MR) images based on the self-organizing map (SOM) and hierarchical agglomerative clustering method. In the beginning, the local features of the MRI image pixels are extracted to feed the SOM and then the output prototypes are filtered with the hits map, finally they applied a hierarchical agglomerative clustering method to select the best segmentation according to a quantitative image evaluation index. Seghers et al.[26] Modeled an object as a set of landmarks augmented with local appearance models to perform 3D liver segmentation on 10 cases. I. Singh in [27] focuses on the segmentation of the liver using k-means and Ant Colony Optimization, to optimize the poorly selected k-clusters. High accuracy and specificity was achieved with hybrid Ant Colony and K-means clustering which clearly suggests that the hybrid method is better than k-means clustering. N. H. Abdel-Massieh et.al in [28] presented an automatic method to segment the liver from abdominal CT data where they initially used a statistical model-based approach to distinguish roughly liver tissue from other abdominal organs. Then they applied a force-driven optimized active contour (snake) in order to obtain a smoother and finer liver contour. Yussof and Burkhardt [29] used anisotropic diffusion to filter the original liver volume from 3D CT. Then they applied thresholding to preserve all tissues that have the same intensities for liver. They also performed morphological operators to ultimately obtain a smooth fine liver region with a graph-cut technique. Wimmer et al.[29] proposed a two-stage liver segmentation from CT scans. A manual delineation of cross-sections of the anatomical structure in 2D multi-planer reconstruction views is constructed. Then an initial 3D surface was reconstructed using radial basis functions. Then they applied a level set algorithm incorporating a new combination of image information and shape information. They also evaluated their method on only 10 cases.
Unfortunately there is no universally accepted technique for image segmentation. This is due to the above mentioned factors of images homogeneity, spatial characteristics of the image continuity, partial volume effect, texture, image content etc. Thus there is no single method which can be considered the best for liver segmentation. Accordingly, this paper presents a combination between multiple segmentation techniques that have proven their efficiency and reliability to automatically segment the liver region from sequential MRI image slices. The proposed system succeeded in the segmentation of normal and infected liver with the same efficiency and accuracy.
3.
PROPOSED AUTOMATIC LIVER
SEGMENTATION SYSTEM
The proposed segmentation system is divided into four consecutive stages, each stage containing several steps as in Figure 2. First we enhance the MRI images of a given study; in order to remove noise, enhance edges, and fill regions and holes.
Second we automatically localize the liver in all the MRI image slices where it appears. This is done by first defining a liver mask. At early experimental work, we used the first slices of MRI study to obtain the liver segmentation mask, but the accuracy of the results was not at the required level. Then we decided to use the slices that show the full (biggest) size of the liver in order to obtain a better mask. This leads to further accurate segmentation that may need no post-processing for enhancing the results.
Figure2: The Proposed System
The third stage is the main stage in the process of liver segmentation from other surrounding organs. The input of this stage is the liver mask obtained from automatic liver localization stage. The results of the segmentation process may yield the liver cross section being segmented successfully
or the liver is segmented together with small neighboring attached parts that will be later disposed of in the subsequent stage.
The fourth stage is the stage of results enhancement. It is a combination of morphological steps, including improving the boundaries of the image, identifying the largest size, deleting small non liver parts and filling in holes; all towards obtaining a clear segmented liver cross section.
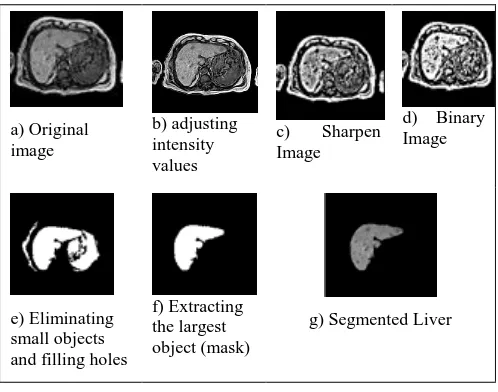
3.1 Stage 1: Image Enhancement
The proposed liver segmentation depends mainly on the spatial feature of the liver being the largest organ appearing [30]–[32] in a given MRI image of an exam done for screening the liver for diagnosis. In order to determine the largest object in the image; we first need to clarify the edges and intensity variation of the image because most abdominal medical images are noisy because of the artifacts, and edges of the organs are sometimes blurred. Therefore, proceeding with the segmentation algorithm without enhancement, will lead to the failure of recognizing the edges of the required object to be segmented. So the pre-processing or image enhancement steps are necessary to eliminate the noise, make the edges clearer, prevent the existence of incorrect regions, and give a better flexibility to the segmentation operation in the next steps. In our proposed system, the image enhancement stage is a combination of morphological operations, it consists of eliminating noise, illuminating the image, sharpening the borders, and finally enhancing the image by filling the image regions and holes.
3.1.1 Adjust Image Intensity Values
Since the work is done on MRI images and these images are gray scale; we need to adjust contrast of the images to make it clearer by applying image normalization and gamma correction, see Figure 3.b.
3.1.2 Sharpen Image Edges
In this step the images are sharpened to obtain clear image boundaries. Sharpness is actually the contrast between different colors. A quick transition from black to white looks sharp. A gradual transition from black to gray to white looks blurry. Sharpening images increases the contrast along the edges where different colors meet. The un-sharp masking technique basically uses the edge data of an image to sharpen it. It works by obtaining the difference of the image and a blurred version of it and then using that to sharpen the image. The resulting image is visibly sharper and this is done by "adding" the edge data to the original image through the use of the un-sharp mask, see Figure 3.c
3.1.3 Fill Image Regions and Holes
In this step the small holes in the image are filled to obtain a smooth texture; to further help with liver extraction. The input to this step is a binary image and the filling is done using morphological reconstruction, see Figure 3.e.
3.2 Stage 2: Automatic Liver Localization
3.2.1 Eliminating small objects from image
Small objects elimination is done using connected component analysis that eliminates objects from the input image based on assigned connectivity option given for the algorithm. The function removes all connected components (objects) from image matrix which are less than the number of pixels specified; the default connectivity is 8 for 2D images and 26 for 3D volume [33] .In general the basic idea of this function is determine the connected components, compute the area of each component and remove small objects, see Figure 3.e.
3.2.2 Extract Largest Object from Image by
Size
In this step, connected components analysis is done but this time for not eliminating but rather extracting largest connected objects. Connected components extracts the objects from the binary image, where the area of the objects is in range specified, producing another binary image. Range is a 2-by-1 vector of minimum and maximum sizes (inclusive). This function removes objects that do not meet the criterion, see Figure 3.e.
a) Original image
b) adjusting intensity values
c) Sharpen Image
d) Binary Image
e) Eliminating small objects and filling holes
f) Extracting the largest object (mask)
[image:4.595.43.292.299.495.2]g) Segmented Liver
Figure 3: Steps of Stages 1 and 2.
3.2.3 Morphological Closing on the Image
Performs morphological closing on the gray scale or binary image and returning the closed image, based on the structuring element, which must be a single structuring element object, as opposed to an array of objects. The morphological close operation is a dilation followed by erosion, using the same structuring element for both operations.
3.3 Stage 3: Automatic Liver Segmentation
This stage is the main phase of liver segmentation. In this phase the liver is segmented from every MRI image scan in the study (where the liver cross section appears). The liver mask obtained from stage 1 is used for liver segmentation. For every new MRI image, the image is first enhanced in terms of lighting by adjusting the histogram values of the image and image borders are sharpened. Then the Active contour algorithm is used to segment the liver cross section.
3.3.1 Image Enhancement
As in the first step of the first stage (Adjust image intensity values, Sharpen image edges and Fill image regions and holes)
3.3.2 Apply Gaussian Filter to the Image
For every visited MRI image scan in the study, the image is first enhanced using image normalization for adjusting image intensity then Gaussian filtering is applied to compensate for any noise that would affect the segmentation process. The filtering is done using a 2-D Gaussian smoothing kernel with standard deviation of 0.5. We use this filter with window size 2*2 to eliminate noise and reduce the impact of any lesion that would exist in the liver from confusing the segmentation process.
3.3.3 Active Contour Model
We propose to automatically segment liver using Active Contour Model. The active contour method is one of the very effective techniques for image segmentation was used on a wide range during the last two decades has been proven effective in the segmentation of medical images for its ability to capture local image statistics within a global geometric framework. Segmentation using active contours model (Snakes) first introduced in 1987 by Kass et al [34], it appears an object boundary or some other salient image feature as a parametric curve.
The basic idea of active contours, or deformable models, for image segmentation is a user initializes any curve close to the object boundary and the snake then starts deforming and moving by image driven forces to the boundaries of the desired objects, and in the end it completely “shrink-wraps” around the object [35].
In such models, two types of forces are considered - the internal forces, defined within the curve, are designed to keep the model smooth during the deformation process, while the external forces, which are computed from the underlying image data, are defined to move the model toward an object boundary or other desired features within the image. The energy terms are defined cleverly in a way such that the final position of the contour will have a minimum energy (Emin).
Contour possesses energy (Esnake) which is defined as the sum
of the three energy terms.
Internal Energy (Eint) is sum of elastic energy (Eelastic) and
bending energy (Ebending), it depends on the intrinsic properties
of the curve. The curve is treated as an elastic rubber band possessing elastic potential energy; it discourages stretching by introducing tension.
Weight (s) allows controlling elastic energy along different parts of the contour, considered to be constant for many applications, and it's responsible for shrinking of the contour. The snake is also considered to behave like a thin metal strip giving rise to bending energy; it is defined as sum of squared curvature of the contour.
(s) plays a similar role to (s), Bending energy is minimum for a circle. Thus total internal energy of the snake can be defined as:
External energy of the contour (Eext) describes how well the
curve matches the image data locally, numerous forms can be used and attracting the curve toward different image features. And the (Eext) It is derived from the image, a function Eimage
(x, y) is define so that it takes on its smaller values at the features of interest, such as boundaries. Key rests on defining image(x, y), if suppose we have an image I(x, y), can compute image gradient at any point, and edge strength at pixel (x, y) is then external energy (Eext) for the
whole snake is:
Initial snake result can be nudged where it goes wrong, simply add extra external energy terms to pull nearby points toward cursor or Push nearby points away from cursor
or
In[37] more details about the three energy terms (E internal,
Eexternal, Econstraint).
Active contour methods are traditional Snake, balloon snake, topology snake, distance snake and GVF snake model; these methods are adaptable to the desired features in the image. Active Contour characterized by flexibility to adapt to various anatomical shapes while constraining the local geometric shape constraint, and overcome to the limitation of topological adaptability by introducing a topology adaptive model. It models capable of accommodating a wide range of shape variability over time and space. Active contours are often implemented with level sets.
At the present time, the deformable model-based segmentation algorithm has become a vital part of the most advanced image processing toolbox associated with medical imaging devices. Compared with the classical image segmentation methods, such as region-growing, edge detection and artificial neural network (ANN); Active contour models (ACMs) have several desirable advantages. For example, the models can provide smooth and closed contours as segmentation results with sub-pixel accuracy and meanwhile they can easily integrate with various prior knowledge[38].
Active contour models (Snakes) can be represented by two models[39]: region based models (The Chan and Vese's region-based energy model) [40]–[42] and edge-based models (similar to Geodesic Active Contour) [43], [44]. The characteristics of the image determine the model we should choose. Typical edge-based models drive active contour toward the object boundary using image gradient information. These models are very sensitive to noise and weak object boundary. These drawbacks limit their applications for medical images, which typically contain noise induced by the image acquisition process and fuzzy boundary caused by low contrast or partial volume effect[38]. In contrast to edge-based schemes, region based models have better performances in the presence of noise and weak boundary due to the utilization of certain region descriptors therefore we use it in our proposed model. The main pro of active contour models is the ability of contours to give a linear description of the object shape during the time of convergence without adding extra processing. But what scientifically limits the use of snakes is the need of the method to have strong image gradients to be able to drive the contour[45]. The primary con, however, is that they are slow to compute.
Active contour uses the boundaries of the regions in the liver mask as the initial state of the contour from where the contour evolution starts. Before applying the active contour algorithm; all parameters are provided which are: the image to be segmented, the initial contour at which the evolution of the segmentation begins (specified as a binary image the same size as the image to be segmented (the mask)), and maximum number of iterations specified as a numeric scalar. Active contour stops the evolution of the active contour if the contour position in the current iteration is the same as one of the contour positions from the most recent five iterations, or if the maximum number of iterations is reached.
For improving the active contour segmentation results, there are other parameters that could be determined to add some kind of improvement on the segmentation process such as the degree of smoothness or regularity of the boundaries of the segmented regions. The output of the active contour model is the segmented image returned as a binary image having the same size as the input image, see Figure 5.
a) Original image b) After enhancement the
Image
c)After apply Gaussian filter
d) After using active contour
e) Result stage 3
Figure 5: Steps of Stage 3.
3.4 Stage 4: Enhancing Segmentation
Results
Due to the variation in the size of the liver appearing on different MRI image slices (appearing as a small region then it gets bigger in subsequent slices then turns back to be small in size) and due to the difference of the liver shape from patient to patient; the segmentation results may contain some noise or attached undesirable organs and thus need some enhancement to obtain the desired results.
Results enhancement include several morphological processes to improve the image in terms of boundaries clarification, removing undesirable noise and parts, separate the larger object in the image that represents the liver.
3.4.1 Applying Image Erosion
3.4.2 Extract Largest Object from Image by
Size
Connected component analysis is re-applied again in this step, but this time it is applied on the segmentation results to extract the largest object in the image which is the liver (from other surrounding undesirable organs that appear in the segmentation results), see Figure 6.b and 5.c.
a) Initial liver segmentation results
b) After image enhancement and converting image to binary
[image:6.595.322.548.70.265.2]c) Final liver segmentation result
Figure 6: Steps of results enhancement stage
4.
RESULTS AND DISCUSSIONS
To test our proposed automatic liver segmentation system; we used a data set including MRI studies from several centers and hospital; where the MRI images are all of type T1, which is a type preferred by radiologists due to its quality. All abdominal MRI data sets have been acquired related to the liver. Twenty-one patients, ranging in age between 7 and 73 years, 17 have a diseased liver and 4 have a normal liver.
It is known that the process of liver segmentation has many difficulties (challenges) [46] and of the difficulties that faced us in this study, including what is related to medical images in general, they contain artifacts and the weakness of the border in some cases so we used the first phase in various steps to reduce the noise and clarification of the boundary to the extent that can be relied upon somewhat in the segmentation process.
Another difficulties is liver-related because of the similarities of the liver area pixels with the pixels intensity of some of its adjacent organs, such as the spleen and the kidneys, when the segmentation process is done, the result is a picture of the liver, spleen and right kidney, so we performed the localization stage based on the anatomical characteristics of the liver that it largest organ is located in the right side of the abdominal cavity to obtain the liver only.
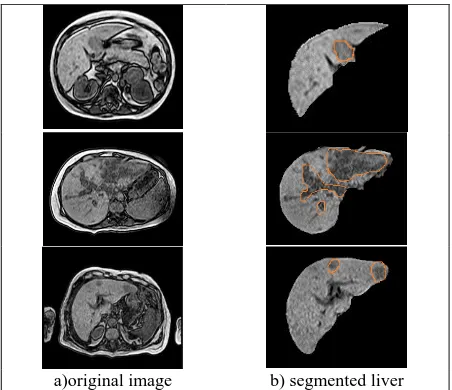
But the most difficult challenges we faced were with the cases of the liver is not healthy as the segmentation of the liver showing holes or blanks because of the segmentation of infection (tumors) with the liver so we used some morphological processes to fill these holes and then restore the liver segmented from the original image to maintain the shape and characteristics of the liver as is (see Figure 7).
And when the injury on the border of the liver lead to the difficulty of segment the liver from the organ next to him by injury, so after the segmentation process we needed to modify some of the results as in this case, So it was the last stage of the proposed work to improve the results in general and to obtain an image of the liver only.
The liver is automatically segmented from the testing dataset with accuracy of 95%. The total liver is segmented from the MRI on slice by slice basis, as shown in figure 8.
a)original image b) segmented liver
Figure 7: Some challenging cases of diseased livers.
[image:6.595.50.286.158.274.2]a) Original images b) Segmented liver
Figure 8: Some results of the proposed automatic liver segmentation system.
obtaining a liver mask through thresholding, then and the final segmentation of the liver using active contour model. The segmentation from first stage is to be used as an initial state for the main segmentation stage, which is done using the active contour model, and the final results are enhanced using morphological operations. The proposed system is fully automatic, the localization and segmentation of the liver succeeded in all test cases acquired from different MRI imaging modalities and comprise normal and diseased cases with different stages of disease progression. This proves the robustness of the proposed automatic segmentation process. The accuracy of the segmentation has a mean Dice Similarity Coefficient (DSC) 95% for all the test cases.
In the future this work can be developed to solve leak problem in some cases where liver contour is not clear due to hepatomegaly, also the work can be extended in order to differentiate between internal liver tissues, the hepatic tumor lesions, and vessels.
6.
REFERENCES
[1] D. Market, S. Of, and A. Ferula, “Available online through,” vol. 1, no. 2, pp. 12712–12717, 2010.
[2] T. M. Hassan and M. Elmogy, “Medical Image Segmentation for Liver Diseases : A Survey,” vol. 118, no. 19, pp. 38–44, 2015.
[3] S. V Chavan, “Study and Analysis of Image Segmentation Techniques for Food Images,” vol. 136, no. 4, pp. 20–24, 2016.
[4] G. S. Chandel, R. Kumar, D. Khare, and S. Verma, “Analysis of Image Segmentation Algorithms Using MATLAB,” Int. J. Eng. Innov. Res., vol. 1, no. 1, pp. 2277–5668, 2012.
[5] M. Waseem Khan, “A Survey: Image Segmentation Techniques,” Int. J. Futur. Comput. Commun., vol. 3, no. 2, pp. 89–93, 2014.
[6] G. G. Rajput, “Automatic Detection of Abnormalities Associated with Abdomen and Liver Images : A Survey on Segmentation Methods,” vol. 140, no. 4, pp. 1–9, 2016.
[7] S. Mandiratta, “A Perlustration of Various Image Segmentation Techniques,” vol. 139, no. 12, pp. 26–31, 2016.
[8] A. Taneja, P. Ranjan, and A. Ujjlayan, “A Performance Study of Image Segmentation Techniques,” IEEE Trans. Image Process., 2015.
[9] N. R. Pal and S. K. Pal, “A Review on Image Segmentation Techniques,” Pr, vol. 26, no. 9, pp. 1277– 1294, 1993.
[10] I. Singh, “A Study of Effective Segmentation Techniques for Liver Segmentation,” vol. 4, no. 4, pp. 1661–1666, 2015.
[11] E. S. Bialecki and A. M. Di Bisceglie, “Diagnosis of hepatocellular carcinoma,” Hpb, vol. 7, no. 1, pp. 26–34, 2005.
[12] Y. Sumida, A. Nakajima, and Y. Itoh, “Limitations of liver biopsy and non-invasive diagnostic tests for the diagnosis of nonalcoholic fatty liver disease/nonalcoholic steatohepatitis,” World J. Gastroenterol., vol. 20, no. 2, pp. 475–485, 2014.
[13] D. C. Rockey, S. H. Caldwell, Z. D. Goodman, R. C. Nelson, and A. D. Smith, “Liver biopsy,” Hepatology, vol. 49, no. 3, pp. 1017–1044, 2009.
[14] L.-K. Lee and S.-C. Liew, “A survey of medical image processing tools,” 2015 4th Int. Conf. Softw. Eng. Comput. Syst., no. October, pp. 171–176, 2015.
[15] T. T. Tran, J. Ahn, and N. S. Reau, “ACG Clinical Guideline: Liver Disease and Pregnancy,” Am. J. Gastroenterol., vol. 111, no. 2, pp. 176–194, 2016. [16] American College of Obstetricians and Gynecologists’
Committee on Obstetric Practice, “Committee Opinion No. 656: Guidelines for Diagnostic Imaging During Pregnancy and Lactation.,” Obstet. Gynecol., vol. 127, no. 2, pp. e75-80, 2016.
[17] National Intitute of Diabetes and Digestive and Kidney Diseases, “What is cirrhosis?,” NIH Publ., vol. No. 14– 113, pp. 1–16, 2014.
[18] C. Guy and D. Ffytche, An introduction to the principles of medical imaging, vol. 1542, no. 9. 2015.
[19] L. Wang, T. Chitiboi, H. Meine, M. G??nther, and H. K. Hahn, “Principles and methods for automatic and semi-automatic tissue segmentation in MRI data,” Magn. Reson. Mater. Physics, Biol. Med., vol. 29, no. 2, pp. 95– 110, 2016.
[20] T. Heimann et al., “Comparison and evaluation of methods for liver segmentation from CT datasets,” IEEE Trans. Med. Imaging, vol. 28, no. 8, pp. 1251–1265, 2009.
[21] A. Bereciartua, A. Picon, A. Galdran, and P. Iriondo, “Automatic 3D model-based method for liver segmentation in MRI based on active contours and total variation minimization,” Biomed. Signal Process. Control, vol. 20, pp. 71–77, 2015.
[22] C. Platero et al., “CHARACTERISATION.”
[23] O. Gloger, J. K??hn, A. Stanski, H. V??lzke, and R. Puls, “A fully automatic three-step liver segmentation method on LDA-based probability maps for multiple contrast MR images,” Magn. Reson. Imaging, vol. 28, no. 6, pp. 882–897, 2010.
[24] F. López-Mir, V. Naranjo, J. Angulo, M. Alca˜niz and L. Luna, “Liver segmentation in MRI: A fully automatic method based on stochastic partitions,” Comput. Methods Programs Biomed., vol. 114, no. 1, pp. 11–28, 2014. [25] D. Chi, Y. Zhao, and M. Li, “Automatic liver MR image
segmentation with self-organizing map and hierarchical agglomerative clustering method,” Proc. - 2010 3rd Int. Congr. Image Signal Process. CISP 2010, vol. 3, pp. 1333–1337, 2010.
[26] D. Seghers et al., “Landmark based liver segmentation using local shape and local intensity models,” Proc. Work. 10th Int. Conf. MICCAI, Work. 3D Segmentation Clin. A Gd. Chall., pp. 135–142, 2007.
[27] I. Singh, “Optimized Liver Segmentation using Ant Colony Optimization,” vol. 4, no. 9, pp. 2434–2439, 2015.
Informatics Syst. (INFOS), 2010 7th Int. Conf., pp. 1–8, 2010.
[29] W. Nural, J. Hj, and H. Burkhardt, “Automatic 3D Liver Segmentation Using Morphological Operations and Graph-Cut T echniques,” pp. 23–34, 2011.
[30] P. Kar and R. Jain, “Imaging of Space Occupying Lesions of Liver,” 2011.
[31] Onwuchekwa R.C, “Radiological anatomy of the liver.,” Journal of Medicine and Medical Sciences. Vol. 7(4) pp. 072-078, July 2016.
[32] A. P. Wasnik, M. B. Mazza, U. R. Lalchandani, and P. S. Liu, “Normal and Variant Abdominal Anatomy on Magnetic Resonance Imaging,” Magn. Reson. Imaging Clin. N. Am., vol. 19, no. 3, pp. 521–545, 2011.
[33] A. A. M. Al-shammaa and H. R. Mohamed “Extraction of connected components Skin pemphigus diseases image edge detection by Morphological operations,” International Journal of Computer Applications , vol. 46, no. 18, pp. 7–13, 2012.
[34] M. Kass, A. Witkin, and D. Terzopoulos, “Snakes: Active contour models,” International Journal of Computer Vision, vol. 1, no. 4. pp. 321–331, 1988. [35] R. Oak, “A Study of Digital Image Segmentation
Techniques,” Int. J. Eng. Comput. Sci., vol. 5, no. 12, pp. 19779–19783, 2016.
[36] M. Bakoš, “Active Contours and their Utilization at Image Segmentation,” 5th Slovakian-Hungarian Jt. Symp. Appl. Mach. Intell. informatics, Poprad, Slovakia, pp. 313–317, 2007.
[37] S. Kemal and B. Acar, “Active Contours : A Brief Review,” 2006.
[38] K. Wang and C. Ma, “A robust statistics driven volume-scalable active contour for segmenting anatomical structures in volumetric medical images with complex conditions,” Biomed. Eng. Online, vol. 15, no. 1, p. 39, 2016.
[39] A. Aly, S. Deris, and N. Zaki, “Research review for digital image Segmentation techniques,” Int. J. Comput. Sci., vol. 3, no. 5, pp. 99–106, 2011.
[40] P. Getreuer, “Chan-Vese Segmentation,” Image Process. Line, vol. 2, pp. 214–224, 2012.
[41] T. F. Chan and L. A. Vese, “Active contours without edges,” IEEE Trans. Image Process., vol. 10, no. 2, pp. 266–277, 2001.
[42] T. Chan and L. Vese, “An Active Contour Model without Edges,” IEEE Trans.Image Process, vol. 10,no. 2, 2001
[43] R. Goldenberg, R. Kimmel, E. Rivlin, and M. Rudzsky, “Fast Geodesic Active Contours,” vol. 10, no. 10, pp. 1467–1475, 2001.
[44] V. Caselles, R. Kimmel, and G. Sapiro, “Geodesic active contours,” IEEE Int. Conf. Comput. Vis., vol. 22, no. 1, pp. 694–699, 1995.
[45] M. Airouche, L. Bentabet, and M. Zelmat, “Image Segmentation Using Active Contour Model and Level Set Method Applied to Detect Oil Spills,” Proc. World Congr. Eng., vol. 1, no. 1, pp. 1–3, 2009.