International Research Journal of Engineering and Technology (IRJET) e-ISSN: 2395-0056
Volume: 06 Issue: 07 | July 2019 www.irjet.net p-ISSN: 2395-0072Quantitative Analysis of Methane Gas Emission from Municipal Solid
Waste in Jabalpur
Prashant Gupta
1, Asso. Prof. R.K. Bhatia
21
ME Environmental Engineering, Department of Civil Engineering, Jabalpur Engineering College, Jabalpur,
MP, India.
2
Asso. Professor, Department of Civil Engineering, Jabalpur Engineering College, Jabalpur, MP, India
---***---
Abstract - In past few decades increased emissions of greenhouse gases have adversely affected global climatic conditions. The municipal solid waste (MSW) generated by households is considered the third largest anthropogenic
source of methane CH4 emissions. The current study derived total MSW CH4 emission estimates using the IPCC default
method (DM). The estimated CH4 emission was higher for the DM than the other methods, and was comparable to
estimates from other studies therefor DM was used. This study observed that the net annual emission of CH4 from
landfills in India increased from 404 Gg in 1999–2000 to 990 Gg and 1084 Gg in 2011 and 2015, respectively. We
also found that CH4 emissions were highly correlated with the gross state domestic product (GSDP) of states and the
gross domestic product (GDP) of the country, which is an indicator of human well-being.Study pertaining to MSWM
for Indian cities has been carried out to evaluate the current status and identify the major problems The MSW management policy of India needs to be reviewed in a current policy context, as the management and efficient
utilization of MSW technologies might help increase the use of CH4 as an energy source and thereby improve its
sustainable and cost-effective management.
Introduction
Methane CH4 is regarded as one of the most important GHG because of its global warming potential, which is 28
times higher than that of CO2 over 100 years. The increase in greenhouse gas (GHG) emissions has altered the global
temperature pattern and created a threat against human health and the environment. Methane emitted from landfills is
one of the most important contributors to GHGs. Over the last few centuries, the concentration of CH4 in the atmosphere
has increased rapidly. In a span of 260 years, from 1750 to 2010, the concentration of GHG CH4 in the environment has
increased from 700 ppb to 1808 ppb. The rate of increase observed during the last few decades is 1–2% per year. Along
with natural sources, i.e., wetlands, termites, and oceans, which account for 36% of the total CH4, anthropogenic
activities, including the production and burning of fossil fuels, livestock farming, landfills and agriculture, contribute 64%
of the total amount of global CH4 emissions. Rapid population growth and development activities have increased the
potential CH4 emission level, and it has been estimated that the concentration of GHG CH4 is expected to increase from
6.88 Gt CO2-eq, the value recorded in 2010, to 8.59 Gt CO2-eq by 2020. The decomposition of municipal solid waste
(MSW), i.e., wastes generated from households and residential settings, is considered the third major anthropogenic
source of CH4, and it contributes approximately 11% of the total anthropogenic CH4 emissions.
Asian countries are the largest producers of MSW due to their high population densities. The generation of MSW in Asia is predicted to increase up to 1.8 million tons/day by 2025 from the current value of 1 million tons/day. India, with its huge population and GDP growth rate of 6.7%, is witnessing rapid urbanization and lifestyle changes. The per capita generation rate of MSW in India ranges from 0.2 to 0.5 kg/day. Presently, approximately 90 million tons of solid waste is generated by the country, which is eight times higher than the amount of solid waste that was generated in 1947. Metropolitan cities have the largest contribution to the generation of waste compared to smaller and less
developed cities. At present, India produces 16 Mg CO2 equivalent of CH4 per year, and the annual value is expected to
reach 20 Mg CO2 equivalent by 2020. It is also estimated that CH4 contributes 29% of the total GHG emissions from the
country, which is higher than the global average of 15%. Studies suggest that the MSW generated in India mostly consists of a large fraction of organic wastes (40–60%), 3–6% paper waste, and 30–40% ash and fine earth material waste, with smaller fractions of plastics, glass and metal wastes (all <1%). The moisture content of the wastes is 47%, with an average calorific value of 6.8–9.8 MJ/kg and a C/N ratio of 800–1000 Kcal/kg.
Once MSW is disposed into landfills, it undergoes aerobic decomposition, which produces a very small amount of
CH4. Afterwards, the anaerobic condition prevails, and due to methanogen activities, the MSW emits CH4 for years, even
International Research Journal of Engineering and Technology (IRJET) e-ISSN: 2395-0056
Volume: 06 Issue: 07 | July 2019 www.irjet.net p-ISSN: 2395-0072several issues related to the segregation of waste, low calorific values of the waste, and challenges in the operation and maintenance of the plants (CPCB).
In India, due to inadequate data availability, a large amount of uncertainty related to MSW management and emissions has been observed, which makes it difficult to estimate the accurate value for the landfill GHG emission potential. The International Panel on Climate Change has established a method for the estimation of GHGs emitted from landfills that has been widely used by researchers.
Studies have been conducted by using different methods, i.e., the stoichiometric method, default method (DM), first order decay method (FOD), modified triangular method (MTM), in situ closed chamber methods and the landfill gas emission method (Land GEM). India is the largest producer of MSW, and landfills are third largest contributors to the
total CH4 emission value of the country. The CH4 emitted from landfills can be utilized as a potential source of renewable
energy. With the above background, this study aimed to estimate the potential emissions of CH4 from landfills at the
national scale, which would support sustainable management practices in a quickly evolving economy.
Trends in Methane Emissions from Landfills and Populations
Migration from rural areas to the urban areas has increased the generation of MSW. According to the census of India, during the period from 2001 to 2011, the population of the country increased by 181 million, which is 17.6% of the total population, and within the 2001–2011 period, the urban population increased by 31.8%. This increase in the urban population has resulted in a huge generation of MSW and has also changed the characteristics of the wastes due to changes in the economic status and living standards of the
Methane Emission, Population Growth and Economic Development
We found that the CH4 emissions were highly correlated with economic development and population growth. Economic development drives the population to move to cities where basic infrastructure and amenities are available. This diversion of the population subsequently leads to changes in the overall lifestyle and living standards and thereby increases the per capita generation of MSW. We found that the higher the population density, the more MSW was generated. Similarly, for the regions, higher GDPs indicated higher human activity levels and consequently higher MSW generation rates. The generation of MSW is often linked with per-capita income and development. The generation of MSW is considered high in developed countries compared to developing countries. Our findings show a high correlation between the MSW methane emission level and the GSDP, which is an indicator of social well-being, of the states. Along with their development level, the lifestyles of the communities also change accordingly, which further enhances the generation of MSW.
CH4 from Landfills: A Potential Source of Energy
India, one of the fastest growing economies, is still improving its existing technological capability to generate power sources and energy from MSW. Most of the gases emitted from landfills have the potential to be utilized as biogas, which is a source of clean/green energy. Landfills directly emit GHGs into the environment, which affects the global temperature and puts the environment at risk. The open dumping of wastes leads to significant reductions in nutrients, i.e., nitrate, potassium and phosphorus; reduces the ability to recycle and reuse waste; and increases the risk of groundwater pollution by leaching. Controlled or engineered landfills with a proper covering and collection system can enable the sustainable disposal of solid wastes and their use as an energy source. According to one estimate, only 20–25% of landfill gases can be recovered, while the rest of the gases escape into the atmosphere. If properly designed landfills are established, 30–60% of the gases can be utilized from these controlled landfills. These recovered landfill gases can be used as a direct source of energy and for power generation or can be upgraded into vehicle fuel.
India, one of the fastest growing economies, is still improving its existing technological capability to generate power sources and energy from MSW. Most of the gases emitted from landfills have the potential to be utilized as biogas, which is a source of clean/green energy. Landfills directly emit GHGs into the environment, which affects the global temperature and puts the environment at risk. The open dumping of wastes leads to significant reductions in nutrients, i.e., nitrate, potassium and phosphorus; reduces the ability to recycle and reuse waste; and increases the risk of groundwater pollution by leaching.
International Research Journal of Engineering and Technology (IRJET) e-ISSN: 2395-0056
Volume: 06 Issue: 07 | July 2019 www.irjet.net p-ISSN: 2395-0072used as a direct source of energy and for power generation or can be upgraded into vehicle fuel.
Status and Challenges for MSW Management in Jabalpur Comparing to Whole Country Scenario
The emission of CH4 is directly related to the amount of waste generated from the households or the society in
a region. In India, there is a huge amount of climatic, cultural and demographic variability based on the different food habits of its communities. According to the 2011 census, the urban population in India increased from 285 million in 2001 to 377 million in 2011, and approximately 70% of this population resides in 366 cities of the country. In the present study, we observed that over the last fifteen years, the total MSW has increased by three times compared to the amount that was generated in 1999– 2000, i.e., from 52125 MT/day in 1999–2000 to 127485 MT/day in 2010 and 139566 MT/day in 2015. Landfills are one of the most cost effective, simplest, and oldest techniques for MSW management, but they require land area near cities but away from habitation clusters and other places of socio-economic or environmental importance. Most of the existing landfills in megacities such as Delhi are oversaturated and are serving beyond their maximum carrying capacity. When a landfill operating above its capacity in Delhi collapsed on 1st September 2017, a 50 m high mound of waste killed several people. According to one estimate, the total urban waste generated in India will increase to 107 thousand tons/year in 2031 and will reach up to 160.9 thousand tons/year in 2041. The proper disposal of this waste will require an area of 1400 sq.km, i.e., an area equivalent to the area of Hyderabad, Mumbai and Chennai.
MSW contains large amounts of biodegradable wastes and wastes with high calorific values that can be utilized for vermicomposting/compost preparation and energy generation, respectively. The Indian government revised the 2001 law related to MSW after 15 years and produced a new MSW law in 2016 under the Environmental (Protection) Act of 1986 for the proper management and utilization of MSW. This law is intended to make the community aware of ways to reduce waste generation and to involve locals in the proper management of waste and innovations of technology for recycling and energy recovery purposes. The huge amount of waste generated in the country has a potential use as renewable energy, as landfill gases have high a calorific value, and can consequently minimize the impacts of greenhouse gas emissions on the climate.
Conclusion
In the last few decades, the overall growth of the population, urbanization level and economy of India has increased the amount of municipal solid waste generated in the country and so of Jabalpur also. The disposal of these wastes into landfills results in the emission of gases with a high global warming potential such as CH4, CO2, and NOx. The results of this study indicate that a gradual increase in the CH4 emissions has occurred over the last 7 years (2011–2018). Landfill gases have the potential to be utilized as sources of green energy, and if properly planned and engineered landfills are constructed at suitable sites, these gases can be recovered and utilized as a sustainable source of renewable energy.
METHOD
Data acquisition and determination of waste characteristics
This study was conducted to determine the generation and composition of waste in various parts of the country. It has been observed that the composition of waste depends on various factors, including the food habits and socio-cultural practices of a community, the climate and the community income. The source composition of
MSW approximately consisted of a fraction of organic matter varying from 40 to 60%, followed by fractions of
earth and ash materials (30–40%), paper (3–6%) and plastic, glass and metals (1% each). It was reported
that the composition of municipal waste was 30–70% rapidly biodegradable organic matter, 0.6–31% paper
and cardboard, and 1–16% plastic materials. In this study, we assume that 70% of the MSW reaches a landfill. The collection efficiency is poor due to a number of reasons (e.g., poorly designed bins, open dumps, collection vehicles, and the frequency of waste collection). The average collection efficiency for MSW is approximately 70%. The MSW generation data for 2011 and 2018 (approximated) were collected from the Central Pollution Control Board (CPCB) and Jabalpur Municipal Corporation (JMC). The population data was taken from the Census 2011.
Calculation of CH4 emissions from landfills
Among the available methods for the estimation of CH4 emissions from landfills, the simplest one was
provided by Bingemer and Crutzen (1987) and revised by the IPCC in 1996. It is a mass balance approach that
International Research Journal of Engineering and Technology (IRJET) e-ISSN: 2395-0056
Volume: 06 Issue: 07 | July 2019 www.irjet.net p-ISSN: 2395-0072CH4 (Gg/yr) = (MSWT × MSWF) × MCF × DOC x
DOCF × F × ((16/12)− R) × (1 − OX)
where 1 Gg/yr = 1000 tons/yr.
In equation 1, MSWT = total amount of solid waste generated (Gg/yr),
where 1 Gg/yr = 1000 tons/yr.
In equation 1, MSWT = total amount of solid waste generated (Gg/yr),
MSWF = the fraction of MSW that reaches the landfill sites (considered 70% for the current study, as the rest of the MSW
was considered lost by recycling, reuse or other processes),
MCF = Methane correction factor
DOC = Degradable organic carbon, which can be calculated using the following equation:
DOC = 0.4A + 0.17B + 0.15C + 0.3D
where A = paper, cardboard and rags, B = leaves, straw and others, C = fruit and vegetable wastes and D=wood
DOCF = the value of the dissimilated fill gas, which was considered 0.77 (at a temperature of 35 °C),
F = fraction of methane gas, which was considered 0.5.
R = recovered methane gas, which was considered 0 for this study, as recovery techniques for landfill gases have not been adopted in most of India.
OX = oxidation factor, which was also considered 0 (as the default value) and accounted for the methane gas that was oxidized in the upper layer of the waste in the presence of oxygen.
The IPCC has identified two types of uncertainties in the model, but the model generates reasonable estimates for regions where the data on waste generation are limited.
The uncertainty in the model is as follows: First, the methodology assumes that a constant amount of waste is
added each year and that the CH4 generation is the same in each year. Thus, temporal increments at the landfills are
not considered, which may cause the methane emission value to be overestimated. The amount of waste disposed is a highly sensitive parameter in the default methodology.
Result
Temporal CH4 Emission Estimate with the DM (default method)
The CH4 emission values calculated using the DM. Using the DM the estimated the net annual methane generated in
International Research Journal of Engineering and Technology (IRJET) e-ISSN: 2395-0056
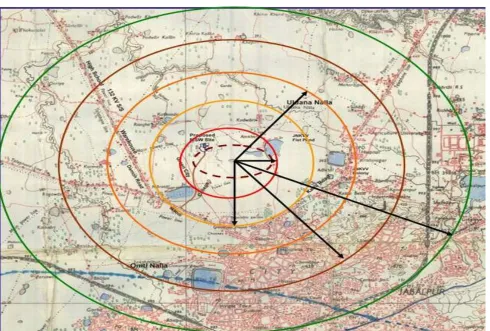
Volume: 06 Issue: 07 | July 2019 www.irjet.net p-ISSN: 2395-0072 [image:5.595.49.539.99.430.2]MAP SHOWING KATHONDA LANDFILL SITE
Table showing Ward-wise Population and Municipal Solid Waste Generation
S. No
Ward No. Population generation (Kg) MSW S. No Ward No. Population generation (Kg) MSW
1 Ward No. - 1 12,306 5316.19 42 Ward No. - 42 13,501 5832.43
2 Ward No. - 2 11,834 5112.29 43 Ward No. - 43 15,961 6895.15
3 Ward No. - 3 12,907 5575.82 44 Ward No. - 44 11,716 5061.31
4 Ward No. - 4 9,158 3956.26 45 Ward No. - 45 14,851 6415.63
5 Ward No. - 5 11,112 4800.38 46 Ward No. - 46 11,322 4891.10
6 Ward No. - 6 13,093 5656.18 47 Ward No. - 47 12,035 5199.12
7 Ward No. - 7 10,966 4737.31 48 Ward No. - 48 20,562 8882.78
8 Ward No. - 8 8,683 3751.06 49 Ward No. - 49 15,434 6667.49
9 Ward No. - 9 8,039 3472.85 50 Ward No. - 50 10,026 4331.23
10 Ward No. - 10 12,073 5215.54 51 Ward No. - 51 9,129 3943.73
11 Ward No. - 11 26,114 11281.25 52 Ward No. - 52 12,782 5521.82
12 Ward No. - 12 21,910 9465.12 53 Ward No. - 53 14,301 6178.03
13 Ward No. - 13 14,585 6300.72 54 Ward No. - 54 18,375 7938.00
14 Ward No. - 14 10,059 4345.49 55 Ward No. - 55 25,946 11208.67
15 Ward No. - 15 8,816 3808.51 56 Ward No. - 56 15,075 6512.40
16 Ward No. - 16 8,890 3840.48 57 Ward No. - 57 16,000 6912.00
17 Ward No. - 17 10,922 4718.30 58 Ward No. - 58 17,707 7649.42
18 Ward No. - 18 11,874 5129.57 59 Ward No. - 59 19,525 8434.80
19 Ward No. - 19 11,920 5149.44 60 Ward No. - 60 13,795 5959.44
20 Ward No. - 20 8,600 3715.20 61 Ward No. - 61 16,258 7023.46
International Research Journal of Engineering and Technology (IRJET) e-ISSN: 2395-0056
Volume: 06 Issue: 07 | July 2019 www.irjet.net p-ISSN: 2395-007222 Ward No. - 22 8,802 3802.46 63 Ward No. - 63 17,444 7535.81
23 Ward No. - 23 11,404 4926.53 64 Ward No. - 64 27,693 11963.38
24 Ward No. - 24 30,453 13155.70 65 Ward No. - 65 9,661 4173.55
25 Ward No. - 25 17,642 7621.34 66 Ward No. - 66 23,384 10101.89
26 Ward No. - 26 12,674 5475.17 67 Ward No. - 67 15,216 6573.31
27 Ward No. - 27 13,567 5860.94 68 Ward No. - 68 20,718 8950.18
28 Ward No. - 28 16,436 7100.35 69 Ward No. - 69 14,368 6206.98
29 Ward No. - 29 11,472 4955.90 70 Ward No. - 70 12,537 5415.98
30 Ward No. - 30 11,558 4993.06 71 Ward No. - 71 3,928 1696.90
31 Ward No. - 31 12,404 5358.53 72 Ward No. - 72 3,749 1619.57
32 Ward No. - 32 13,181 5694.19 73 Ward No. - 73 2,283 986.26
33 Ward No. - 33 12,971 5603.47 74 Ward No. - 74 1,333 575.86
34 Ward No. - 34 14,725 6361.20 75 Ward No. - 75 583 251.86
35 Ward No. - 35 29,814 12879.65 76 Ward No. - 76 1,891 816.91
36 Ward No. - 36 14,486 6257.95 77 Ward No. - 77 2,099 906.77
37 Ward No. - 37 26,537 11463.98 78 Ward No. - 78 5,463 2360.02
38 Ward No. - 38 22,265 9618.48 79 Ward No. - 79 4,823 2083.54
39 Ward No. - 39 14,532 6277.82
40 Ward No. - 40 19,087 8245.58 Population As per census Year 2011 -1,081,677
MSW=467284.46Kg
41 Ward No. - 41 24,587 10621.58 Now At present approximate Population is 1525640 & waste
generation is more than 659 tons
References
1. Mooney, H. A. Biological response to climate change: An agenda for research. Ecol. Appl. 1, 112–117 (1991).
2. Holbrook, S. J., Schmitt, R. J. & Stwphens, J. S. Jr. Changes in an assemblage of temperate reef fishes associated
with a climate shift. Ecol. Appl. 7, 1299–1310 (1997).
3. Hughes, L. Biological consequences of global warming: is the signal already apparent? Trends Ecol. Evol. 15(2),
56–61 (2000).
4. Patz, J. A., Gibbs, H. K., Foley, J. A., Rogers, J. V. & Smith, K. R. Climate Change and Global Health: Quantifying a
growing Ethical crisis. EcoHealth. 4(4), 397–405 (2007).
5. Myers, S. S. Global environmental change: the threat to human health. Worldwatch Institute, Worldwatch
report 181 (2009).
6. CPCB. Consolidated Annual Review Report prepared in compliance to the provision 8(2) of the MSW Rules,
2000. Central Pollution Control Borad, Annual report (2013–14).
7. Census of India. Data on Population. Office of the Registrar General & Census Commissioner, New Delhi.
8. Akolkar, A. B., Chaudhury, M. K. & Selvi, P. K. Assessment of methane emission from municipal solid wastes
disposal sites.
9. Res. J. Chem. Environ. 12(4), 49–54 (2008).
10. Kumar, A. & Sharma, M. P. Estimation of GHG emission and energy recovery potential from MSW landfill sites.
Sustain. Energy. Technol. Assess. 5, 50–61 (2014).
11. IPCC. Report of the Twelfth Season of the Intergovernmental Panel on Climate Change, Intergovernmental