Estimating Range and Relationship of EEG Frequency
Bands for Emotion Recognition
Leena Bhole
School of Computer Science & I.T D.A.V.V, Indore
Maya Ingle
School of Computer Science & I.T D.A.V.V, Indore
ABSTRACT
EEG based emotion recognition is the most significant technique to identify human emotions effectively. An attempt is made to identify range of frequency bands for each discrete emotion using frequency band analysis of EEG signals. Each frequency band is associated with relative power values. These relative power values assist to estimate range for frequency bands. The results are evaluated for absolute and relative power values of EEG signal in each frequency band. Further, Bayesian network is constructed to represent relationship between frequency bands and emotion. As a result, theta and alpha bands found to be more active than beta and gamma.
Keywords
Electroencephalogram (EEG), Power Spectral Density (PSD), absolute and relative power, Bayesian network
1.
INTRODUCTION
Electroencephalogram (EEG) based emotion recognition has speeded up its significance in Human Computer Interaction. EEG signals represent the vigilance states of brain which change according to the task performed by a subject. The change in EEG signals has been classified into different frequency bands namely; delta, theta, alpha, beta and gamma [1, 2]. The model works on Deep Belief Network (DBN) and differential entropy features for determining significant frequency bands in multichannel EEG data for emotion recognition. The weights of trained DBNs help in finding critical frequency bands achieving 86.65% accuracy [3]. Visual attention tasks assist frequency band analysis/ power spectrum analysis of EEG signal using Independent Component Analysis (ICA) and Principal Component Analysis (PCA). Visual attention frequency lies in beta band with maximum power as 10-12 DB and shows the alert state of subject [4]. Power spectrum of EEG signal includes functional connectivity patterns such as correlation, coherence and phase synchronization. Quadratic Discriminant Analysis (QDA) supports these connectivity patterns to classify emotion attaining 60% success rate. [5]. Transfer Recursive Feature Elimination (T-RFE) approach helps to determine the most robust EEG indicators with stable geometrical distribution for EEG based emotion recognition in frequency domain. Linear least square support vector machine using T-RFE serves to classify emotions realizing 75.26% and 78.75% success rate for arousal and valence dimensions respectively [6]. However, there remains the scope to identify dominant frequency bands and their relationship with emotion. With the potential advances in preprocessing of EEG signals, it has become possible to analyze EEG signals for different application domains. In this paper, a framework is proposed for estimating range of frequency bands for each discrete emotion and their relationship. In Section 2, a systematic description of aforementioned framework alongside its theoretical aspects is described. Section 3, deals with the
specification of experimental setup required for proposed framework with its realization issues. A discussion on results based on absolute and relative powers of frequency bands is provided in Section 4. Finally, Section 5 pertains with conclusion and future scope.
2.
PROPOSED FRAMEWORK
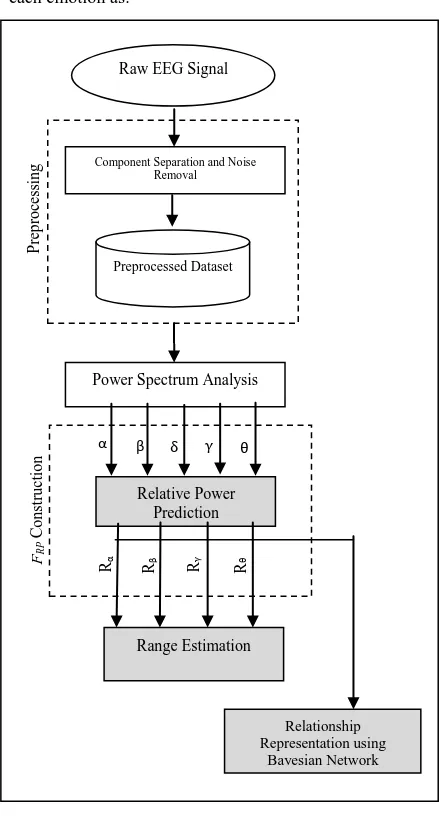
Neural patterns in frequency bands provide more objective measures for assessing emotional states of subject. A framework is proposed to estimate range of these neural patterns in frequency bands and to explore their relationship with emotions and is named as Relative Power Spectrum based Range Estimation (RPSRE). This work, intends to identify the neural signature and patterns of brain signals for happy, sad, and fear emotion. RPSRE framework comprises of consequent phases namely; input raw EEG signal, preprocessing, power spectrum analysis, relative power prediction, range estimation, and relationship representation as shown in Fig. 1 and are described in brief as follows:
2.1
Input Raw EEG Signal
Raw EEG signals are acquired from different subjects for diverse emotions and act as input to RPSRE. EEG signals are obtained from various positions of the brain against specific stimuli. Stimuli play a vital role in raw EEG signal acquisition for inducing target emotion to the subject. Various stimuli such as images, music and movie clips contribute to emotion elicitation process. The raw EEG signals are to be recorded against specific region of the brain using electrodes positioned across the scalp. Several EEG signal capturing devices help to acquire raw EEG signals. Synchronization between subject, stimuli, and EEG signal capturing device makes a valuable contribution to acquire the ongoing emotion related activity in the brain. The acquired raw EEG signal contains noise and various artifacts and hence, requires preprocessing.
2.2
Preprocessing
The purpose of preprocessing is to convert raw EEG signals into the normalized form. Preprocessing techniques help to remove unwanted artifacts and improve signal to noise ratio. Various preprocessing techniques such as Butterworth filter, Notch filter, Adaptive filters, and FIR filter help to preprocess EEG signal of each emotion and transforms raw EEG signal into normalized form. Moreover, every EEG signal of each channel has inherent component with some higher order statistics. Independent Component Analysis (ICA) and Principal Component Analysis (PCA) methods effectively contribute for extracting noise free components of EEG signals [7]. Thus, the preprocessed dataset contains collection of maximal noise free components of EEG signals.
2.3
Power Spectrum Analysis
EEG signals are described in terms of rhythmic activity and get transformed into frequency bands namely; delta (δ), theta (θ), alpha (α), beta (β), and gamma (γ) as depicted in Table 1. The noise free EEG signal in preprocessed dataset requires power spectrum analysis for frequency bands separation. Fast Fourier transform and Welch’s methods contribute to perform power spectral of the noise free signal. These methods convert time domain EEG signal into frequency domain and divides the EEG signal into frequency bands as shown in Table 1 [8]. Usually, the power spectrum is analyzed on the basis of broader frequency bands, which represent the sum of power of several smaller frequency bands as depicted in Fig. 2. Power spectrums of all channels are closely intensive and overlapping hence difficult to analyze. ICA helps to separate these overlapping components of channels for each frequency band for emotion analysis. The individual component provides more accurate reading of activity power spectrum corresponding to different frequencies for each emotion and thus helps to analyze EEG signal effectively.
Table 1: Nature of Different EEG Frequency Bands
Band Freq Characteristics
(δ) 0-4 H
z
(θ) 4-8 H
z
(α) 8-13 Hz
(β) 13-30 Hz
(γ) 30 -50 Hz
2.4
Relative Power Prediction
Each frequency band of EEG signal extracted in power spectrum analysis is associated with absolute and relative power. Absolute power of EEG signal is the sum of power spectrum density values for each frequency band of EEG signal in each emotion and is measured in microvolts. Absolute power of a band expresses integral of all power values within its frequency range and hence, represents band power of EEG signal in specific emotion. Maximum absolute power assists to analyze each EEG frequency band. On the other hand, relative power is percentage of power in any band compared with total power of EEG signal in each emotion. Relative power represents the percentage of signal made up of oscillations in a particular band. It shows the percentage of signal accounted by specific band [9]. Relative power for each extracted frequency band for each emotion is expressed as follows:
On the basis of relative power values obtained using Eq. (1), relative power set Rk is defined for each frequency band for
each emotion as:
[image:2.595.54.279.288.554.2]
Fig. 1: Relative Power Spectrum based Range Estimation Framework
Rk = { Rji, ……. ,RMN } where i=1, 2, …, N and j=1, 2, …, M … (2)
where N is the number of channels, M is number of emotion, and R represents the relative power value of kth frequency band. Thus, combined feature vector of relative power is shown in Eq. (3).
… (3)
where Rα, Rβ, Rγ, Rθdenote sets of relative power values for alpha, beta, gamma, and theta band respectively each of size (M*N).
2.5
Range Estimation
A
range
is variation in upper and lower limits of particular feature vector representing EEG signal in each emotion. A range of the entire group of emotion is included between two points on a scale of measurement or quality and it helps to understand the amount of dispersion in the EEG data forFRP
C
o
n
st
ru
ct
io
n
Raw EEG Signal
Power Spectrum Analysis
Relative Power Prediction
Relationship Representation using
Bayesian Network
Range Estimation
α β δ γ θ
Rα Rβ Rγ Rθ Component Separation and Noise
Removal
Preprocessed Dataset
P
re
p
ro
ce
ss
in
specific emotion. A large range value indicates greater dispersion whereas a small range value indicates less dispersion in the values of EEG features. Here, the range for each EEG frequency band is based on relative powers using upper and lower limits of each set Rk in feature vector FRP. It is essential to identify lower limit l and upper limit u for each relative power set Rk for range estimation in each emotion. Each Rk is required to sort it in ascending order of relative power values. The values of l and u help to specify range as l to u for each frequency band and for each emotion.
2.6
Relationship Representation using
Bayesian Network
A Bayesian network represents the causal probabilistic relationship among a set of variables and their conditional dependences. It consists of directed acyclic graph which captures qualitative belief structure of distribution and numerical components which specifies conditional probability distribution. The relationship between ith frequency band and each emotion in E is expressed using Bayesian network with conditional probabilities. Here, frequency bands and each discrete emotion act as nodes for Bayesian network. Links represent dependencies between nodes. The conditional probabilities between each frequency band and emotion are stated as:
... (4)
[image:3.595.316.549.375.540.2]where, variable E={e1, e2, ….en} set of emotional states, Fi represents ith frequency band feature vector with D elements [10]. The maximum probability value in each frequency band for each emotion contributes in construction of Bayesian network.
Fig. 2: Power Spectral of EEG Signal
3.
EXPERIMENTAL SETUP AND
EXECUTION
In order to examine the neural signature of different emotions and stable pattern over time, an emotion experiment is designed to collect EEG data. The raw EEG data is captured from 16 subjects (8 male and 8 female) using EMOTIV EPOC device for happy, sad and fear emotions. The device uses sequential sampling method with sampling rate 128 samples per second and 16 bit analog to digital converter. The configuration of electrodes positioning in EMOTIV is based on the International 10-20 system [11]. Implementation of RPSRE framework is realized on Windows XP using EEGLAB tool on MATLAB 16A [12].
The input raw EEG signals are captured in .edf format for
each subject from 14 different positions across the brain for happy, sad and fear emotion. The raw EEG data is preprocessed using bandpass filter between 0-50Hz for removing the noise and artifacts in EEG signals. Independent components are separated for each channel using ICA. A preprocessed dataset containing EEG data of 16 subjects and three emotions is formed and is stored in numerical format. Further, frequency bands (α, β, θ, δ, γ) are estranged using Welch method for each EEG signal in preprocessed dataset during power spectrum analysis. Relative power prediction, range estimation and relationship representation are the main highlights of our research work in this paper as shown in Fig. 1.
Relative power prediction phase is concerned with absolute and relative powers of frequency bands. It works on frequency bands extracted in power spectrum analysis phase. First, absolute powers for each EEG frequency band for each of three emotions are premeditated. The absolute powers are calculated for different regions of brain along with combination of electrode pairs using preprocessed EEG dataset as illustrated in Fig. 3. Next, relative power sets
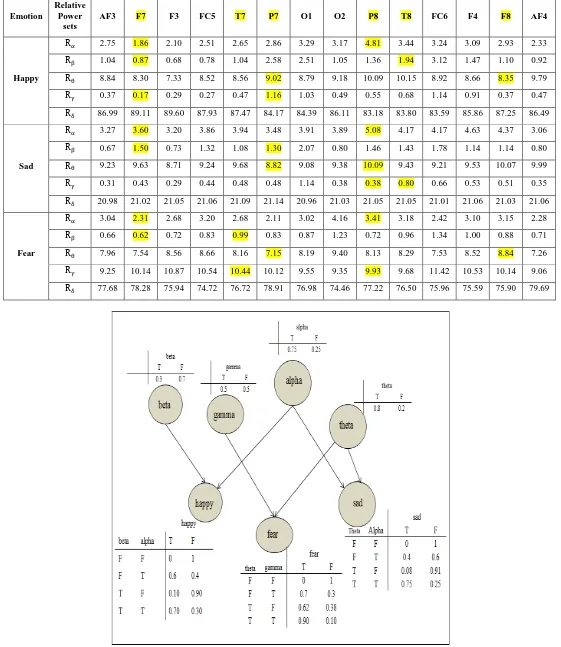
[image:3.595.54.280.414.569.2]are constructed using same EEG dataset for 14 channels and three emotions as shown in Table 2. Thus, four relative power sets corresponding to each frequency band are gained each of size [14*16*3]. The average relative powers of all subjects for each set of frequency bands in each emotion are depicted in Table 2. Delta band is eliminated from analysis as it contains very low frequencies inducing noise.
Fig. 3: Absolute Powers of EEG Frequency Bands for Each Emotion
Table 2: Relative Powers of Frequency Bands for Emotions
Emotion
Relative Power
sets
AF3 F7 F3 FC5 T7 P7 O1 O2 P8 T8 FC6 F4 F8 AF4
Happy
2.75 1.86 2.10 2.51 2.65 2.86 3.29 3.17 4.81 3.44 3.24 3.09 2.93 2.33 1.04 0.87 0.68 0.78 1.04 2.58 2.51 1.05 1.36 1.94 3.12 1.47 1.10 0.92
8.84 8.30 7.33 8.52 8.56 9.02 8.79 9.18 10.09 10.15 8.92 8.66 8.35 9.79 0.37 0.17 0.29 0.27 0.47 1.16 1.03 0.49 0.55 0.68 1.14 0.91 0.37 0.47
86.99 89.11 89.60 87.93 87.47 84.17 84.39 86.11 83.18 83.80 83.59 85.86 87.25 86.49
Sad
3.27 3.60 3.20 3.86 3.94 3.48 3.91 3.89 5.08 4.17 4.17 4.63 4.37 3.06
0.67 1.50 0.73 1.32 1.08 1.30 2.07 0.80 1.46 1.43 1.78 1.14 1.14 0.80 9.23 9.63 8.71 9.24 9.68 8.82 9.08 9.38 10.09 9.43 9.21 9.53 10.07 9.99
0.31 0.43 0.29 0.44 0.48 0.48 1.14 0.38 0.38 0.80 0.66 0.53 0.51 0.35 20.98 21.02 21.05 21.06 21.09 21.14 20.96 21.03 21.05 21.05 21.01 21.06 21.03 21.06
Fear
3.04 2.31 2.68 3.20 2.68 2.11 3.02 4.16 3.41 3.18 2.42 3.10 3.15 2.28 0.66 0.62 0.72 0.83 0.99 0.83 0.87 1.23 0.72 0.96 1.34 1.00 0.88 0.71
7.96 7.54 8.56 8.66 8.16 7.15 8.19 9.40 8.13 8.29 7.53 8.52 8.84 7.26 9.25 10.14 10.87 10.54 10.44 10.12 9.55 9.35 9.93 9.68 11.42 10.53 10.14 9.06 77.68 78.28 75.94 74.72 76.72 78.91 76.98 74.46 77.22 76.50 75.96 75.59 75.90 79.69
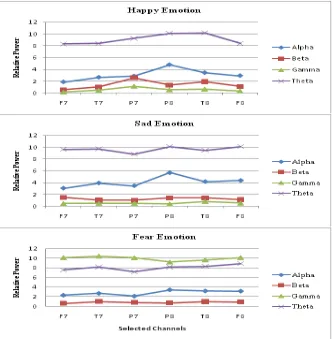
Fig. 5: Comparison of Relative Powers of EEG Frequency Bands for Emotions
Table 3: Estimated Relative Power based Ranges for Emotions
Bands
Emotions Alpha Beta Theta Gamma
Happy 1.0-5.0 0.9-2.0 8.5-9.0 0.1-1.2 Sad 3.5-5.0 1.3-1.5 9.0-10 0.3-0.8 Fear 2.0-3.5 0.6-0.9 10.0-11.0 7.0-8.9
Relationship representation phase appertains with describing relationships between frequency bands and emotions. This is accomplished by designing a Bayesian network between dominant frequency bands and emotion. Happy, sad, fear emotions and alpha, beta, theta, and gamma bands are identified as nodes to Bayesian Network. Edges between these nodes represent relationship between them. Here, each frequency band is considered as independent node whereas node corresponding to each emotion acts as dependent node. The conditional probabilities are calculated based on the relative power values of each frequency band and emotion as shown in Fig. 4. The conditional probability distribution is defined for each node in the network. The highest probability value of each frequency band for each emotion is utilized for constructing Bayesian network.
4.
RESULTS AND DISCUSSION
RPSRE framework is implemented framework against fourteen different positions of the brain for happy, sad, and fear emotions. The frequency bands are evaluated on the basis of absolute and relative powers of EEG signals. In case of absolute power, the maximum absolute power of frequency band in each emotion for each combination of electrode pairs is examined as illustrated in Fig. 3. In relative powers scenario, we estimate the range using lower and upper limit of relative powers of each EEG frequency band in specific emotion. Here, we discuss the observations drawn for combination of electrode pairs F7 and F8 showing frontal region, P7 and P8 corresponding to parietal region and T7 and T8 related to temporal region for happy, sad, and fear emotions as follows:
Case I: Ranges for Happy emotion
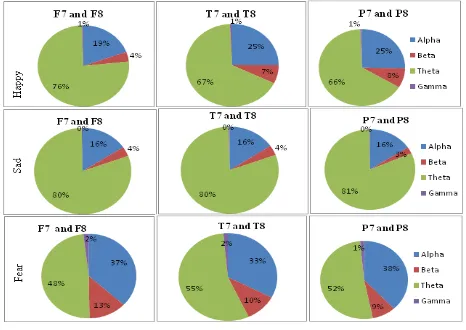
The average maximum absolute power is observed in of theta band as 76%, 67%, and 66% for F7 and F8, T7 and T8, and P7 and P8 electrode pairs respectively. The average
ranges estimated using relative powers as per Table 2 are 1.0-5, 0.9-2, 0.1-1.2, and 8.5-9 for alpha, beta, gamma, and theta bands respectively for happy emotion in all electrode pairs. The conditional probabilities shown in Fig. 4 witnessed that happy emotion is related to activation of alpha and beta bands. Case II: Ranges for Sad emotion
respectively in all electrodes. It is noticed that theta and alpha bands are responsible for generating sad emotion based on their CPT values in Fig. 4.
Case III: Ranges for Fear emotion
In this scenario, the average maximum absolute power is observed again in theta band as 48% for F7 and F8, 55% T7 and T8, whereas 52% for P7 and P8 electrode pairs. However, the percentage of absolute power in theta band is decreased in fear emotion and shows more activation in alpha band. The average ranges estimated using relative powers are 2-3.5, 0.6-0.9, 10-11, and 7-8.9 for alpha, beta, gamma, and theta bands respectively in all electrodes. Here, theta and alpha bands are responsible for generating fear emotion as per probabilities shown in Bayesian network. Further, the comparison of all estimated ranges using RPSRE is depicted in Fig. 5. It shows that there exists significant variation between ranges of each frequency band for specific emotion.
5.
CONCLUSION
A novel RPSRE framework have been proposed for range and relationship estimation of EEG frequency bands for happy, sad and fear emotion. The range for each frequency band in each emotion is predicted using relative powers of EEG signal. Probabilistic inference using Bayesian network is utilized to represent relationship between emotion and frequency bands. It is witnessed that there exist conditional dependencies between frequency bands and specific emotion and can be effectively represented using Bayesian network. Also, an attempt has been to estimate the range and relationship for frequency bands based on their relative power values for each emotion. Further, estimated ranges of each frequency band for different emotion will help to build effective emotion recognition system.
6.
REFERENCES
[1] G. Pfurtscheller, and F. L. Da Silva, “Event-related EEG/MEG synchronization and desynchronization: basic principles,” Clinical neurophysiology, vol. 110, no. 11, pp. 1842-1857, 1999.
[2] S. Sanei, and J. Chambers, “EEG Signal Processing, 313 p,” ed: John Wiley & Sons Ltd., Chichester, England, 2007.
[3] W.-L. Zheng, and B.-L. Lu, “Investigating critical frequency bands and channels for EEG-based emotion recognition with deep neural networks,” IEEE Transactions on Autonomous Mental Development, vol. 7, no. 3, pp. 162-175, 2015.
[4] M. K. Ahirwal, and N. D. Londhe, “Power spectrum analysis of EEG signals for estimating visual attention,” International Journal of computer applications, vol. 42, no. 15, 2012.
[5] Y.-Y. Lee, and S. Hsieh, “Classifying different emotional states by means of EEG-based functional connectivity patterns,” PloS one, vol. 9, no. 4 pp. e95415, 2014.
[6] Z. Yin, Y. Wang, L. Liu, W. Zhang, and J. Zhang, “Cross-subject EEG feature selection for emotion recognition using transfer recursive feature elimination,” Frontiers in neurorobotics, vol. 11, pp. 11-19, 2017. [7] Sarma, Parthana, Prakash Tripathi, Manash Pratim
Sarma, and Kandarpa Kumar Sarma. "Pre-processing and Feature Extraction Techniques for EEGBCI Applications-A Review of Recent Research." ADBU Journal of Engineering Technology, vol. 5, no. 1 2016. [8] Welch, P. D., "The use of Fast Fourier Transform for the
estimation of power spectra: A method based on time averaging over short, modified periodograms", IEEE Transactions on Audio and Electroacoustics, AU vol.15, no.2 pp. 70–73, 1967 doi:10.1109/TAU.1967.1161901 [9] K.-E. Ko, H.-C. Yang, and K.-B. Sim, “Emotion
recognition using EEG signals with relative power values and Bayesian network,” International Journal of Control, Automation and Systems, vol. 7, no. 5, pp. 865, 2009. [10] Horný, Michal. "Bayesian networks." Boston University
School of Public Health 17, 2014.
[11] H. H. Jasper, “The ten twenty electrode system of the international federation,” Electroencephalography and Clinical Neurophsiology, vol. 10, pp. 371-375, 1958. [12] A. Delorme, and S. Makeig, “EEGLAB: an open source