Experimental Study on Micro Laser Fluorescence Spectrometer
Zhaoshuo Tiana, Ling Wanga, Shanshan Zhang b, Yanchao Zhanga, *, Libao Liua, Erdan
Guc
aHarbin Institute of Technology at Weihai, No.2 West Wenhua Road, Weihai, China, 264209 bShandong Institute of Shipbuilding Technology,No.2 West Wenhua Road, Weihai, China, 264209
c University of Strathclyde,Institute of Photonics, 16 Richmond Street, Glasgow, United Kingdom,G1 1XQ
Abstract. This paper presents a kind of miniature handheld laser fluorescence spectrometer, which integrates a laser emission system, a spectroscopic system and a detection system into a volume of 100×50×20 mm3. A USB interface is connected to PC for data processing and spectrum display. The emitted laser wavelength is 405 nm. A spectral range is 400~760 nm and 2 nm optical resolution has been achieved. This spectrometer has the advantages of compact structure, small volume, high sensitivity, and low cost.
Keywords: spectrometer, laser, fluorescence,
*Yanchao Zhang, E-mail: [email protected]
1 Introduction
Comparing with traditional detection methods, laser-induced fluorescence(LIF) technology is a
kind of molecular fluorescence spectrometry with high precision, large measuring range and fast
measuring speed. Currently it has become a very important and effective means on spectrum
analysis and detection. The application range covers the fields of industry, agriculture, life science,
environmental science, material science, and food science etc. 1-6. The tendency of its development
is intelligence, miniaturization, integration, chip module and system engineering, which meets the
on-site rapid detection and civilian needs.
However, most popular laser-induced fluorescence detection instruments in the market are large
in size and high in price 7-9. In addition, these instruments commonly used in the laboratory are not
suitable for on-site rapid detection, and thus the instrument application was greatly confined.
Recently a variety of miniaturized and light-weight spectral detection instruments have been
with high sensitivity. In the experiments we carried out on-site spectral detection on various solids
and liquids without opening the transparent packages or containers. The tested solids and liquids
also included the ordinary family cooking oils, liquors, pesticides and foods. In addition to the
civil use, our spectrometer also has wide application prospect in areas of scientific research,
industrial production, environmental monitoring, etc.
2 The structure of the instrument
As is shown in Fig. 1, the miniature handheld laser fluorescence spectrometer is composed of four
parts: the laser emission system, the spectroscopic system, the detection system, and the data
processing system. The laser emission system consists of a laser diode and a driver. A small
low-cost 405 nm semiconductor laser is chosen as the excitation source, which output the laser beam
in either a continuous or pulsed manner with the computer-controlled laser driver. A long wave
pass filter is placed in front of the small transmission grating to avoid the disturbance of reflected
laser during detection. To ensure clear image formation of the spectrum on the CCD surface of the
detection system, a lens is placed behind the spectroscopic system. The data acquisition card
captures the CCD imaging data, followed by data processing and spectrum display on the computer
screen. To avoid the disturbance of the packaging materials, a certain angle is designed between
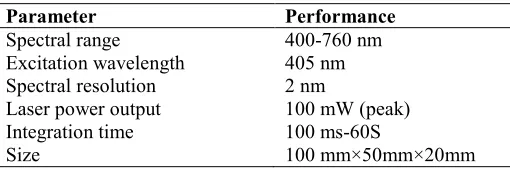
the laser emission path and the optical axis of the receiving system. The main parameters are shown
in Table 1. The spectral range is 400-760 nm. The Laser power output is 100 mW. The minimal
precision of the spectral resolution is 2 nm.
The main features of the spectrometer are as follows:
is half the frame rate of CCD data acquisition. In other words, the adjacent two frames acquired
signal of the CCD are detected either with the background spectrum or with LIF adding the
background spectrum. The former frame contains the background spectrum and instrument noise
signal, while the latter contains the laser-induced fluorescence spectrum signal in addition to the
signals of the former. The external light interference can be greatly reduced by subtracting the two
adjacent frame signals, and thus improve the instrument sensitivity and signal-to-noise ratio.
(2) The spectrometer is suitable to detect liquid and solid targets of different shapes. The angle
between the laser emission direction and the optical axis will ensure that the detected light is the
fluorescence from the liquid sample instead of the fluorescence from the bottle surface.
(3) The system of the spectrometer is quick in response and real-time spectral curves can be
displayed.
(4) The spectrometer is of small size (100 mm×50 mm×20 mm) and low cost (less than 500 $).
It is portable and easy to operate.
3. Experimental detection
3.1 Edible oil spectrum detection
The edible oil samples were bought from the supermarket, including soybean oil, olive oil,
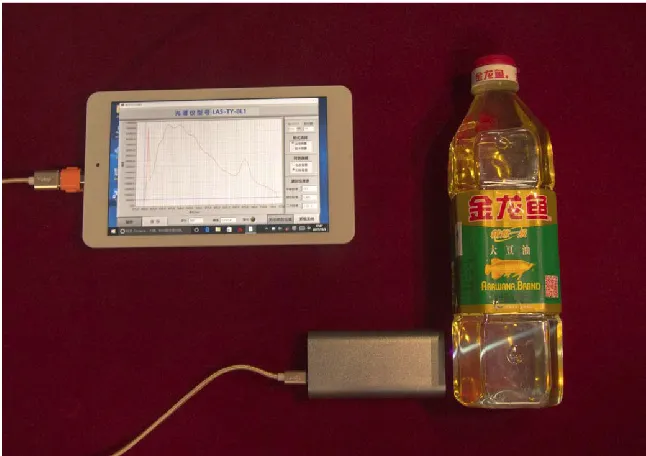
sunflower oil, peanut oil, and corn oil, etc. The fluorescence from the samples can be directly
measured by the spectrometer contacting the surface of the plastic bottle as shown in Fig. 2. The
results are not affected by the fluorescence from the bottle surface or the ambient light. The
detecting results of the edible oil samples with our spectrometer are analyzed and the spectrum
curves are shown in Fig. 3. The fluorescence from different samples are discriminative. The two
blend oil and Jinlongyu blend oil. However, the peak shapes and relative intensities of these three
samples are different. As for the olive oil, only one obvious spectrum peak appears. These results
show the spectrometer can discriminate fake or substandard edible oil products.
3.2 Water quality detection
Currently the laser-induced fluorescence technique has been applied in the detection of
chlorophyll, dissolved organic matter (DOM), and petroleum pollutants 12-15, etc. It can also be
applied to dynamic monitoring of water pollution. We measured the laser fluorescence in water
with the miniature spectrometer. Fig. 4 shows the laser-induced fluorescence and Roman spectrum
of tap water and mineral water. It can be seen that the fluorescence peak of the tap water is
relatively strong (around 525 nm) because of the high content of organic soluble matter in it, while
the mineral water and pure water have only obvious Raman peak and very weak fluorescence peak.
The water quality can be calculated by comparing the Raman peak and the fluorescence peak. In
addition, the Raman peak of the water is obvious and high compared with that of the noise at the
figure bottom. The result shows the spectrometer has high sensitivity.
3.3 Solid Target Spectrum Detection
In addition to water, oil, alcohol and other transparent or translucent liquid substances, the
spectrometer can also test solid targets such as fruits, vegetables, gemstones, paint, etc. In the
experiment, we measured the fluorescence spectra of the holly leaves and surfaces of the apples.
As is shown in Fig. 5, the 685 nm characteristic fluorescence peak intensity of the leaves is stronger
than that of the apples. The chlorophyll content of plants can be evaluated by suitable algorithms
4. Conclusion
In this paper, the miniature laser fluorescence spectrometer we designed is reported. It has the
advantages of small size, low cost and high sensitivity, and can be applied to the detection of a
variety of solid or liquid substances. In order to test the performance of the spectrometer,
experiments on the laser induced fluorescence spectra of edible oil, water and plants have been
carried out. The minimal precision of the spectral resolution is 2 nm.
In the process of the water quality detecting, the laser-induced fluorescence is relatively weak and
strong noise spectrum can be detected. Nevertheless, the Raman peak of water (3300 cm-1) is more
obvious, which is a proof that the spectrometer has high sensitivity.
In addition to scientific research, industrial production, and environmental protection, the
application of the spectrometer can be extended to the quality and safety testing on ordinary family
cooking oils, liquors, pesticides and foods, etc. This experimental study on the spectrometer means
to promote its civil applications.
Acknowledgments
This work was supported by the National Natural Science Foundation of China (61505043), the
Sci-entific Research Foundation of Harbin Institute of Technology at Weihai (Gran No. HIT (WH)
201502), and the international cooperation project by MOST(2015DFA70110)
References
1. Yang J, Du L, Sun J, et al. Estimating the leaf nitrogen content of paddy rice by using the combined
2. Ranulfi A C, Cardinali M C B, Kubota T M K, et al. Laser-induced fluorescence spectroscopy applied
to early diagnosis of citrus Huanglongbing[J]. Biosystems Engineering, 2016, 144: 133-144.
3. Yuan F, Rui-mei W, Shi-rong A, et al. Identification Study of Edible Oil Species with Laser Induced
Fluorescence Technology Based on Liquid Core Optical Fiber[J]. Spectroscopy and Spectral Analysis,
2016, 36(10): 3202-3206.
4. Tong S, Xin-xin M, Xiao-zhen L, et al. Qualitative Detection of Procymidone in Edible Vegetable Oils
by Near Infrared Spectroscopy and Variable Selection Methods[J]. SPECTROSCOPY AND
SPECTRAL ANALYSIS, 2016, 36(12): 3915-3919.
5. Gong W, Yang J, Shi S, et al. The application of time decay characteristics of laser‐induced
fluorescence in the classification of vegetation[J]. Luminescence, 2017, 32(1): 17-21.
6. Gameiro C, Utkin A B, Cartaxana P, et al. The use of laser induced chlorophyll fluorescence (LIF) as
a fast and non-destructive method to investigate water deficit in Arabidopsis[J]. Agricultural Water
Management, 2016, 164: 127-136.
7. Lv Y, Zhang J, Zhang D, et al. Tunable narrowband volume holographic imaging spectrometer for
macroscopic fluorescence molecular tomography[J]. Optical Engineering, 2016, 55(12):
123113-123113.
8. Guduru S S K, Scotognella F, Chiasera A, et al. Highly integrated lab-on-a-chip for fluorescence
detection[J]. Optical Engineering, 2016, 55(9): 097102-097102.
9. Carestia M, Pizzoferrato R, Gelfusa M, et al. Development of a rapid method for the automatic
classification of biological agents' fluorescence spectral signatures[J]. Optical Engineering, 2015,
54(11): 114105-114105.
10. Fang X X, Li H Y, Fang P, et al. A handheld laser-induced fluorescence detector for multiple
applications[J]. Talanta, 2016, 150: 135-141.
11. Mu T, Chen S, Zhang Y, et al. Portable detection and quantification of olive oil adulteration by
12. Altenburger R, Ait-Aissa S, Antczak P, et al. Future water quality monitoring—adapting tools to deal
with mixtures of pollutants in water resource management[J]. Science of the total environment, 2015,
512: 540-551.
13. Wan W B, Hua D X, Le Jing L M X, et al. Laser-induced chlorophyll fluorescence lifetime
measurement and characteristic analysis[J]. 2013.
14. Wen-Bo W, Deng-Xin H, Jing L, et al. Study of plant fluorescence properties based on laser-induced
chlorophyll fluorescence lifetime imaging technology[J]. ACTA PHYSICA SINICA, 2015, 64(19).
15. Han X S, Liu D Q, Luan X N, et al. Discrimination of Crude Oil Samples Using Laser-Induced
Time-Resolved Fluorescence Spectroscopy[J]. Guang pu xue yu guang pu fen xi= Guang pu, 2016, 36(2):
445-448.
Biographies
Zhaoshuo Tian is a professor at the Harbin Institute of Technology at Weihai. He received PhD
degree in physical electronics from the Harbin Institute of Technology in 2001. His current
research interests include laser radar, spectrum and optoelectronic systems. He is a member of
IEEE.
Ling Wang is a Lecturer in Information Optoelectronics Research Institute, Harbin Institute of
Technology at Weihai. Her current research interests include digital image recognition and
intelligent instrument design.
Shanshan Zhang is an engineer in Shandong Institute of Shipbuilding Technology, received her
master degree from Shandong University. Her current research interests include laser spectroscopy
Yanchao Zhang is a lecturer in Information Optoelectronics Research Institute, Harbin Institute
of Technology at Weihai. He received PhD degree in physical electronics from the Harbin Institute
of Technology in 2014. His current research interests include laser technology, laser application
and optoelectronic system.
Libao Liu is an associate professor in the Department of Optoelectronic Science, Harbin Institute
of Technology, Weihai, China. His current research interests include development and application
of optoelectronic technology and equipment.
Erdan Gu is a research team leader in Institute of Photonics, University of Strathclyde, Glasgow,
U.K., He received the Ph.D. degree in thin-film physics from Aberdeen University, Aberdeen,
U.K., in 1992. His research interests include micro/nano photonic materials and devices,
optoelectronics, diamond optics and photonics, hybrid organic/inorganic optoelectronic devices
and micro-systems.
[image:8.612.178.433.514.599.2]Table
Table 1 Main parameters and performance index
Parameter Performance
Spectral range 400-760 nm Excitation wavelength 405 nm Spectral resolution 2 nm
Laser power output 100 mW (peak) Integration time 100 ms-60S
Size 100 mm×50mm×20mm
Fig. 1 Structure of the miniature laser fluorescence spectrometer.
Fig. 2 Picture of testing of edible oil by micro laser fluorescence spectrometer
350 400 450 500 550 600 650 700 750 800 0
5000 10000 15000 20000 25000 30000
Int
en
si
ty
(a
rb
.)
Wavelength(nm)
350 400 450 500 550 600 650 700 750 800 0
5000 10000 15000 20000 25000 30000
Int
en
si
ty
(a
rb
.)
[image:9.612.127.491.88.237.2] [image:9.612.144.467.277.505.2]350 400 450 500 550 600 650 700 750 800 0 5000 10000 15000 20000 25000 30000 35000 Int en si ty (a rb .) Wavelength(nm)
350 400 450 500 550 600 650 700 750 800 -500 0 500 1000 1500 2000 2500 3000 Int en si ty (a rb .) Wavelength(nm) (c) (d)
Fig. 3 Results of spectral measurement of different oil species: (a) Jinlongyu soybean oil, (b)
Hujihua blend oil, (c) Jinlongyu blend oil, (d) olive oil
350 400 450 500 550 600 650 700 750 800 0 200 400 600 800 1000 1200 1400 1600 1800 Int en si ty (a rb .) Wavelength(nm)
[image:10.612.115.478.83.223.2]350 400 450 500 550 600 650 700 750 800 0 200 400 600 800 1000 1200 1400 Int en si ty (a rb .) Wavelength(nm) (a) (b)
Fig. 4 Comparison of laser induced fluorescence and Raman spectrum of tap water with mineral
water: (a) tap water, (b) mineral water
350 400 450 500 550 600 650 700 750 800 0 5000 10000 15000 20000 25000 30000 35000 Int en si ty (a rb .) Wavelengh(nm)
350 400 450 500 550 600 650 700 750 800 0 2000 4000 6000 8000 10000 12000 14000 Int en sity(a rb .) Wavelength(nm)
(a) (b)
[image:10.612.115.483.302.441.2] [image:10.612.115.477.518.658.2]