ECNU: Using Multiple Sources of CQA-based Information for Answer
Selection and YES/NO Response Inference
Liang Yi, Jianxiang Wang, Man Lan∗
Shanghai Key Laboratory of Multidimensional Information Processing Department of Computer Science and Technology,
East China Normal University, Shanghai 200241, China
{51121201035, 51141201062}@ecnu.cn; [email protected]∗
Abstract
This paper reports our submissions to com-munity question answering task in SemEval-2015, which consists of two subtasks: (1) pre-dict the quality of answers to given question as good, bad, or potentially relevantand (2) identifyyes,noorunsureresponse to a given YES/NO question based on thegood answer-s identified by answer-subtaanswer-sk 1. For both answer-subtaanswer-skanswer-s, we adopted supervised classification method and examined the effects of heterogeneous features generated from community question answering data, such as bag-of-words, string matching, semantic similarity, answerer in-formation, answer-specific features, question-specific features, etc. Our submitted primary systems ranked the forth and the second for the two subtasks of English data respectively.
1 Introduction
Community Question Answering (CQA) system-s system-such asystem-s Yahoo!Answers rely on users to provide answers (i.e., user generated content) for questions posted. Generally such systems are quite open and the answers provided by users are not always of high quality. For example, a bad answer may present ir-relevant opinions or issues, contain only URL links without direct answer, or even be written informally. Therefore, in order to achieve high-quality user ex-perience and maintain high levels of adherence, it is critical to present high-quality answers and provide direct responses for users.
The CQA task in SemEval-2015 (M`arquez et al., 2015) provides such a universal platform for
re-searchers to make a comparison between differen-t approaches. This differen-task consisdifferen-ts of differen-two subdifferen-tasks: (1) subtask A is to classify the quality of answers asgood, potential or bad, which also refers to the task of answer quality prediction (Jeon et al., 2006; Agichtein et al., 2008); (2) subtask B is to infer the global answer of a YES/NO question to beyes, no orunsurebased on individualgoodanswers.
Most of the previous research on answer quality prediction has focused on extracting various features to employ ranking or classification methods (Sur-deanu et al., 2011; Shah and Pomerantz, 2010), such as textual features (Agichtein et al., 2008; Blooma et al., 2010) including the length of an answer, over-lapped words between a question-answer (QA) pair, etc. Another kind of widely used feature is extracted from answerer profile information (Shah and Pomer-antz, 2010), such as the number of best answers, the achieved levels and the earned points. However, such information is not often available in real world. Moreover, a recent study (Toba et al., 2014) has tak-en question type into consideration to make the an-swers quality prediction.
predictedgoodanswer, then we performed a major-ity voting to summarize the global answer for each question.
The rest of this paper is structured as follows. Section 2 describes our systems, including features, algorithms, etc. Section 3 shows experiments on training data and results on test data. Finally, con-clusions and future work are given in Section 4.
2 Our Systems
For both tasks we adopted supervised classification methods and extracted various features from mul-tiple sources to predict answer quality and infer YES/NO response.
2.1 Data Extraction
English data is extracted from Qatar Living Forum1 and provided with XML-format. Each data file con-sists of a list of question tags, where each question is followed by a list of answer tags to this question. Each question or answer has a subject, a body, and a list of attributes from which we can extract signifi-cant features. For example, a question has attributes of question category (overall27categories, e.g., Ed-ucation, Cars, etc.), identifier of asker, question type (GENERAL or YES/NO) and an answer also has an-swerer identifier.
To obtain complete contents of a question or an answer, we merged the contents extracted from sub-ject and body. Exceptionally, if subsub-ject is substring of body or subject of an answer starts with “RE:”, we just extracted the contents from body.
Moreover, to reduce the influence ofNot English answers to the subsequent classification, we filtered out theNot Englishanswers from data. To discov-er such answdiscov-ers we found out unusual words for each answer by comparing word set of this answer with an English vocabulary with 235,887 words from NLTK2wordscorpus, if the number of unusual words is over10and the ratio over answer length is above60%we then regarded it asNot English.
2.2 Pre-processing
After data extraction we performed the following preprocessing operations. Firstly, HTML character
1http://www.qatarliving.com/forum 2http://www.nltk.org/
encodings are substituted by the actual characters (e.g., “&” is converted into whitespace). Then HTML tags, URLs, emoticons, ending signatures and repeating punctuation are removed from data. After that, we collected a slang list from Internet and replaced the informal words with formal words (e.g., “u r” is converted into “you are”). For the processed data, we performed tokenization and POS tagging using Penn Treebank tokenizer and POS tagger in NLTK. The words are lemmatized using WordNet-based lemmatizer implemented in NLTK.
2.3 Features of Task A
We extracted six types of features from multiple sources of CQA-based information, i.e., bag-of-words (BoW) and answer-specific features (AS) from answer, string matching (SM) and semantic similarity (SS) from QA pair, answerer informa-tion features (AI) from answerer profile, quesinforma-tion- question-specific features (QS) from question.
2.3.1 Bag-of-Words for Answer (BoW)
We collected words from training and develop-ment answer set and adopted binary BoW represen-tation. To reduce the problem of data sparse, we selected the words with frequency higher than four, resulting in5,730words.
2.3.2 Answer-Specific Features (AS)
For each question, we extracted three answer-specific features. The first is answer length, which is computed at three levels, i.e., word, sentence and paragraph. We usedL1 normalization on the glob-al answer set. To gain insight on the effect of an-swer length for each individual question, we also de-signed a length ratio feature to record the ratio of the length of each answer to the maximal answer length for the same question.
represent if there is at least one of above suggestion words in a given answer.
2.3.3 String Matching between QA (SM)
The above two types of features are both extracted from answer regardless of the question asked. How-ever, the string matching features are to consider the overlapped words from a given QA pair.
Word: This feature group records the proportions of co-occurred words between a QA pair, which are calculated using six measures:|A∩B|/|A|,|A∩B|/|B|, |A−B|/|A|,|B−A|/|B|,|A∩B|/|A∪B|,2∗|A∩B|/(|A|+ |B|), where |A|and |B|denote the number of
non-repeated words of question A and answer B. How-ever, the same word appearing in different contex-t could vary in word forms and normalizing words may obtain more accurate overlapped proportions, so we computed each measure at three word forms: original, lemmatized and stem form.
POS: This POS feature is similar to the above word feature. We use three measures: |A∩B|/|A|, |A∩B|/|B|,|A∩B|/|A∪B|to compute overlapped
proportion of POS tags for nouns, verbs, adjectives and adverbs.
n-gram: Unlike the above two features measuring the overlap of single words or POS without consid-ering multiple continuous words, then-gram feature is to calculate the Jaccard similarity of overlapped n-grams between each QA pair. The n-grams are obtained at word level (n= 2,3) and character level (n = 2,3,4). In addition, then-grams at word lev-el are obtained from original form and lemmatized form respectively.
Longest Common Sequence (LCS): The LCS
feature is to measure the LCS similarity for a QA pair on the original and lemmatized form. It is cal-culated as the length of the LCS between each QA pair at word level divided by the length of question.
2.3.4 Semantic Similarity between QA (SS)
The previous string matching feature only consid-ers the overlapped surface words or substrings in a QA pair and it may not capture the semantic infor-mation between a QA pair. Therefore, we presented the following semantic similarity features, which are borrowed from previous work.
Determining semantic similarity of sentences commonly uses measures of semantic similarity
be-tween individual words. We used knowledge-based and corpus-based word similarity features. The knowledge-based similarity estimation relies on a semantic network of words such as WordNet. In this work, we employed four WordNet-based word similarity metrics: Path(Banea et al., 2012), WUP (Wu and Palmer, 1994),LCH(Leacock and Chodor-ow, 1998) andLin(Lin, 1998) similarity. Following (Zhu and Man, 2013), the best alignment strategy and the aggregation strategy are employed to propa-gate the word similarity to the text similarity. More-over, Latent Semantic analysis (LSA) (Landauer et al., 1997) is a widely used corpus-based measure when evaluating textual similarity. We used the vec-tor space sentence similarity proposed by (ˇSari´c et al., 2012), which represents each sentence as a s-ingle distributional vector by summing up the LSA vector of each word in the sentence. In this work, two corpora are used to compute the LSA vector of words: New York Times Annotated Corpus (NYT) and Wikipedia.
Besides, following (Zhao et al., 2014), we adopt-ed the weightadopt-ed textual matrix factorization (WTM-F) (Guo and Diab, 2012) to model the semantics representations of sentences and then employed the new representations to calculate the semantic simi-larity between QA pairs using Cosine, Manhattan, Euclidean, Person, Spearmanr, Kendalltau measures respectively.
2.3.5 Answerer Information (AI)
calculated the Gi/Mi score to measure expert lev-el of an answerer in current domain among all an-swerers. Totally, we adopted54features to indicate expert domain for each answerer.
2.3.6 Question-Specific Features (QS)
Since the domain of questions may also affect the performance of answer selection, we considered to use27binary features to indicate the question cate-gory. In addition, we manually collected9question words (i.e.,where,what,when, which, who,whom, whose,whyandhow) and used9binary features to indicate if one of these question words occurs in the question.
2.4 Features of Task B
To address task B, we performed two steps. Firstly, we extracted features fromgood answers identified from task A and trained a classifier to predict theYes, NoorUnsurelabel for eachgoodanswer. Second-ly, for each given YES/NO question, we counted the answer labels ofYes,NoorUnsureand used major-ity voting to obtain the global answer.
We used three types of features for this task, which are all extracted from answer: (1) Bag-of-Words from answer (BoW), the same as in Task A; (2) Semantic Word2Vec (W2V): this feature indi-cates a vector representation of answer. We used word2vec tool3 to get word vectors with dimension d = 300and then summed up all the word vectors to obtain the answer vector. (3) Yes/No Word List (YN): we manually collected 50 affirmative words and45negation words by starting from several seed words (e.g., “yes”, “sure”, “definitely”, “no”, “ sel-dom”, “never”, etc) and then expanding the list using snowball with the aid of WordNet synset. Besides, several phrases are manually added in the list (e.g., “beyond a doubt”, “beyond question”, “not at all”, “only just”, etc). We utilized 2 binary features to indicate whether an answer contains at least one of these affirmative and negation words or not.
2.5 Classification Algorithms
We explored several widely-used supervised clas-sification algorithms including Support Vector Ma-chine (SVM), Random Forest (RF), and
Gradien-3https://code.google.com/p/word2vec/
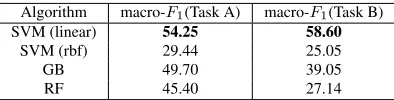
Algorithm macro-F1(Task A) macro-F1(Task B)
SVM (linear) 54.25 58.60
SVM (rbf) 29.44 25.05
GB 49.70 39.05
[image:4.612.328.525.62.112.2]RF 45.40 27.14
Table 1: Results on training data for different algorithms.
t Boosting(GB), which are implemented in scikit-learn toolkit (Pedregosa et al., 2011).
2.6 Evaluation Measures
The official evaluation measures for both tasks is macro-averaged F1. For Task A the official score is calculated on three labels: Good, Bad, Poten-tial(whereBadincludesDialogue,Not Englishand Other).
3 Experiments and Results
3.1 English Data Set
The English training and development set contain
2,900 questions with 18,186 answers and the test set contains329questions with1,976answers, con-sisting of around50%good,40%badand10% po-tentialanswers. The YES/NO questions are about
10% of all the questions, which indicates that the data for Task B is much less than Task A.
For both tasks we used training set with 2,600
questions to build classifiers and validated the per-formance on development set with300questions for algorithms comparison and features choosing.
3.2 Algorithm Choosing Experiments
We performed algorithm choosing experiments us-ing all designed features. All the parameters of algo-rithms are set to be default values from scikit-learn (Pedregosa et al., 2011). Table 1 lists the prelimi-nary algorithm comparison experimental results. We found SVM with linear kernel outperforms other al-gorithm choices for both tasks. Moreover, we tuned the trade-off parametercof SVM and when setcto
0.8we obtained a better score54.78%and58.82%
for Task A and B respectively. Therefore, in the fol-lowing experiments on training and test data, we set the algorithm to SVM with linear kernel.
3.3 Feature Comparison Experiments
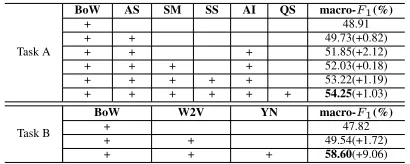
SVM (linear). In Task B we always chose the pre-dictedgood answers from the system with the best macro-F1 in Task A. Table 2 shows the results of different feature combinations where for each time we selected and added one best feature type. From this table we found the following interesting obser-vations.
Task A
BoW AS SM SS AI QS macro-F1(%)
+ 48.91
+ + 49.73(+0.82)
+ + + 51.85(+2.12)
+ + + + 52.03(+0.18) + + + + + 53.22(+1.19)
+ + + + + + 54.25(+1.03)
Task B
BoW W2V YN macro-F1(%)
+ 47.82
+ + 49.54(+1.72)
[image:5.612.83.288.167.249.2]+ + + 58.60(+9.06)
Table 2: Results of feature combinations for Task A and B, the numbers in the bracket are the performance incre-ments compared with previous result.
First, for both tasks the most effective feature type is bag-of-words from answer and this feature alone achieves48.91%for Task A and47.82%for Task B, which both outperforms the baseline system provid-ed by organizers respectively. The baseline of Task A which predicts all answers asgood just achieves
22.36%and for Task B it achieves25.0%which pre-dict all answers as yes. Moreover, in Task A the performance of other five feature types alone is far lower than bag-of-words, ranging from23%to38%
approximately.
Second, for Task A, when combining all the fea-tures together the system achieves the best perfor-mance, which indicates that all types of features make contribution more or less. Specially, among the six types of features, answerer information and semantic similarity between QA pairs make more contribution than others. This indicates that answer-er profile information is important, which is consis-tent with the findings in (Zhou et al., 2012). Be-sides, the semantic similarity captures deep relation-ship between Q-A pair than the surface word, which is helpful for performance improvement. In Task B, we also observed the similar findings, i.e., the system using all types of features achieves the best performance. Moreover, the YES/NO word list fea-ture makes great contribution to the performance im-provement. This is consistent with our expectation. Besides, although in this work the word vector fea-ture improves the performance, this improvements is
not as much as our expectation. The possible reason may be the simple way of using the vector by only summing up.
3.4 Results on Test Data
According to the above experiments on training da-ta, we configured one primary and two contrastive systems for both tasks. The only difference between these systems lies in the features and parameters in SVM. Table 3 lists the configuration of three sys-tems and their corresponding results on test data. Besides, we also list the top three results officially released by organizers.
Systems features Task Apara. result features Task Bpara. result primary all c=0.8 53.47(9) all c=0.8 55.8(3) contrastive1 all c=1.0 52.55(10) all c=1.0 50.6(4) contrastive2 all-SS c=0.8 52.27(11) all-W2V c=0.8 53.9(6) Top Systems Task A Result Task B Result
rank 1st 57.19 63.7
rank 2nd 56.41 55.8
[image:5.612.316.539.248.317.2]rank 3rd 53.74 53.6
Table 3: Configurations and results of our three submitted systems and top three results, the numbers in bracket are the official ranking out of all submitted systems.
Our primary system ranked the4th out of12 par-ticipants in Task A and the2nd out of7participants in Task B. For both tasks the performance of the pri-mary system is higher than the two contrastive sys-tems, which is consistent with the results on training data.
4 Conclusion
We build two supervised classification systems for answer selection and YES/NO response inference in CQA. Specially, we extract heterogeneous features from various information sources, i.e., answer, ques-tion, answer-question pair and answerer. Our exper-iments reveal that our designed features are all ef-fective and when we combine all types of features together the system achieves the best performance.
Acknowledgments
This research is supported by grants from Science and Technology Commission of Shanghai Munici-pality under research grant no. (14DZ2260800 and 15ZR1410700) and Shanghai Collaborative Innova-tion Center of Trustworthy Software for Internet of Things (ZF1213).
References
Eugene Agichtein, Carlos Castillo, Debora Donato, Aris-tides Gionis, and Gilad Mishne. 2008. Finding high-quality content in social media. InProceedings of the 2008 International Conference on Web Search and Da-ta Mining, pages 183–194.
Carmen Banea, Samer Hassan, Michael Mohler, and Ra-da Mihalcea. 2012. Unt: A supervised synergistic approach to semantic text similarity. InProceedings of the First Joint Conference on Lexical and Compu-tational Semantics-Volume 1: Proceedings of the main conference and the shared task, and Volume 2: Pro-ceedings of the Sixth International Workshop on Se-mantic Evaluation, pages 635–642.
Mohan John Blooma, Alton Yeow-Kuan Chua, and Dion Hoe-Lian Goh. 2010. Selection of the best answer in cqa services. InInformation Technology: New Gener-ations (ITNG), 2010 Seventh International Conference on, pages 534–539.
Weiwei Guo and Mona Diab. 2012. Modeling sentences in the latent space. InProceedings of the 50th Annual Meeting of the Association for Computational Linguis-tics: Long Papers-Volume 1, pages 864–872.
Jiwoon Jeon, William Bruce Croft, Joon Ho Lee, and Soyeon Park. 2006. A framework to predict the qual-ity of answers with non-textual features. In Proceed-ings of the 29th annual international ACM SIGIR con-ference on Research and development in information retrieval, pages 228–235.
Thomas K Landauer, Darrell Laham, Bob Rehder, and Missy E Schreiner. 1997. How well can passage meaning be derived without using word order? a com-parison of latent semantic analysis and humans. In
Proceedings of the 19th annual meeting of the Cog-nitive Science Society, pages 412–417.
Claudia Leacock and Martin Chodorow. 1998. Com-bining local context and wordnet similarity for word sense identification. WordNet: An electronic lexical database, 49(2):265–283.
Dekang Lin. 1998. An information-theoretic definition of similarity. InICML, volume 98, pages 296–304. Llu´ıs M`arquez, James Glass, Walid Magdy, Alessandro
Moschitti, Preslav Nakov, and Bilal Randeree. 2015.
Semeval-2015 task 3: Answer selection in community question answering. InSemEval 2015.
Fabian Pedregosa, Ga¨el Varoquaux, Alexandre Gram-fort, Vincent Michel, Bertrand Thirion, Olivier Grisel, Mathieu Blondel, Peter Prettenhofer, Ron Weiss, Vin-cent Dubourg, et al. 2011. Scikit-learn: Machine learning in python. The Journal of Machine Learning Research, 12:2825–2830.
Frane ˇSari´c, Goran Glavaˇs, Mladen Karan, Jan ˇSnajder, and Bojana Dalbelo Baˇsi´c. 2012. Takelab: Systems for measuring semantic text similarity. InProceedings of the First Joint Conference on Lexical and Compu-tational Semantics-Volume 1: Proceedings of the main conference and the shared task, and Volume 2: Pro-ceedings of the Sixth International Workshop on Se-mantic Evaluation, pages 441–448.
Chirag Shah and Jefferey Pomerantz. 2010. Evaluat-ing and predictEvaluat-ing answer quality in community qa. InProceedings of the 33rd international ACM SIGIR conference on Research and development in informa-tion retrieval, pages 411–418.
Mihai Surdeanu, Massimiliano Ciaramita, and Hugo Zaragoza. 2011. Learning to rank answers to non-factoid questions from web collections. Computation-al Linguistics, 37(2):351–383.
Hapnes Toba, Zhao-Yan Ming, Mirna Adriani, and Tat-Seng Chua. 2014. Discovering high quality answers in community question answering archives using a hi-erarchy of classifiers. Information Sciences, 261:101– 115.
Zhibiao Wu and Martha Palmer. 1994. Verbs seman-tics and lexical selection. InProceedings of the 32nd annual meeting on Association for Computational Lin-guistics, pages 133–138.
Jiang Zhao, Tian Tian Zhu, and Man Lan. 2014. Ecnu: One stone two birds: Ensemble of heterogenous mea-sures for semantic relatedness and textual entailment.
SemEval 2014, page 271.
Zhi-Min Zhou, Man Lan, Zheng-Yu Niu, and Yue Lu. 2012. Exploiting user profile information for answer ranking in cqa. InProceedings of the 21st internation-al conference companion on World Wide Web, pages 767–774.