
organic papers
Acta Cryst.(2007). E63, o1393–o1394 doi:10.1107/S160053680700760X Csehet al. C
6H6I2S
o1393
Acta Crystallographica Section EStructure Reports Online
ISSN 1600-5368
3,4-Diiodo-2,5-dimethylthiophene
Liliana Cseh, Georg H. Mehl, Stephen Clark and Stephen J. Archibald*
Department of Chemistry, University of Hull, Hull HU6 7RX, England
Correspondence e-mail: [email protected]
Key indicators
Single-crystal X-ray study T= 150 K
Mean(C–C) = 0.006 A˚ Rfactor = 0.036 wRfactor = 0.094
Data-to-parameter ratio = 37.3
For details of how these key indicators were automatically derived from the article, see http://journals.iucr.org/e.
Received 9 February 2007 Accepted 14 February 2007
#2007 International Union of Crystallography All rights reserved
In the crystal structure of the title compound, C6H6I2S, the
molecules pack to form one-dimensional chains connected by intermolecular S I interactions.
Comment
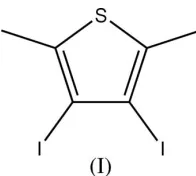
The title compound, (I) (Fig. 1), was prepared as part of a study aimed at producing new photochromic materials. Thio-phene derivatives are important intermediates in the synthesis of photochromic compounds, organic light emitting diodes (OLED) and organic conductors. For photochromic compounds, potential applications are in the areas of optical recording, full-colour display and photoswitches.
The molecule of compound (I) possesses normal geometric parameters and is essentially planar. Intermolecular S I interactions are observed in the structure with a distance of 3.641 (4) A˚ (Fig. 2). Such intermolecular interactions are also observed in the structure of tetraiodothiophene cocrystallized with tetrabutylammonium iodide (Bock & Holl, 2002), with S I distances of 3.58 and 3.59 A˚ , and other work involving I2
interactions with thioethers suggest the distances are typical
[image:1.610.282.380.324.412.2] [image:1.610.230.432.578.720.2]e.g. 3.70 A˚ in the formation of extended structural networks (Blakeet al., 1997 and 1998). Weak intermolecular C—H I interactions are not observed in this structure.
Figure 1
The solution was stirred at 323 K for 3 h and saturated aqueous sodium thiosulfate (150 ml) was added. The organic phase was extracted with diethyl ether (450 ml), dried over MgSO4and the
solvent was removed under reduced pressure. The crude product was dissolved in dichloromethane and the solution was passed through a column of silica gel to remove the coloured material (9.15 g, 57%). The compound was recrystallized from dichloromethane at room temperature, giving crystals of (I) suitable for X-ray analysis (yield 9.15 g, 57%).
Crystal data
C6H6I2S
Mr= 363.97 Monoclinic,P21=c a= 10.0141 (13) A˚
b= 6.7478 (6) A˚
c= 13.4597 (17) A˚
= 98.156 (10)
V= 900.31 (18) A˚3
Z= 4
MoKradiation
= 7.14 mm 1
T= 150 (2) K 0.490.450.35 mm
Data collection
Stoe IPDSII image-plate diffractometer
Absorption correction: numerical (X-RED32; Stoe & Cie, 2002)
Tmin= 0.073,Tmax= 0.145
7570 measured reflections 3171 independent reflections 2876 reflections withI> 2(I)
Rint= 0.053
Refinement
R[F2> 2(F2)] = 0.037
wR(F2) = 0.094
S= 1.08 3171 reflections
85 parameters
H-atom parameters constrained
max= 1.84 e A˚ 3
min= 1.56 e A˚ 3
H atoms were placed in idealized positions (C—H = 0.98 A˚ ) and refined as riding atoms, withUiso(H) = 1.2Ueq(C). The highest
resi-dual electron-density peak is located 1.05 A˚ from atom I1 and the deepest hole is located 0.67 A˚ from the same atom.
Data collection:X-AREA(Stoe & Cie, 2002); cell refinement: X-AREA; data reduction: X-RED32 (Stoe & Cie, 2002); program(s) used to solve structure: SHELXS97(Sheldrick, 1997); program(s) used to refine structure: SHELXL97 (Sheldrick, 1997); molecular graphics: ORTEP-3 (Farrugia, 1997); software used to prepare material for publication:SHELXL97(Sheldrick, 1997) andWinGX
(Farrugia,1999).
We thank the EPSRC for funds which enabled the purchase of the Stoe IPDSII diffractometer. We acknowledge the use of the EPSRC’s Chemical Database Service at Daresbury (Fletcheret al., 1996).
References
Blake, A. J., Cristiani, F., Devillanova, F. A., Garau, A., Gilby, L. M., Gould, R. O., Isaia, F., Lippolis, V., Parsons, S., Radek, C. & Schro¨der, M. (1997).J. Chem. Soc. Dalton Trans.pp. 1337–1346.
[image:2.610.82.270.73.318.2] [image:2.610.90.254.385.630.2]Blake, A. J., Devillanova, F. A., Garau, A., Gilby, L. M., Gould, R. O., Isaia, F., Lippolis, V., Parsons, S., Radek, C. & Schro¨der, M. (1998).J. Chem. Soc. Dalton Trans.pp. 2037–2046.
Figure 2
The unit-cell contents of (I), viewed along [010] (50% probability ellipsoids). The dashed lines indicate the closest intermolecular S I contacts.
Figure 3
supporting information
sup-1 Acta Cryst. (2007). E63, o1393–o1394
supporting information
Acta Cryst. (2007). E63, o1393–o1394 [https://doi.org/10.1107/S160053680700760X]
3,4-Diiodo-2,5-dimethylthiophene
Liliana Cseh, Georg H. Mehl, Stephen Clark and Stephen J. Archibald
3,4-diiodo-2,5-dimethylthiophene
Crystal data C6H6I2S Mr = 363.97
Monoclinic, P21/c Hall symbol: -P 2ybc a = 10.0141 (13) Å b = 6.7478 (6) Å c = 13.4597 (17) Å β = 98.156 (10)° V = 900.31 (18) Å3 Z = 4
F(000) = 656 Dx = 2.685 Mg m−3
Mo Kα radiation, λ = 0.71073 Å Cell parameters from 1487 reflections θ = 3.1–34.8°
µ = 7.14 mm−1 T = 150 K Block, colourless 0.49 × 0.45 × 0.35 mm
Data collection
Stoe IPDSII image plate diffractometer
Radiation source: fine-focus sealed tube Graphite monochromator
ω scans,125 frames at 1o intervals, exposure time 1 minute
Absorption correction: numerical (X-RED32; Stoe & Cie, 2002) Tmin = 0.073, Tmax = 0.145
7570 measured reflections 3171 independent reflections 2876 reflections with I > 2σ(I) Rint = 0.053
θmax = 32.5°, θmin = 3.1° h = −15→12
k = −10→8 l = −19→20
Refinement Refinement on F2 Least-squares matrix: full R[F2 > 2σ(F2)] = 0.037 wR(F2) = 0.094 S = 1.08 3171 reflections 85 parameters 0 restraints
Primary atom site location: structure-invariant direct methods
Secondary atom site location: difference Fourier map
Hydrogen site location: inferred from neighbouring sites
H-atom parameters constrained w = 1/[σ2(Fo2) + (0.0455P)2 + 2.0477P]
where P = (Fo2 + 2Fc2)/3 (Δ/σ)max = 0.041
Δρmax = 1.84 e Å−3 Δρmin = −1.56 e Å−3
Special details
Geometry. All e.s.d.'s (except the e.s.d. in the dihedral angle between two l.s. planes) are estimated using the full covariance matrix. The cell e.s.d.'s are taken into account individually in the estimation of e.s.d.'s in distances, angles and torsion angles; correlations between e.s.d.'s in cell parameters are only used when they are defined by crystal symmetry. An approximate (isotropic) treatment of cell e.s.d.'s is used for estimating e.s.d.'s involving l.s. planes.
Refinement. Refinement of F2 against ALL reflections. The weighted R-factor wR and goodness of fit S are based on F2, conventional R-factors R are based on F, with F set to zero for negative F2. The threshold expression of F2 > σ(F2) is used only for calculating R-factors(gt) etc. and is not relevant to the choice of reflections for refinement. R-factors based on F2 are statistically about twice as large as those based on F, and R- factors based on ALL data will be even larger.
Fractional atomic coordinates and isotropic or equivalent isotropic displacement parameters (Å2)
x y z Uiso*/Ueq
I1 0.95491 (2) 0.33976 (4) 0.148780 (18) 0.02573 (9)
I2 0.72610 (3) 0.78586 (4) 0.149067 (19) 0.02665 (9)
S1 0.65840 (10) 0.41677 (16) −0.13796 (7) 0.02577 (19)
C1 0.7839 (4) 0.3079 (6) −0.0553 (3) 0.0224 (6)
C2 0.8076 (3) 0.4170 (6) 0.0308 (3) 0.0208 (6)
C4 0.6355 (4) 0.6116 (6) −0.0584 (3) 0.0241 (6)
C3 0.7227 (4) 0.5899 (6) 0.0289 (3) 0.0223 (6)
C6 0.8507 (5) 0.1212 (7) −0.0829 (3) 0.0301 (8)
H2 0.9409 0.1521 −0.0989 0.036*
H3 0.7966 0.0609 −0.1415 0.036*
H1 0.8584 0.0284 −0.0264 0.036*
C5 0.5330 (4) 0.7677 (8) −0.0880 (4) 0.0336 (9)
H5 0.4744 0.7267 −0.1492 0.040*
H4 0.5783 0.8920 −0.1006 0.040*
H6 0.4785 0.7874 −0.0338 0.040*
Atomic displacement parameters (Å2)
U11 U22 U33 U12 U13 U23
I1 0.02439 (13) 0.02973 (15) 0.02117 (13) 0.00487 (8) −0.00335 (9) 0.00026 (8)
I2 0.02565 (13) 0.02720 (15) 0.02611 (14) 0.00265 (8) 0.00028 (9) −0.00559 (8)
S1 0.0258 (4) 0.0318 (5) 0.0183 (4) 0.0018 (3) −0.0021 (3) −0.0003 (3)
C1 0.0227 (15) 0.0244 (16) 0.0201 (15) 0.0015 (12) 0.0032 (12) 0.0020 (12)
C2 0.0191 (13) 0.0227 (16) 0.0201 (14) 0.0022 (11) 0.0011 (11) 0.0026 (11)
C4 0.0222 (14) 0.0266 (17) 0.0227 (16) 0.0025 (13) 0.0001 (12) 0.0009 (13)
C3 0.0200 (14) 0.0254 (17) 0.0205 (15) 0.0015 (12) −0.0003 (12) −0.0004 (12)
C6 0.0346 (19) 0.031 (2) 0.0253 (18) 0.0046 (16) 0.0065 (15) −0.0039 (15)
C5 0.0266 (18) 0.039 (2) 0.034 (2) 0.0124 (17) 0.0003 (16) 0.0070 (17)
supporting information
sup-3 Acta Cryst. (2007). E63, o1393–o1394
C1—C6 1.498 (6) C5—H4 0.9800
C2—C3 1.442 (5) C5—H6 0.9800
C4—C3 1.369 (5)
C1—S1—C4 94.18 (19) C1—C6—H2 109.5
C2—C1—C6 129.4 (4) C1—C6—H3 109.5
C2—C1—S1 110.0 (3) H2—C6—H3 109.5
C6—C1—S1 120.6 (3) C1—C6—H1 109.5
C1—C2—C3 113.0 (3) H2—C6—H1 109.5
C1—C2—I1 122.2 (3) H3—C6—H1 109.5
C3—C2—I1 124.8 (3) C4—C5—H5 109.5
C3—C4—C5 129.6 (4) C4—C5—H4 109.5
C3—C4—S1 109.0 (3) H5—C5—H4 109.5
C5—C4—S1 121.3 (3) C4—C5—H6 109.5
C4—C3—C2 113.8 (4) H5—C5—H6 109.5
C4—C3—I2 122.5 (3) H4—C5—H6 109.5
C2—C3—I2 123.7 (3)
C4—S1—C1—C2 0.1 (3) C5—C4—C3—C2 179.5 (4)
C4—S1—C1—C6 −179.4 (3) S1—C4—C3—C2 0.3 (4)
C6—C1—C2—C3 179.5 (4) C5—C4—C3—I2 1.4 (6)
S1—C1—C2—C3 0.0 (4) S1—C4—C3—I2 −177.81 (19)
C6—C1—C2—I1 0.9 (6) C1—C2—C3—C4 −0.2 (5)
S1—C1—C2—I1 −178.60 (18) I1—C2—C3—C4 178.4 (3)
C1—S1—C4—C3 −0.2 (3) C1—C2—C3—I2 177.9 (3)
![Figure 2The unit-cell contents of (I), viewed along [010] (50% probabilityellipsoids)](https://thumb-us.123doks.com/thumbv2/123dok_us/656139.567457/2.610.90.254.385.630/figure-the-unit-cell-contents-i-viewed-probabilityellipsoids.webp)
![Crystal structure of 5 iodo 2 methyl 3 [(4 methylphenyl)sulfonyl] 1 benzofuran](data:image/gif;base64,R0lGODlhAQABAIAAAP///wAAACH5BAEAAAAALAAAAAABAAEAAAICRAEAOw==)