1
Probability of fatigue failure in brick masonry under compressive loading
1
I.S. Koltsida
a,1, A.K. Tomor
a, C.A. Booth
b2
a University of the West of England, Bristol, Faculty of Environment and Technology, Division of Civil & 3
Environmental Engineering, Frenchay Campus, Coldharbour Lane, Bristol BS16 1QY, UK 4
b University of the West of England, Bristol, Faculty of Environment and Technology, Architecture and the Built 5
Environment, Frenchay Campus, Coldharbour Lane, Bristol BS16 1QY, UK 6
1 Corresponding author. Tel.: +44 (0) 1173283049. E-mail addresses: [email protected], 7
ABSTRACT
9
Long-term fatigue tests under compressive loading were performed on low-strength brick masonry prisms
10
under laboratory conditions. The number of loading cycles to failure were recorded and used to investigate
11
the suitability of the logarithmic normal distribution to describe fatigue test data and to develop a probability
12
based mathematical expression for the prediction of the fatigue life of masonry. The proposed model
13
incorporates the applied maximum stress level, stress range, number of loading cycles and probability of
14
survival. From the mathematical model a set of curves for stress level - cycles to failure - probability of
15
survival (S-N-P) were identified to allow the fatigue life of masonry to be predicted for any desired
16
confidence level. Upper limit, lower limit and mean curves were proposed. The prediction curves were
17
compared with the test data and proposed expressions from the literature and proved to be suitable to predict
18
the fatigue life of masonry. It is surmised that S-N-P curves provide a useful tool to help evaluate the
19
remaining service life of masonry arch bridges at different confidence levels, based on material properties.
20
The proposed mathematical model can be incorporated into existing assessment methodologies, such as
21
SMART to quantify the residual life of brick masonry arch bridges for failure modes associated with
22
compressive loading.
23
Keywords: Brick Masonry, Fatigue, S-N curve, Probability
2
1.
Introduction
25
Understanding and predicting the effect of fatigue
26
for masonry is imperative for the preservation and
27
maintenance of masonry arch bridges. Masonry
28
arch bridges represent a significant part of the
29
European railway and highway system. The
30
increased weight, speed and density of traffic
31
impose higher levels of fatigue loading on the
32
structure and can lead to premature deterioration
33
[1, 2, 3, 4, 5].
34
Models to predict the fatigue life of masonry have
35
been proposed in the form of S-N (Stress-Number
36
of cycles) curves [1, 2, 4]. The models were
37
developed based on a limited number of
38
experimental test data and no guidance has been
39
available to apply them for different types of
40
masonry.
41
Roberts et al., [1] defined a lower bound fatigue
42
strength curve for dry, submerged and wet brick
43
masonry based on a series of quasi-static and
44
high-cycle fatigue tests on brick masonry prisms
45
(Equation 1). This equation relates the number of
46
loading cycles with the maximum applied stress,
47
the compressive strength and the stress amplitude.
48
(1)
Where F(S) is the function of the induced stress,
49
σ is the stress range, σmax is the maximum stress, 50
fc is the quasi-static compressive strength of 51
masonry and N is the number of load cycles. After
52
reprocessing the test data, Wang et al., [5]
53
suggested that Equation 1 is not a true lower
54
bound and reflects a combination of different
55
factors influencing the fatigue behaviour of
56
masonry.
57
Casas [2, 6] post-processed and analysed the
58
experimental data of Roberts et al., [1]. Assuming
59
the two parameter Weibull distribution for the
60
fatigue life of masonry under a given stress level,
61
Casas [2] proposed a probability-based fatigue
62
model for brick masonry under compression for a
63
range of confidence levels (Equation 2).
64
(2)
Where Smax is the ratio of the maximum loading 65
stress to the quasi-static compressive strength
66
(Smax = σmax/fc), N is the number of cycles to 67
failure and R is the ratio of the minimum stress to
68
the maximum stress (R = σmin/σmax). Coefficients 69
A and B are given in Table 1 for different values
3 of the survival probability L as reported by Casas
71
[2].
72
Table 1 Parameters for Casas [2] fatigue equation for 73
different survival probabilities 74
L 0.95 0.90 0.80 070 0.60 0.50
A 1.106 1.303 1.458 1.494 1.487 1.464
B 0.0998 0.1109 0.1095 0.1023 0.0945 0.0874 75
During analysis of the test data, Casas [2] ignored
76
the values for two maximum stress levels (Smax = 77
0.65 and Smax = 0.6) and for high values of 78
survival probability, the values of regression
79
coefficient are quite low, suggesting that the
80
correlations are not very good [5]. Based on Casas
81
[2], and on the review performed by Wang et al.,
82
[5], it is suggested that the suitability of the
83
Weibull distribution to describe fatigue needs to
84
be further investigated, due to the fact that the
85
correlations are not very good (low) and because
86
the number of samples that was used was limited.
87
Finally, Tomor and Verstrynge [4] developed a
88
joined fatigue-creep deterioration model. A
89
probabilistic fatigue model was suggested by
90
adapting the model proposed by Casas [2, 6]. A
91
correction factor C was introduced to allow
92
interaction between creep and fatigue phenomena
93
to be taken into account and to adjust the slope of
94
the S-N curve (Equation 3).
95
(3)
Where Smax is the ratio of the maximum stress to 96
the average compressive strength, N the number
97
of cycles, R the ratio of the minimum stress to the
98
maximum stress, parameter A was set to 1,
99
parameter B was set to 0.04 and C is the
100
correction factor. This model also includes
quasi-101
static tests and was intended to represent the mean
102
fatigue life of masonry. The correction factor C,
103
however, depends on the set of experimental data
104
and the equation may not be used as a prediction
105
model.
106
The aim of this research is to investigate the
107
suitability of the logarithmic normal distribution
108
to describe fatigue test data and to propose a
109
model for S-N curves to predict the fatigue life of
110
masonry at any required confidence level. A
111
family of S-N curves are generated with mean,
112
lower limit and upper limit for the fatigue life.
113
4
2.
Materials and experimental test data
115
A total of 64 brick masonry prisms have been
116
tested to failure under compressive fatigue loading
117
at various maximum stress levels to investigate
118
the fatigue life of masonry in relation to the stress
119
level. Stack-bond brick masonry prisms were built
120
from full-size bricks and mortar joints according
121
to ASTM standards [7]. The total dimensions of
122
the prisms were 210 x 100 x 357 mm3 (five
123
handmade solid bricks and four 8 mm mortar
124
joints). The tests were performed using a 250 kN
125
capacity servo-controlled hydraulic actuator to
126
apply static or long-term fatigue loading. The
127
detailed experimental design and results are
128
presented in [8].
129
The handmade low-strength solid 210 x 100 x 65
130
mm3 Michelmersh bricks (denoted B1) have an
131
average compressive strength of 4.86 N/mm2 and
132
1823 kg/m3 gross dry density. The mortar, denoted
133
M01, was 0: 1: 2 cement: lime (NHL3.5): sand (3
134
mm sharp washed) mix by volume. The mean
135
compressive strength of masonry was 2.94 N/mm2
136
(0.10 N/mm2 Standard Deviation).
137
Tests under compressive long-term fatigue loading
138
were conducted at 2 Hz frequency with sinusoidal
139
load configuration. Before commencing the
140
fatigue tests, load was applied quasi-statically up
141
to the mean fatigue load. The load was
142
subsequently cycled between a minimum and a
143
maximum stress level defined as percentages of
144
the mean compressive strength of masonry
145
recorded under quasi-static loading [9]. The
146
minimum stress level represents the dead load of
147
the structure and was set to 10% of the
148
compressive strength of masonry (mean strength
149
of quasi-static tests) as the worst-case scenario for
150
fatigue loading [3, 8]. The maximum stress level
151
represents live loading (e.g. similar to traffic on a
152
bridge) and varied between 55% and 80% of the
153
compressive strength of masonry. The number of
154
load cycles until failure is shown in Table 2 for all
155
prisms (prisms are denoted as B1M01 according
156
to brick and mortar type). Prisms failed between 7
157
and 3.5x10⁶ loading cycles. The experimental test
158
data, including a specimen (B1M01-45) that did
159
not fail up to 107 loading cycles, were used to
160
develop the probabilistic model,.
161
The fatigue data presented in Table 2 exhibit large
162
scatter. The phenomenon of scatter for fatigue test
163
data under the same loading conditions is well
164
known and attributed to differences in the
5 microstructure for different specimens [10].
166
Potential sources of scatter could be the specimen
167
production and surface quality, accuracy of testing
168
equipment, laboratory environment and skill of
169
laboratory technicians [11]. Scatter is generally
170
larger for low stress amplitudes [11]. For the
171
presented test data, large scatter is also observed
172
for 80% maximum applied stress. This, however,
173
is due to the small number of tests performed at
174
this stress level. Similar scatter of the fatigue data
175
in terms of magnitude is observed in the test data
176
by Clark [12] and Tomor et al., [3].
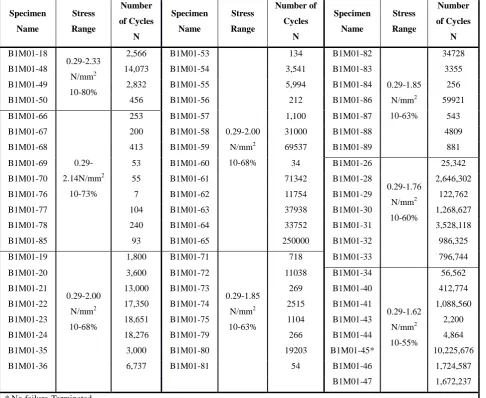
[image:5.595.58.545.274.672.2]177
Table 2 Fatigue tests in compression on B1M01 type prisms. 178 Specimen Name Stress Range Number of Cycles N Specimen Name Stress Range Number of Cycles N Specimen Name Stress Range Number of Cycles N B1M01-18 0.29-2.33 N/mm2 10-80%
2,566 B1M01-53
0.29-2.00 N/mm2 10-68%
134 B1M01-82
0.29-1.85 N/mm2 10-63%
34728
B1M01-48 14,073 B1M01-54 3,541 B1M01-83 3355
B1M01-49 2,832 B1M01-55 5,994 B1M01-84 256
B1M01-50 456 B1M01-56 212 B1M01-86 59921
B1M01-66
0.29-2.14N/mm2
10-73%
253 B1M01-57 1,100 B1M01-87 543
B1M01-67 200 B1M01-58 31000 B1M01-88 4809
B1M01-68 413 B1M01-59 69537 B1M01-89 881
B1M01-69 53 B1M01-60 34 B1M01-26
0.29-1.76 N/mm2 10-60%
25,342
B1M01-70 55 B1M01-61 71342 B1M01-28 2,646,302
B1M01-76 7 B1M01-62 11754 B1M01-29 122,762
B1M01-77 104 B1M01-63 37938 B1M01-30 1,268,627
B1M01-78 240 B1M01-64 33752 B1M01-31 3,528,118
B1M01-85 93 B1M01-65 250000 B1M01-32 986,325
B1M01-19
0.29-2.00 N/mm2 10-68%
1,800 B1M01-71
0.29-1.85 N/mm2 10-63%
718 B1M01-33 796,744
B1M01-20 3,600 B1M01-72 11038 B1M01-34
0.29-1.62 N/mm2 10-55%
56,562
B1M01-21 13,000 B1M01-73 269 B1M01-40 412,774
B1M01-22 17,350 B1M01-74 2515 B1M01-41 1,088,560
B1M01-23 18,651 B1M01-75 1104 B1M01-43 2,200
B1M01-24 18,276 B1M01-79 266 B1M01-44 4,864
B1M01-35 3,000 B1M01-80 19203 B1M01-45* 10,225,676
B1M01-36 6,737 B1M01-81 54 B1M01-46 1,724,587
B1M01-47 1,672,237
6
3.
Probabilistic model
179
Fatigue test data are normally presented as stress -
180
number of cycles (S-N) curves. Due to the
181
relatively large variation and statistical nature of
182
the test data, results may be more conveniently
183
presented in a three-dimensional format using
184
stress- number of cycles- probability of failure or
185
probability of survival (S-N-P) curves. The S-N-P
186
relationship indicates curves for the lower bound,
187
upper bound and the mean of the data points.
188
Logarithmic normal distribution has been used by
189
several researchers to indicate the fatigue life of
190
metals and concrete [12, 13, 14, 15, 16] at
191
constant stress amplitude. To identify the
192
suitability of logarithmic normal distribution to
193
describe the fatigue data for masonry, the
194
probabilities of failure for each stress level were
195
calculated. Equation 4 gives the probability
196
density function (PDF) of the fatigue life for the
197
logarithmic normal distribution [16].
198
(4)
Where N is the number of loading cycles to 199
failure, σ is the standard deviation and μ is the 200
mean of logN. The cumulative density function 201
(CDF) can be obtained by integrating the 202
probability density function (Equation 5). 203
(5)
The probability of failure Pf can be calculated as a 204
function of fatigue life by ranking the fatigue lives
205
at each load level from low to high and by
206
dividing the order of corresponding fatigue life by
207
n+1, where n is the total specimen number for
208
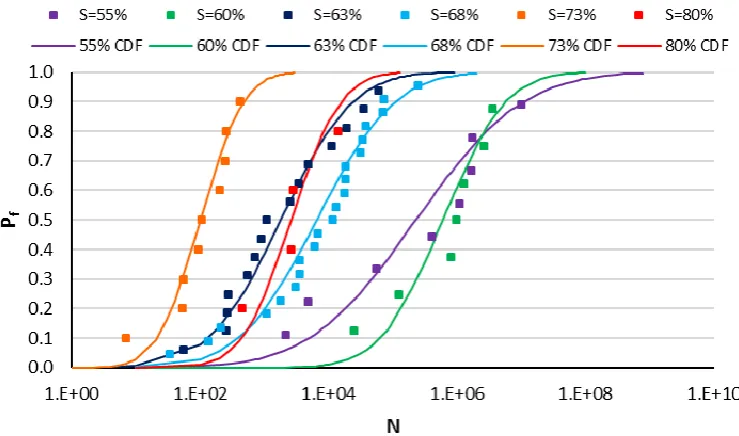
each loading level. In Figure 1 the calculated
209
probabilities of failure at every stress level are
210
plotted against the number of loading cycles to
211
failure (N) in a semi-logarithmic scale (N-P plot),
212
together with the cumulative density function
213
curves. The CDF curves were extrapolated to
214
cover the whole probability range. The curves
215
provide a good approximation of the fatigue test
216
data and suggest a logarithmic normal distribution
217
is suitable for describing the probability of failure.
7
[image:7.595.112.482.85.303.2]219
Figure 1 Variation of failure probability with the loading cycles for different stress levels 220
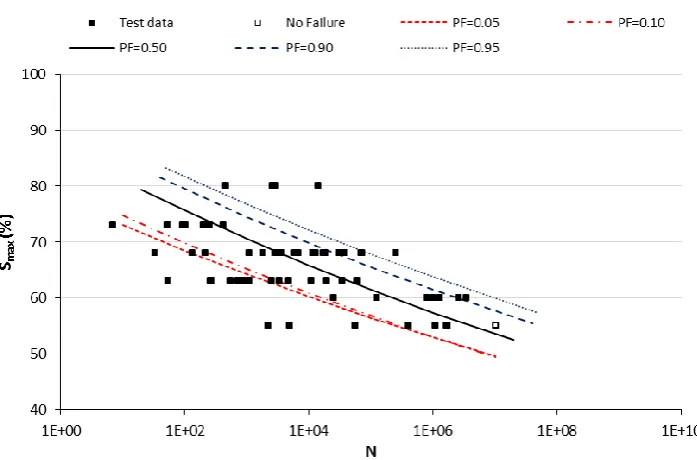
The fatigue lives corresponding to various
221
probabilities of failure at each stress level can be
222
calculated from the N-P plot in Figure 1 to
223
generate the S-N-P curves. S-N-P curves are
224
shown in Figure 2 for 0.05, 0.1, 0.5, 0.9 and 0.95
225
probabilities of failure. The S-N curves were
226
identified based on a power law best fit according
227
to Equation 6.
228
(6)
Where Smax is the ratio of the maximum loading 229
stress to the quasi - static compressive strength
230
(Smax = σmax/fc) and N is the number of cycles to 231
failure. A and B are parameters depending on the
232
probability of failure (Table 3).
233
Table 3 Parameters A and B for different probabilities of 234
failure 235
(Pf)
Parameter
0.05 0.10 0.50 0.90 0.95
A 0.779 0.802 0.868 0.905 0.925
B 0.028 0.030 0.030 0.028 0.027 236
Even though the 50% failure probability curve
237
provides a good approximation of the mean test
238
data, the 5% and 10% failure probability curves
239
do not represent reliable lower bounds. This could
240
be due to the fact that only a few specimens were
241
tested at 80% maximum stress and results
242
indicated greater fatigue lives than for 73% stress
243
level. Additionally, extrapolation of the
244
distributions to low probabilities resulted in
245
intersection of the cumulative density function
8 curves. This intersection produced the anomaly
247
that below a certain probability, specimens tested
248
at lower stress levels have shorter fatigue lives.
249
More test data are required for high stress levels
250
to develop more accurate relationships for lower
251
bound S-N curves.
252
253
254
[image:8.595.117.466.209.439.2]255
Figure 2 Experimental data and predicted S-N curves for different probabilities of failure 256
McCall [13] used a logarithmic mathematical
257
model to describe the S-N-P relationship for
258
fatigue of plain concrete under reverse bending
259
loading (Equation 7).
260
(7) where L is the probability of survival, a, b and c
261
are experimental constants, Smax is the ratio of the 262
maximum applied stress over the quasi-static
263
compressive strength, N is the number of cycles
264
for fatigue failure. The probability of survival L is
265
equal to 1-Pf (Pf is the probability of failure) and 266
is used instead of the probability of failure to
267
simplify the equation. In Equation 7 the following
268
limits are valid:
269
L = 1 for N = 1
270
L → 0 for N → ∞
271
L = 1 for Smax = 0 272
L → 0 for Smax → 1 273
To investigate the suitability of this model to
274
describe the behaviour of masonry under fatigue
9 compressive loading, parameters a, b and c have to
276
be calculated based on available experimental data.
277
To account for different stress ranges ΔS, as well
278
as for the maximum stress level, the term SmaxΔS 279
will be used, instead of Smax. Equation 7 can, 280
therefore, be transformed to Equation 8.
281
(8) Where L is the probability of survival, Smax is the 282
ratio of the maximum applied stress over the
quasi-283
static compressive strength, ΔS is the stress range
284
and N is the number of cycles for fatigue failure.
285
To transform Equation 8 into a linear form, the
286
logarithms of the logarithms of each side of the
287
equation were taken.
288
(9)
By substituting log(-logL) by Y, loga by A,
289
log(SmaxΔS) by X and log(logN) by Z the 290
following linear form is obtained:
291
(10) or
292
(11) where , and .
293
In order to work with the variables measured from
294
the samples, the following equation was derived
295
from Equation 11.
296
(12) By subtracting Equation 12 from Equation 11, the
297
subsequent expressions are attained:
298
or
299
(13)
where , , and are the average values of X, Y
300
and Z respectively and in Equation 13, ,
301
and .
302
Using least square normal equations, expressions
303
(14) and (15) are obtained:
304
(14) (15) Analysing the experimental fatigue data based on
305
this set of equations, the required statistical terms
306
were calculated.
10
Substitution of these statistical terms in Equations
308
14 and 15 allows the calculation of parameters
309
and . Equation 13, using the calculated and
310
parameters will become, therefore:
311
Parameter can now be calculated by
312
substitution of and , as well as, , and in
313
Equation 12. Equation 11 is now expressed as:
314
Finally, after having computed all the required
315
parameters, Equation 8 may be rewritten for
316
masonry under compressive fatigue loading in the
317
following form (Equation 16):
318
(16) Equation 16 can be used to evaluate the S-N
319
curves for masonry under compressive cyclic
320
loading for any preferred confidence level of
321
survival. It can also be used to evaluate the mean,
322
upper limit and lower limit fatigue life of masonry.
323
324
4.
Application
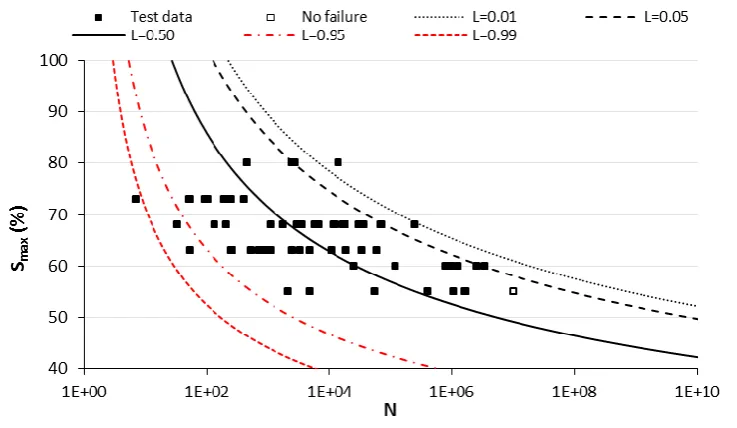
325
In Figure 3, the S-N-P curves for 99%, 95%, 50%,
326
5% and 1% probabilities of survival are indicated
327
for the experimental fatigue data under study. The
328
curve for 0.50 probability is a reliable estimate of
329
the mean cycles to failure for each stress level and
330
curves for 0.01 and 0.99 probability are good
331
upper and lower limits as well. The 0.05 and 0.95
332
probability curves could also be used for upper and
333
lower limits if a less conservative solution is
334
desired.
11
[image:11.595.114.483.83.297.2]336
Figure 3 S-N-P curves for masonry under compressive fatigue loading at 2Hz, 10% Smin and various Smax levels 337
To establish the suitability of the proposed model
338
to describe masonry under fatigue compressive
339
loading for various masonry types and loading
340
conditions, fatigue data were collected and
341
analysed from the literature. Figure 4 presents the
342
experimental data by Clark [17] on brick masonry
343
prisms under fatigue loading. Dry and wet
344
masonry prisms were loaded at 5 Hz frequency up
345
to 5 million cycles under 5% minimum stress.
346
Prisms that did not fail were subsequently tested
347
under quasi-static loading to failure. The S-N-P
348
curves proposed in Equation 16 are also included
349
in Figure 4. The proposed model seems to be a
350
reliable estimate for dry masonry prisms but is
351
less representative for saturated specimens that
352
fall under the 0.50 probability of survival curve.
353
Test data for saturated specimens should,
354
therefore, be analysed separately and a modified
355
equation should be proposed. The available
356
experimental data are, however, too limited to
357
perform statistical analyses and propose a
358
modified model. Additionally, the test data were
359
performed under different loading rates. The
360
effect of frequency has not been, however,
361
specifically studied for masonry [5] and
362
designated experimental data are required to
363
incorporate this effect within a mathematical
364
model.
12
[image:12.595.112.485.84.306.2]366
Figure 4 Experimental data by Clark [17] coupled with the proposed S-N-P curves. 367
Tomor et al., [3] tested a series of masonry prisms
368
under fatigue loading at 2 Hz frequency and 10%
369
minimum stress. Prisms tested under stress levels
370
lower than 58% did not fail and testing was
371
terminated. The test data are presented in Figure 5
372
together with the S-N-P curves. Disregarding the
373
prisms that did not fail under fatigue loading, the
374
0.50 probability curve is a reliable estimate of the
375
test data, while the 0.95 probability of survival
376
curve consists a lower limit. The 0.99 probability
377
curve may also be used as a more conservative
378
lower limit.
13
[image:13.595.113.484.84.303.2]380
Figure 5 Experimental data by Tomor et al., [3] coupled with the S-N-P curves. 381
Comparison of available experimental data with
382
the proposed prediction model indicates Equation
383
16 can be satisfactorily used to predict the fatigue
384
life of brick masonry under compressive loading
385
at any desired confidence level. In every case, the
386
curve corresponding to 0.50 probability of
387
survival indicated the mean fatigue life of dry
388
brick masonry. As a lower limit, the 0.95
389
probability curve can be considered as a good
390
representation, while the 0.99 curve offers a more
391
conservative solution. For the upper limit, the 0.01
392
probability curve generally provided a reliable
393
estimate. For wet and saturated masonry, further
394
experimental data are needed to develop
395
probability models.
396
The presented masonry prisms were tested under
397
slightly different minimum stress levels,
398
σmin/fc=5% by Clark [17] and σmin/fc=10% by 399
Tomor et al., [3], although the proposed S-N-P
400
model appears to be a good estimate for all test
401
data, regardless of the minimum stress level.
402
Further test data is needed for identifying the
403
effect of minimum stress on the probability of
404
survival.
405
Comparison of the proposed S-N-P model with
406
models presented in the literature is carried out
407
separately for the lower limit and mean fatigue
408
life.
409
For lower limit the current test results (Table 2)
410
and proposed model for 0.95 probability of
14 survival (Equation 16) are shown in Figure 6
412
together with proposed models by Casas [2] for
413
0.95 probability and Roberts et al., [1]. The linear
414
lower limit by Roberts does not seem to be a
415
satisfactory fit for the data, underestimating the
416
data in some regions and overestimating in other
417
regions. The model by Casas [2] displays a better
418
fit but does not provide a lower bound, especially
419
for maximum stress levels 60-80%. The proposed
420
prediction model in Equation 16 presents a
421
satisfactory fit, lower limit, as well as offers the
422
flexibility of identifying any suitable probability
423
of survival.
424
[image:14.595.109.487.259.483.2]425
Figure 6 Test data (Table 2) with lower limit from a) Equation 16 for Pf=0.95, b) Casas [2] for Pf=0.95 and c) Roberts et al., [1] 426
For prediction of the mean fatigue life the current
427
test results (Table 2) and proposed model for 0.5
428
probability of survival (Equation 16) are shown in
429
Figure 7 together with proposed models by Casas
430
[2] for 0.5 probability and Tomor & Verstrynge
431
[4]. The model by Casas [2] is notably
432
overestimating the fatigue life of masonry prisms
433
at any stress level. The model by Tomor &
434
Verstrynge [4] with correction factor C=-1.5
435
(identified to best fit current set of test data)
436
seems to provide a good estimate of the mean test
437
data but the curve does not follow the data points
438
very closely. The model cannot be considered as a
439
prediction model as parameter C depends on the
440
data set. The proposed prediction model in
441
Equation 16 presents a satisfactory fit of the mean
442
fatigue life, following the test data closely.
15
[image:15.595.113.485.93.297.2]444
Figure 7 Test data (Table 2) mean fatigue life from a) Equation 16, b) Casas [2] and c) Tomor & Verstrynge [4] 445
446
5.
Discussion
447
The prediction model by Casas [2] can provide
S-448
N curves for a limited set of survival probabilities
449
(between 0.50 and 0.95) but does not offer an
450
upper limit or flexibility of adjusting the
451
confidence level for best fit. The S-N curves by
452
Roberts et al., [1] and Tomor & Verstrynge [4] do
453
not account for confidence levels. Roberts et al.,
454
[1] offer a lower bound limit for the fatigue life of
455
masonry, while Tomor and Verstrynge [4] offer an
456
expression for the mean fatigue life. The proposed
457
model is currently the only model that allows the
458
S-N curves to be identified for masonry at any
459
confidence level.
460
For bridge management, information on the rate
461
of deterioration and remaining service life is
462
essential to optimise assessment and inspection
463
techniques and minimise the cost of maintenance.
464
S-N-P curves can provide a useful tool to help
465
evaluate the remaining service life of masonry
466
arch bridges at different confidence levels, based
467
on material properties and traffic load levels.
468
Optimising the weight, speed and frequency of
469
traffic could also help reduce deterioration and
470
extend the remaining service life, particularly in
471
older and weaker bridges.
472
The proposed mathematical model for the S-N
473
curves can also be fed into the SMART method
16 (Sustainable Masonry Arch Resistance Technique)
475
[18] for failure modes associated with
476
compressive loading (crushing). The SMART
477
method can be used, therefore, to quantify the
478
residual life of brick masonry arch bridges.
479
480
6.
Conclusions
481
A mathematical model is proposed to describe the
482
fatigue life of masonry using S-N-P curves, based
483
on the model used for concrete by McCall [13].
484
The model, given in Equation 16, takes the stress
485
range and maximum stress level into account and
486
allows the prediction of the fatigue life
487
expectancy of masonry to be defined for any
488
desired confidence level.
489
The proposed model is presented together with the
490
experimental test data [17, 3] and is compared
491
with models from the literature [1, 2, 4]. The
492
model provides a good estimate for the S-N-P
493
curves for dry masonry. The curve corresponding
494
to 0.50 probability of survival can be used to
495
predict the mean loading cycles to failure, while
496
curves corresponding to 0.95 or the 0.99
497
probabilities of survival can be used to predict
498
lower limits for any type of dry masonry. In
499
addition, the shape of the proposed curve seems to
500
fit the exponential configuration of the
501
experimental data. Further test data is needed to
502
adapt Equation 16 for wet or submerged masonry
503
specimens.
504
505
Acknowledgement
506
The work reported in this paper was supported by
507
the International Union of Railways (UIC). The
508
technical and financial support provided, is
509
gratefully acknowledged by the authors.
510
511
References
512
[1] T. Roberts, T. Hughes, V. Dandamudi and B. Bell, “Quasi-static and high cycle fatigue strength of brick masonry,” Construction and Building Materials, vol. 20, no. 9, pp. 603-614, 2006.
17 [3] A. Tomor, S. De Santis and J. Wang, “Fatigue
deterioration process of brick masonry,”
Journal of the International Masonry Society,
vol. 26, no. 2, pp. 41-48, 2013.
[4] A. Tomor and E. Verstrynge, “A joint fatigue–creep deterioration model for masonry with acoustic emission based damage assessment,” Construction and Building Materials, vol. 43, pp. 575-588, 2013.
[5] J. Wang, A. K. Tomor, C. Melbourne and S. Yousif, “Critical review of research on high-cycle fatigue behaviour of brick masonry,”
Construction and Building Materials, vol. 38, pp. 602-609, 2013.
[6] J. R. Casas, “Reliability-based assessment of masonry arch bridges,” Construction and Building Materials, vol. 25, no. 4, pp. 1621-1631, 2011.
[7] ASTM, “Standard test method for compressive strength of masonry prisms,” in
Annual Book of ASTM Standards, vol. 4.05, ASTM, Ed., West Conhohocken, ASTM
International, pp. 889-895, 2014.
[8] I. Koltsida, A. Tomor and C. Booth, “Experimental evaluation of changes in strain under compressive fatigue loading of brick masonry,” Construction and Building Materials, vol. 162, pp. 104-112, 2018.
[9] A. Medeiros, X. Zhang, G. Ruiz, R. Yu and M. De Souza Lima Velasco, “Effect of the loading frequency on the compressive fatigue behavior,” International Journal of Fatigue ,
vol. 70, p. 342–350, 2015.
[10] T. Xuesong, “Scatter of fatigue data owing to material microscopic effects,” Physics, Mechanics & Astronomy, vol. 57, no. 1, pp. 90-97, 2014.
[11] J. Schijve, Fatigue of Structures and Materials, 1st ed., London: Kluwer Academic, 2001.
18 [13] J. McCall, “Probability of fatigue failure of
plain concrete,” Journal of the American Concrete Institute, vol. 55, no. 8, pp. 233-244, 1958.
[14] A. Stagg, “An Investigation of the Scatter in Constant Amplitude Fatigue Test Results of Aluminium Alloys 2024 and 7075. Report number: ARC CP 1093,” Her Majesty's Stationary office, London, 1970.
[15] P. Forrest, Fatigue of metals, 2nd ed., London: Pergamon Press, 1970.
[16] M. Zhao, X. Fan, Q. Fang and T. Wang, “Experimental investigation of the fatigue of closed-cell aluminum alloy foam,” Materials Letters, vol. 160, no. 1, pp. 68-71, 2015.
[17] G. Clark, “Bridge analysis testing and cost causation project: serviceability of brick masonry,” British Rail Research Report LR CES 151, 1994.
[18] C. Melbourne, J. Wang and A. Tomor, “A new masonry arch bridge assessment strategy (SMART),” Journal of Bridge Engineering,
vol. 160, no. 2, pp. 81-87, 2007.
513
![Figure 4 Experimental data by Clark [17] coupled with the proposed S-N-P curves.](https://thumb-us.123doks.com/thumbv2/123dok_us/578834.557560/12.595.112.485.84.306/figure-experimental-data-clark-coupled-proposed-s-curves.webp)
![Figure 5 Experimental data by Tomor et al., [3] coupled with the S-N-P curves.](https://thumb-us.123doks.com/thumbv2/123dok_us/578834.557560/13.595.113.484.84.303/figure-experimental-data-tomor-et-al-coupled-curves.webp)
![Figure 6 Test data (Table 2) with lower limit from a) Equation 16 for Pf=0.95, b) Casas [2] for Pf=0.95 and c) Roberts et al., [1]](https://thumb-us.123doks.com/thumbv2/123dok_us/578834.557560/14.595.109.487.259.483/figure-test-table-lower-limit-equation-casas-roberts.webp)
![Figure 7 Test data (Table 2) mean fatigue life from a) Equation 16, b) Casas [2] and c) Tomor & Verstrynge [4]](https://thumb-us.123doks.com/thumbv2/123dok_us/578834.557560/15.595.113.485.93.297/figure-test-table-fatigue-equation-casas-tomor-verstrynge.webp)
