The circulatory system of vertebrates is primarily regulated by the autonomic nervous system, as well as by hormonal and local factors. The autonomic nervous system consists of a parasympathetic vagal inhibitory component and a sympathetic adrenergic excitatory component. The autonomic nervous system is of paramount importance for regulation of blood pressures, cardiac contractility and distribution of blood flows between various vascular beds (Nilsson, 1983; Morris and Nilsson, 1994). In turtles, the ventricle is undivided, and blood-flow distribution between the systemic and pulmonary circulations and the intracardiac shunt patterns are largely determined by the vascular resistances of these two circulations (e.g. Shelton and Burggren, 1976; Hicks et al., 1996). It is well established that cholinergic control of pulmonary vascular resistance exerts an important role in the distribution of blood flow (e.g. Johansen and Burggren, 1980; Hicks, 1998), but an adrenergic component also seems to be involved in the
regulation of vascular resistances of the pulmonary and systemic circulations (Burggren, 1977; Hicks, 1994). Increased sympathetic tone is often associated with exercise and stressful conditions, where oxygen delivery needs to be augmented through increased systemic blood flow through increased heart rate (fH) and/or stroke volume. A sympathetically mediated
reduction in the re-circulation of systemic venous blood within the systemic circulation (i.e. a reduced right-to-left shunt) will improve systemic oxygen transport through increased oxygen saturation of systemic arterial blood (Wang and Hicks, 1996b). Despite this benefit, a clear picture of the role of adrenergic stimulation in the regulation of pulmonary vascular resistance (Rpul) in turtles has yet to emerge because contradictory results
appear in the literature (Hicks, 1994); some studies show no effects of catecholamine injections, while others report reductions in Rpul(Luckhardt and Carlson, 1921; Berger, 1972;
Milsom et al., 1977; Burggren, 1977; Comeau and Hicks, 1994).
Printed in Great Britain © The Company of Biologists Limited 2002 JEB4283
Freshwater turtles, Trachemys scripta, like all non-crocodilian reptiles, are able to shunt blood between the pulmonary and systemic circulations owing to their undivided ventricle. The prevailing hypothesis is that the ratio of pulmonary and systemic resistances is the primary determinant of cardiac shunting in turtles. In the present study, we have examined the adrenergic influences on vascular resistances in the pulmonary and systemic circulations and the associated effects on cardiac shunts in turtles. To achieve this objective, systemic blood flow and pressures and pulmonary blood flow and pressures were measured simultaneously in anaesthetised turtles during
bolus injections of α- and β-adrenergic agonists and
antagonists. Total cardiac output, systemic vascular resistance, pulmonary vascular resistance, heart rate and cardiac stroke volume were derived from these measurements. Anaesthetised turtles showed cardiovascular characteristics that were similar to those
of non-apnoeic non-anaesthetised turtles, because
anaesthesia blocked the cholinergically mediated constriction of the pulmonary artery that is normally associated with apnoea. As a result, the anaesthetised
turtles exhibited a large net left-to-right shunt, and the adrenergic responses could be observed without
confounding changes resulting from apnoea. Potent α
-adrenergic vasoconstriction and weaker β-adrenergic
vasodilation were discovered in the systemic circulation.
Modest β-adrenergic vasodilation and possible weak α
-adrenergic vasodilation were discovered in the pulmonary circulation. This adrenergically mediated vasoactivity produced the largest range of cardiac shunts observed so far in turtles. Regression analysis revealed that 97% of the variability in the cardiac shunts could be accounted for by the ratio of the pulmonary and systemic resistances. Thus, we conclude that, independent of whether the pulmonary vascular resistance is modulated (as during apnoea) or the systemic resistance is modulated with adrenergic mechanisms (as shown here), the consequences on the cardiac shunt patterns are the same because they are determined primarily by the ratios of the pulmonary and systemic resistance.
Key words: turtle, Trachemys scripta, adrenergic response, cardiac shunting, cardiovascular, pulmonary resistance, systemic resistance. Summary
Introduction
Adrenergic control of the cardiovascular system in the turtle Trachemys scripta
Johannes Overgaard
1,*, Jonathan A. W. Stecyk
1,2, Anthony P. Farrell
2and Tobias Wang
11Department of Zoophysiology, Aarhus University, Building 131, 8000 Aarhus C, Denmark and
2Department of Biological Sciences, Simon Fraser University, Burnaby, British Columbia, V5A 1S6, Canada
*Author for correspondence (e-mail: [email protected])
While the overall haemodynamic effects of adrenergic stimulation have been characterised to some degree in turtles, it remains unknown as to what extent the changes in cardiac shunt pattern are caused by increased systemic resistance (Rsys) or decreased Rpul. Furthermore, the specific role of α-adrenergic and β-adrenergic receptors underlying the regulation in the pulmonary circulation is largely unknown. Non-anaesthetised turtles primarily regulate the ratio of the vascular resistances (Rpul/Rsys), and thereby cardiac shunt
pattern, through a cholinergically mediated constriction of the pulmonary circulation. However, owing to the lack of vagal tone in anaesthetised turtles, the present study allowed us to examine how the ratios of vascular resistances affects shunt patterns when the resistances are manipulated through adrenergic stimulus or blockade. We measured haemodynamic responses following bolus injections of norepinephrine and the specific α- and β-adrenergic agonists phenylephrine and isoproteronol. Furthermore, we investigated the effects of pharmacological blockade using the α-adrenergic antagonist phentolamine and the β-adrenergic antagonist propranolol. Here, we aim to characterise the adrenergic regulation of the cardiovascular system in turtles and its possible functional implications.
Materials and methods Experimental animals
Freshwater turtles Trachemys scripta (Gray) with a body mass ranging between 0.6 kg and 1.5 kg (mean ± S.D., 0.85±0.07 kg) were obtained from Lemberger Inc. (Oshkosh, WI, USA) and air-freighted to Aarhus University, where they were housed in a large fibreglass tank containing fresh water heated to 25±2°C and had free access to dry platforms, allowing for behavioural thermoregulation. All procedures were in accordance with the laws of animal care and experimentation in Denmark.
Anaesthesia and surgery
Turtles were anaesthetised by an intramuscular injection of sodium pentobarbital (Nembumal, Sygehusapotekerne, Denmark; 50 mg kg–1) and normally ceased to exhibit
responses to pinching of the legs or tail within 60 min. The trachea was then exposed by a ventral incision in the neck, and the turtle was tracheotomised for artificial ventilation. During surgery and the entire experimental protocol, turtles were maintained ventral side up and received continuous artificial ventilation with a tidal volume of 20–30 ml kg–1at a frequency
of 20–30 breaths min–1 using an HI 665 Harvard Apparatus
Respirator (Cambridge, MA, USA). Because of the high ventilation rate, we used a gas mixture of 97% room air and 3% CO2delivered by a Wösthoff gas-mixing pump (Bochum,
Germany) to mimic the arterial blood PCO2in vivo (e.g. Glass
et al., 1983; see Crossley et al., 1999 for arterial blood gas composition of anaesthetised turtles using a similar experimental design).
To access the central vascular blood vessels, a 5 cm ×5 cm
portion of the plastron was removed using a bone saw, and the pectoral muscles were gently loosened from the excised piece. A polyethylene catheter, containing heparinised saline, was occlusively inserted into the left carotid artery and advanced into the right aortic arch. The common pulmonary artery was non-occlusively cannulated using an intravenous catheter (Surflo, Terumo Medical Cooporation, Elkton, MD, USA) inserted upstream into the common pulmonary artery to within 0.5 cm of the heart. This required that the pericardium was opened by a 1 cm incision. After insertion, the intravenous catheter was connected to PE-60 tubing, which, in turn, was connected to a Baxter Edward disposable pressure transducer (model PX600, Irvine, CA, USA). The signals from the pressure transducers were amplified using an in-house-built preamplifier and were calibrated daily against a static column of water. For measurements of systemic and pulmonary blood flows, a 1–1.5 cm section of the left aortic arch (LAo) and the left pulmonary artery (LPA) were freed from connective tissue for placements of transit-time ultrasonic blood-flow probes (2R or 2S probes; Transonic System, Inc., NY, USA). To improve the signal, acoustical gel was infused between the blood vessel and flow probe. The flow probes were connected to a Transonic dual-channel blood-flow meter (T206) for measurements of instantaneous blood-flow rates. Signals from the pressure transducer and the blood-flow meter were recorded with a Biopac MP100 data acquisition system (Biopac Systems, Inc., Goleta, CA, USA) at a sampling frequency of 50 Hz.
Calculation of blood flows, net shunt, stroke volume and resistance to blood flow in the systemic and pulmonary
circulations
This study did not measure blood flow in all systemic and pulmonary arteries. Several studies on anaesthetised and non-anaesthetised freshwater turtles have shown that systemic blood flow (Q.sys) can be adequately estimated as 2.85Q
.
LAo
(Shelton and Burggren, 1976; Comeau and Hicks, 1994; Wang and Hicks, 1996a; this relationship also persists after injection of adrenergic antagonists and agonists in fully recovered turtles; J. A. W. Stecyk, J. Overgaard, A. P. Farrell and T. Wang, unpublished data). Likewise, pulmonary blood flow (Q.pul) can be calculated as 2Q
.
LPA under the assumption that
blood flow in the right pulmonary artery equals that in the left. fHwas calculated from the instantaneous blood-flow trace from the LAo. Total cardiac output (Q.tot) was calculated as Q.sys+Q
.
pul, and total stroke volume (Vstot; pulmonary +
systemic) was calculated as Q.totdivided by fH. Pulmonary and systemic resistances (Rpul and Rsys, respectively) were
calculated from mean blood pressure (P) and mean blood flow (Rpul=Ppul/Q
.
pul and Rsys=Psys/Q
.
sys) using the assumption that
central venous blood pressures are zero. This assumption may lead to a small overestimation of vascular resistances, as pointed out by Badeer and Hicks (1994).
Experimental protocol
injected with adrenergic receptor antagonists and agonists using the protocol described below. The injections were administered through the systemic catheter, which was subsequently flushed with saline. Although not studied in detail, injections of adrenergic agonists in the pulmonary artery yielded similar responses to those following systemic injections. The total volume injected never surpassed 2 ml, and control injections of 2 ml saline did not cause haemodynamic changes. Following injection of each drug, we recorded haemodynamic parameters at a maximal response. This usually occurred after 1–2 min with the agonists and after 30 min with the antagonists. After injections of agonists, the haemodynamic variables were allowed to return to baseline values before continuing the protocol. Following injection of antagonists, we waited for at least 30 min until a new steady-state was established.
The animals were randomly divided into two groups (body mass of 0.78±0.03 kg and 0.92±0.12 kg for group 1 and 2, respectively) and presented with the following pharmacological protocols (all chemicals were purchased from Sigma-Aldrich, Vallensbæk Strand, Denmark).
Group 1: norepinephrine 5µg kg–1, phenylephrine
5µg kg–1, propranolol 3 mg kg–1, norepinephrine 5µg kg–1,
phenylephrine 5µg kg–1, phentolamine 3 mg kg–1. Group 2:
these animals were exposed to the same protocol as group 1 with the exception that the injections of phentolamine and propranolol were reversed. In addition, eight of the twelve animals (four from each group) were injected with a lower dose of norepinephrine (1µg kg–1), and four animals (two
from each group) were injected with isoproteronol (1µg kg–1).
These injections were performed before administration of the first antagonist. After completion of the experimental protocol, all turtles were euthanized by a lethal injection of saturated KCl.
Data analysis and statistics
Recordings of blood flows and pressures were analysed using AcqKnowledge data analysis software (Biopac Systems, Inc., Goleta, CA, USA, version 3.7.0) where the mean values for fH, Q.LAo, Q
.
LPA, Psys, Ppul, Rsysand Rpulwere
determined over a 1–2 min period following each injection. Differences in control values between groups 1 and 2 were tested using a t-test. In each group, the results obtained following injections of agonists and antagonists were tested for significant differences from untreated baseline values using a one-way analysis of variance (ANOVA) for repeated measures. Significant differences among mean values were identified using a post hoc Student–Newman–Keuls (SNK) test. Effects of agonists (phenylephrine and norepinephrine) after injection of antagonists (propranolol or phentolamine) were compared with the baseline value that prevailed 30 min after injection of the antagonist. Similarly, the eight turtles that received two doses of norepinephrine were tested using a one-way ANOVA for repeated measures and a post hoc SNK test. A paired t-test was used to assess for significant differences from control values in the four animals injected
with isoproteronol. In all tests, a limit of P<0.05 was applied to identify significant differences. Owing to low N values for some comparisons, type 1 errors are possible, and lack of significant differences should be interpreted cautiously. The data are presented as means ±S.E.M. and normalised to a 1 kg turtle.
Results
The cardiovascular status for each of the two experimental groups during the control condition is shown in Table 1. fH, Ppuland Psyswere similar between the two groups. Although
blood flows seemed higher in group 1 compared with group 2, this difference was not significant. Similarly, there were no significant differences between the two groups in any of the other reported parameters, and the ratios of Q.pul/Q
.
sys and Rpul/Rsyswere very similar in both groups. In both groups, Q
.
pul
greatly exceeded Q.sys,Psyswas considerably higher than Ppul,
and Rsyswas approximately threefold greater than Rpul. Effect of norepinephrine
The temporal changes in heart rate, blood flows and pressures following injection of norepinephrine are illustrated in Fig. 1A, 2A for two turtles from each experimental group. The group data are presented in Table 1. Data from the eight turtles (four from each group) that received two doses of norepinephrine were pooled and are presented in Fig. 3. Both concentrations of norepinephrine had significant chronotropic and inotropic effects. Q.tot, Q
.
pul, fH and Vstot all increased
significantly following injection of 1µg kg–1 norepinephrine,
and fHalso increased further following injection of 5µg kg–1
norepinephrine (Fig. 3A). Q.sys was unchanged following
injection of 1µg kg–1 norepinephrine but decreased
significantly after injection of 5µg kg–1 norepinephrine.
Norepinephrine caused significant dose-dependent increases in Ppul and Psys but did not affect Rpul, while Rsys increased
significantly from baseline values following injection of 5µg kg–1norepinephrine (Fig. 3D).
Effect of α-adrenergic stimulation and blockade Injection of the α-agonist phenylephrine led to an increase in Q.tot, although the effect was only significant in group 2
(Table 1). The increase in Q.puland Q
.
totfollowing injection of
phenylephrine was slightly lower than that following norepinephrine, and this correlated with the lack of a chronotropic effect of phenylephrine, but there were similar increases in Vstot after injection of either phenylephrine
or norepinephrine (Table 1). As with norepinephrine, phenylephrine elicited a significant increase in Q.pul, while Rpul
was not affected. The change in Q.sysfollowing phenylephrine
was not statistically significant, although Rsysalmost doubled
(Table 1; Figs 1A, 2A).
Blockade of the α-receptors by phentolamine induced significant reductions in Rsys, Psys, Ppul and Q
.
pul without
altering fH, Q.sys and Rpul (Table 1). The pronounced α
phentolamine. Thus, when phenylephrine or norepinephrine were injected after phentolamine, there were no significant cardiovascular changes except for an increase in Psysand Q
.
tot
following phenylephrine.
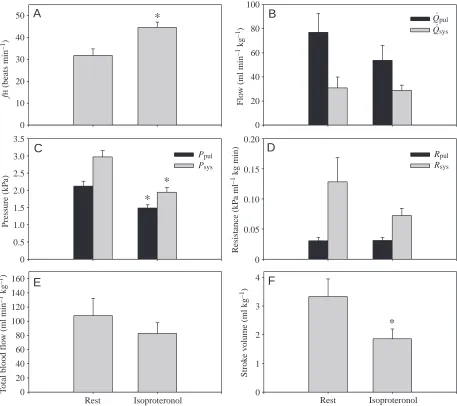
Effect of β-adrenergic stimulation and blockade The haemodynamic changes caused by β-adrenergic receptor stimulation using isoproteronol are presented in Fig. 4. Isoproteronol produced significant positive QLPA
(ml min
–1
)
.
Time (min)
0 10 20 30 40
f
H
(
b
eats
min
–1)
10 20 30 40 50
Psy
s
(
k
P
a)
Ppu
l
(
k
P
a)
0 1 2 3 4 5 6
0 1 2 3 4 5 6
0 5 10 15 20
0 20 40 60 80
Norepi 5 µg kg–1
Phenyl 5 µg kg–1
Prop 3 mg kg–1
Rest Nor
epi Ph
eny l
Pro p
Nor epi
Ph eny
l
Ph ent
0 10 20 30 40 50
R
es
ista
n
ce
(
k
P
a ml
–1 k
g
min)
0 0.1 0.2 0.3 0.4
0.5 Rpul
Rsys a
a
a
a a
b
b
A
B
C
QLA
o
(ml min
–1)
.
f
H
(
b
eats
min
–1)
Rest Nor
epi Ph
eny l
Pro p
Nor epi
Ph eny
l
Ph ent
Fig. 1. (A) Effects of adrenergic agonists and antagonists on haemodynamic variables in the turtle Trachemys scripta. Recordings from one individual (#15/group 1) of mean arterial blood pressures and mean blood flows in the pulmonary and systemic circuits, as well as heart rate (fH). Ppul and Psys are the arterial pressures in the pulmonary and systemic circulation, respectively. Q.LAois blood flow in the left aortic arch, and Q.LPA is the blood flow in the left pulmonary artery. The trace depicts resting conditions and measurements following injections of norepinephrine (norepi), phenylephrine (phenyl) and propranolol (prop).
(B) Heart rate and (C)
[image:4.612.53.542.68.679.2]chronotropic effects and significantly reduced Vstot, while there were no significant changes in Q.pul or Q
.
sys. Although there were no significant
changes in Rsys and Rpul, isoproteronol caused
significant hypotension in both the pulmonary and systemic circuits.
Abolishment of β-adrenergic tone, using propranolol, significantly reduced fHand Q.totbut
did not affect Vstot. A significant increase in Rpul
resulted in a decrease in Q.pul and no change
in Ppul. The changes in Rsys and Q
.
sys were
not statistically significant. Similarly, when propranolol was applied after phentolamine (group 2), fH decreased significantly, without any further change in Q.totand Q
.
pul(which had already
been reduced significantly by phentolamine). The increases in Rsys and Rpul following propranolol
injection did not reach statistical significance. Compared with norepinephrine injection before β -adrenergic blockade, norepinephrine injection following propranolol (group 1) caused an even larger increase in Rsys, while the systemic
hypertension was of similar magnitude. Phentolamine injection following β-adrenergic blockade (group 1) caused cardiac collapse, with Q.totdecreasing to 25% of the initial control values,
and systemic and pulmonary blood pressures decreasing to 50% of their initial control values (Table 1).
Discussion
The haemodynamic variables reported during the untreated control condition of our study are in general agreement with previous studies on anaesthetised Trachemys scripta (see table 3 in Crossley et al., 1998). Nevertheless, Q.pul in
group 1 of our study was somewhat higher, and fH
was slightly lower, than previous reports (Hicks et al., 1996; Hicks and Comeau, 1994; Comeau and Hicks, 1994; Crossley et al., 1998, 2000). As in previous studies on anaesthetised turtles, Q.pul
always exceeded Q.sys, resulting in a net
left-to-right cardiac shunt. Furthermore, our results clearly show that an increase in Rsys increased
this left-to-right shunt by increasing Q.pul, often
without compromising Q.sys.
Comparison of haemodynamic variables between anaesthetised and fully recovered animals We studied anaesthetised turtles to isolate the adrenergic control of the cardiovascular system without the confounding effects of the often-profound cardiovascular changes associated with ventilation in non-anaesthetised animals. The haemodynamic variables of anaesthetised turtles
T able 1. Car dio vascular par ameter
s following injections of adr
ener
gic a
gonist and anta
gonist in the turtle
T rachemys scripta f H Q . pul Q . sys Q . tot V stot Ppul Psys Rpul Rsys N (beats min −1) (ml kg –1 min –1 ) (ml kg –1 min –1 ) (ml kg –1 min –1) (ml kg –1) (kP a) (kP a) (kP a m l –1 kg min) (kP a m l –1 kg min) Q . pul /Q . sys Group 1 Control 6 35.8±2.7 74.1±13.8 33.9±5.4 107.9±16.9 3.1±0.5 2.29±0.18 3.23±0.26 0.04±0.01 0.12±0.03 2.38±0.41 Norepinephrine 6 43.5±2.2 a 124.6±18.7 a 25.1±2.3 149.7±19.6 a 3.5±0.5 3.93±0.26 a 5.27±0.24 a 0.04±0.01 0.22±0.02 a 5.05±0.83 a Phen ylephrine 6 36.6±2.6 107.7±16.6 a 22.7±2.0 130.5±16.5 3.7±0.6 3.06±0.17 a 4.49±0.21 a 0.03±0.01 0.21±0.02 a 4.94±0.86 a Propanolol 6 23.0±1.8 a 40.5±11.6 a 23.8±5.4 64.3±10.6 a 2.9±0.6 2.09±0.26 3.07±0.32 0.09±0.03 a 0.16±0.04 2.14±0.73 Norepinephrine 6 28.7±2.1 b 64.3±12.7 15.6±3.6 80.0±12.3 2.9±0.6 3.52±0.28 b 4.60±0.26 b 0.08±0.02 0.40±0.11 b 5.60±1.49 b Phen ylephrine 6 25.1±1.6 52.0±10.9 20.3±3.3 72.3±12.2 2.9±0.6 2.82±0.38 3.73±0.42 0.09±0.04 0.22±0.05 2.84±0.52 Phentolamine 6 20.0±1.6 11.6±1.8 b 14.9±2.8 26.5±3.7 b 1.3±0.1 b 1.22±0.28 b 1.38±0.32 b 0.12±0.04 0.11±0.02 1.00±0.32 Group 2 Control 6 35.4±3.4 46.6±8.0 22.0±2.8 68.7±9.1 2.0±0.3 2.26±0.21 3.13±0.26 0.05±0.01 0.16±0.03 2.30±0.43 Norepinephrine 6 42.8±2.4 a 102.3±15.1 a 16.0±2.3 118.3±13.6 a 2.9±0.4 a 4.43±0.49 a 5.82±0.58 a 0.05±0.01 0.41±0.08 a 7.81±2.29 b Phen ylephrine 6 35.6±3.6 80.9±10.7 a 17.5±2.9 98.4±9.3 a 2.9±0.4 a 3.08±0.26 a 4.47±0.36 a 0.04±0.01 0.30±0.06 a 5.62±1.47 b Phentolamine 6 35.4±3.1 26.4±5.2 a 24.6±3.8 51.0±7.5 1.4±0.2 1.39±0.11 a 1.62±0.05 a 0.08±0.03 0.08±0.02 a 1.11±0.20 Norepinephrine 6 38.0±2.4 40.3±12.1 27.8±4.0 68.0±13.2 1.8±0.4 1.76±0.09 2.30±0.15 b 0.08±0.02 0.10±0.02 1.51±0.37 Phen ylephrine 5 36.3±3.4 47.4±14.2 32.4±5.6 79.7±18.4 b 2.3±0.6 1.77±0.14 2.32±0.13 b 0.05±0.02 0.09±0.02 1.20±0.33 Propanolol 6 23.0±3.0 b 23.3±7.2 26.8±7.8 50.1±14.0 2.1±0.6 1.64±0.17 2.35±0.21 b 0.13±0.05 0.16±0.07 0.98±0.22 V
alues are means ±
S . E . M .
Norepinephrine and phen
ylephrine, 5
µ
gk
g
–1
; propanolol and phentolamine, 3
mg k g –1. f H
, heart rate;
Q
. pul
, pulmonary bloodflo
w;
Q
. sys
, systemic bloodflo
w;
Q
. tot
, total bloodflo
w; V stot , strok e v olume; Ppul
, mean pulmonary blood pressure;
Psys
, mean systemic blood
pressure;
Rpul
, pulmonary resistance;
Rsys
, systemic resistance;
Q
. pul
/Q
. sys
; ratio of pulmonary and systemic blood flo
w
.
asignifies a significant dif
ference from the control and
bsignifies a significant dif
ference follo
wing injection of the first antagonist. Statistical significance is tak
en at the le
v
el of
P
10 20 30 40 50 0 1 2 3 4 5 6
0 1 2 3 4 5 6
0 5 10 15 20
0 20 40 60
0 10 20 30 40 50
0 0.1 0.2 0.3 0.4 0.5 a
a
a
b
A
C
B
Time (min)
0 10 20 30 40 50 60
f
H
(
b
ea
ts
min
–
1)
Psy
s
(
kP
a)
Ppul
(
kP
a)
Norepi
5 µg kg–1 5 Phenylµg kg–1
Phent 3 mg kg–1
Rest Nor
epi Ph
eny l
Phen t
Nor epi
Ph eny
l Pro
p
Rest Nor
epi Ph
eny l
Ph ent
Nor epi
Ph eny
l Pro
p
R
es
ist
an
ce (
kP
a m
l
–
1 k
g
min)
Rpul Rsys
f
H
(
b
ea
ts
min
–
1)
QL
P
A
(m
l min
–
1)
.
QLA
o
(m
l min
–
1)
.
Fig. 2. (A) Effects of adrenergic agonists and antagonists on haemodynamic variables in the turtle Trachemys scripta. Recordings from one individual (#11/group 2) of mean arterial blood pressures and mean blood flows in the pulmonary and systemic circuits, as well as heart rate (fH). Ppuland Psys are the arterial pressures in the pulmonary and systemic circulation, respectively. Q.LAo is blood flow in the left aortic arch, and Q.LPA is the blood flow in the left pulmonary artery. The trace depicts resting conditions and measurements following injections of norepinephrine (norepi), phenylephrine (phenyl) and phentolamine (phent). (B) Heart rate and (C) pulmonary and systemic resistances in group 2 turtles (N=6) following injection of agonists and antagonists. a indicates a significant
difference (P<0.05) compared with resting conditions, and b indicates significant
[image:6.612.55.561.61.703.2]differ markedly from that of non-anaesthetised and recovered animals. For example, during non-ventilatory periods, recovered animals are characterised by a low fH and a large right-to-left shunt, whereas lung ventilation produces increases in fH, Q.puland Q
.
pul/Q
.
sys(White and Ross, 1966; Shelton and
Burggren, 1976; West et al., 1992; White et al., 1989; Wang
and Hicks, 1996a). The low fHand Q.pulduring apnoea appear
to stem from a large vagal tone, as injection of atropine increases both fHand Q.puland abolishes their reduction during
breath holding (Berger, 1972; Burggren, 1975; Hicks and Wang, 1998; Hicks, 1998; Hicks and Farrell, 2000). Injection of a beta-blocker did not affect the changes in fHassociated Rest
Nor epi
1 µ g kg
–1
Nor epi
5µ g kg
–1
f
H
(b
ea
ts
m
in
–
1)
0 10 20 30 40 50
0 20 40 60 80 100 120 140 160
P
ress
u
re
(
k
P
a)
0 1 2 3 4 5 6 7
0 0.1 0.2 0.3 0.4 0.5
a a,b
a a
a
a,b
a,b
a a
a,b
A
C
D
B
0 20 40 60 80 100 120 140 160
S
tro
k
e
v
o
lu
m
e
(m
l
kg
–
1)
0 1 2 3 4 a
a
F
a aE
Res
ist
an
ce
(
k
P
a
m
l
–
1 kg
m
in
) Rpul
Rsys
Qpul.
Qsys.
F
lo
w
(
m
l
m
in
–
1 kg
–
1)
Rest
Nor epi
1 µ g kg
–1
Nor epi
5µ g kg
–1
Ppul Psys
Rest
Nor epi
1 µ g kg
–1
Nor epi
5µ g kg
–1
Rest
Nor epi
1 µ g kg
–1
Nor epi
5µ g kg
–1
T
o
ta
l
b
loo
d
f
lo
w
(
m
l
m
in
–
1 kg
–
1)
Rest
Nor epi
1 µ g kg
–1
Nor epi
5µ g kg
–1
Rest
Nor epi
1 µ g kg
–1
Nor epi
5µ g kg
[image:7.612.84.541.74.588.2]–1
Fig. 3. Effect of norepinephrine dose (1µg kg–1 or 5µg kg–1) on (A) heart rate (fH), (B) pulmonary (Q.pul) and systemic (Q.sys) blood flow, (C) pulmonary (Ppul) and systemic (Psys) pressure, (D) pulmonary (Rpul) and systemic (Rsys) resistance, (E) total blood flow (Q
.
with intermittent ventilation (Burggren, 1975), although nadolol reduced mid-apnoeic fH(Hicks and Farrell, 2000). It is unknown whether the decreased fH results from blocking the effects of circulating catecholamines or the adrenergic innervation of the heart. Hicks (1994) suggested that part of the increased Q.puland fHduring ventilation can be attributed to increased adrenergic tone. Indeed, in anaesthetised turtles, afferent stimulation of the vagus causes tachycardia and increased Q.pul, which is abolished by inhibiting adrenaline
release from nerve endings with bretylium (Comeau and Hicks, 1994). Hence, it seems that the reciprocal changes in fH and blood flows associated with breathing are predominantly caused by alterations in vagal tone, but that changes in adrenergic tone contribute to cardiac rhythm in non-anaesthetised turtles.
Blood flow and fHof anaesthetised turtles are higher than in non-anaesthetised, apnoeic turtles because vagal tone on the
heart and pulmonary artery is lost in anaesthetised and ventilated animals (Crossley et al., 1998). As a result, blood flow and fH in anaesthetised turtles are quantitatively more similar to those measured in non-anaesthetised turtles during ventilation, when vagal tone is reduced. Nevertheless, anaesthetised turtles maintain an adrenergic tone similar to recovered animals, as the 35% reduction in fHoccurring with propranolol injection in the present study (Table 1) agrees well with the 16–35% reduction in fHafter nadolol injection in non-anaesthetised turtles (Hicks and Farrell, 2000).
α- and β-adrenergic responses on the heart and vasculature This is the first study to simultaneously examine α- and β -adrenergic regulation of the heart as well as the pulmonary and systemic circulations in turtles. Previous studies have shown that systemic injection of catecholamines leads to an increased heart rate that can be blocked or greatly attenuated by injection
0 10 20 30 40 50
0 20 40 60 80 100
0 0.5 1.0 1.5 2.0 2.5 3.0 3.5
0 0.05 0.10 0.15 0.20
*
*
*
A
C
B
D
Rest Isoproteronol
0 20 40 60 80 100 120 140 160
0 1 2 3 4
*
F
E
f
H
(b
ea
ts
mi
n
–
1)
P
ress
u
re
(
kP
a)
S
tro
k
e
v
ol
u
m
e
(m
l
k
g
–
1)
Res
ist
an
ce
(
kP
a
m
l
–
1 k
g
mi
n
)
Rpul Rsys
Qpul.
Qsys.
F
lo
w
(
m
l
mi
n
–
1 k
g
–
1)
Ppul Psys
T
o
ta
l
b
loo
d
f
lo
w
(
m
l
mi
n
–
1 k
g
–
1)
[image:8.612.76.533.73.479.2]Rest Isoproteronol
Fig. 4. Effect of isoproteronol (1µg kg–1) on (A) heart rate (fH), (B) pulmonary (Q.pul) and systemic (Q.sys) blood flow, (C) pulmonary (Ppul) and systemic (Psys) pressure, (D) pulmonary (Rpul) and systemic (Rsys) resistance, (E) total blood flow (Q
.
of β-receptor antagonists (Burggren, 1975; Hicks and Farrell, 2000). In our study, propranolol caused a large reduction in fH
but did not completely abolish the chronotropic effect of norepinephrine (Fig. 1; Table 1). This is likely to result from competitive binding between propranolol and norepinephrine on the cardiac β-adrenergic receptors, as phentolamine and phenylephrine did not affect fH, whereas specific stimulation of β-adrenergic receptors using isoproteronol elicited marked tachycardia (Fig. 4). These observations are consistent with studies on isolated ventricular strips from Trachemys, where no chronotropic effects could be demonstrated following α -adrenergic stimulation (Van Harn et al., 1973).
In this study, we used bolus injections of adrenergic agonists and antagonists to evaluate the adrenergic regulation of the heart and vascular tones. This experimental design does not allow for a differentiation between the effects of circulating catecholamines relative to the effects of catecholamine release from nerve endings.
In our study, high doses of norepinephrine caused a marked increase in Rsys (Table 1). This response was mimicked by
phenylephrine and could be blocked by phentolamine, demonstrating that the systemic vascular constriction following norepinephrine injection is caused by α-adrenergic receptors (Table 1; Fig. 2). Phentolamine halved Rsys, pointing
to a substantial α-adrenergic tone on the systemic circulation in anaesthetised turtles (Table 1). This is also the case in fully recovered turtles, where phentolamine reduced Rsys from
0.08 kPa ml–1min kg to 0.06 kPa ml–1min kg (A. W. Stecyk, J.
Overgaard, T. Wang and A. P. Farrell, unpublished data). Thus, as in virtually all other vertebrates examined so far, stimulation of the α-adrenergic receptors in the
systemic vascular beds is associated with constriction (Nilsson, 1983). Conversely, stimulation of β -adrenergic receptors with isoproteronol was associated with relaxation of the systemic vascular beds (Fig. 4), and blockade of β-adrenergic receptors increased Rsys by a factor of 1.4 (Table 1; Fig. 1).
Similar changes have been observed in fully recovered turtles, where β-adrenergic blockade using nadolol led to a threefold increase in Rsys from
0.05 kPa ml–1min kg to 0.15 kPa ml–1min kg (Hicks
and Farrell, 2000).
Comeau and Hicks (1994) reported a small decrease in Rpul of anaesthetised turtles following
catecholamine injection, whereas other studies were unable to detect reductions in Rpul (Luckhardt and
Carlson, 1921; Berger, 1972; Milsom et al., 1977). In our study, both norepinephrine and phenylephrine elicited a small, statistically non-significant reduction in Rpul(Table 1; Fig. 1). A potentially minor dilatory
role for α-adrenergic receptors was further suggested by the increase in Rpul (albeit not statistically
significant) following phentolamine injection (Table 1). Thus, the pulmonary circulation is much less responsive to α-adrenergic stimulation than is the systemic circulation, where Rsys doubled after
injection of phenylephrine. Burggren (1977) earlier reported a 15–20% reduction in the resistance of the isolated distal pulmonary artery upon injection of epinephrine. In the lizard Trachydosaurus rugosus, stimulation of β-receptors dilates the pulmonary vasculature, while stimulation of α-receptors appears to cause a constriction (Berger, 1973). In the snake Elaphe obsoleta, there is also evidence for β-adrenergic relaxation of the pulmonary artery (Donald et al., 1990). The role of β-receptors in the pulmonary circulation is less clear in turtles. Thus, while propranolol caused a significant increase in Rpul, suggesting a tonically active β-adrenergic mediated
relaxation (Table 1; Fig. 1), injection of isoproteronol did not reduce Rpul (Fig. 4), perhaps because this vasoactive
mechanism was already fully activated.
Our study demonstrates marked differences in the vascular response to adrenergic stimulation between the pulmonary and systemic circulations. The pulmonary circulation is much less responsive to catecholamines, and α-adrenergic receptors could even mediate opposite changes in vascular tone. Other studies also show that vasoactivity in the systemic and pulmonary circulations of turtles differs in other respects. Thus, hypoxia causes vasodilation in the systemic circulation as opposed to vasoconstriction in the pulmonary circulation (Crossley et al., 1998). NO exerts a substantial role in maintaining systemic vascular tone but does not seem important in the pulmonary circulation (Crossley et al., 2000). Conversely, pulmonary resistance is under strong cholinergic control (Berger, 1972; Burggren, 1977; Milsom et al., 1977; Hicks and Comeau, 1994), whereas the cholinergic tone on the systemic circulation is either low or absent (Kirby and
0 1 2 3 4
0 1 2 3 4 5
0.01 0.1 1 10
0.01 0.1 1 10
r2=0.97
Rpul/Rsys
Qpul
/
.
Qsys
.
Rpul/Rsys
Qpul
/
.
Qsys
.
[image:9.612.281.568.445.654.2]Qpul. /Qsys=0,8146*Rpul/Rsys–0,9109 .
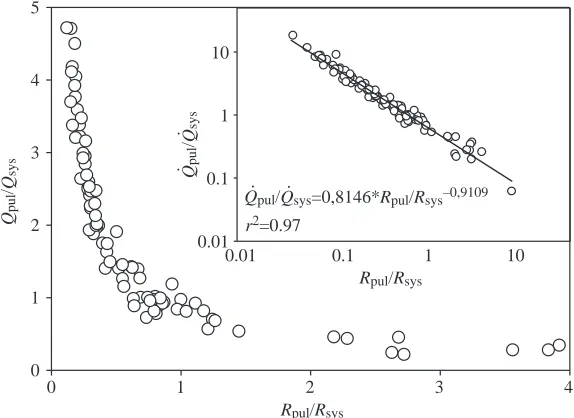
Fig. 5. Relationship between the ratio of vascular resistance (Rpul/Rsys) versus the ratio of blood flows (Q.pul/Q
.
sys) in the pulmonary and systemic circuits. The box insert shows the same data points on a double-log scale fitted to a power function. All data points are from individual measurements following the protocol of groups 1 and 2. For clarity, individual values with Q.pul/Q
Burnstock, 1969; Berger and Burnstock, 1979; Comeau and Hicks, 1994). Indeed, more studies are needed to better define the basis of these differences in vasoactivity.
The present study is revealing in terms of a potential role of venous venoconstriction on cardiac function. For example, despite the slight decrease in Q.sysand the marked increase in Rsyswith both phenylephrine and norepinephrine, there was an
increase in Q.totand Vstot. The increase in Vstotcould be a result
of an α-adrenergically mediated venoconstriction. Conversely, the apparent negative inotropic effect of isoproteronol on the heart (i.e. the decrease in Vstot) might be best explained by a β-adrenergically mediated venodilation reducing venous return to the heart. These venous effects of adrenergic stimulation need not be manifest in changes in overall vascular resistance but warrant further attention because of their potential effects on Vstotand Q
.
tot. Thus, although it seems that arterial vascular
resistances determine the relationship between pulmonary and systemic blood flows, it is likely that the magnitude of changes in total blood flow is determined, in part, by the degree of venous vasoactivity.
Functional implications of adrenergic regulation of cardiac shunts
Our study is the first to comprehensively evaluate effects on adrenergic stimulation on cardiac shunt patterns. Fig. 5 depicts the relationship between blood-flow distribution, expressed as Q.pul/Q
.
sys, and the ratio of the vascular resistances in the
pulmonary and systemic circulations (Rpul/Rsys). A similar
relationship illustrated that the distribution of blood flows between the systemic and pulmonary circuits in turtles correlates closely with the ratio of pulmonary and systemic vascular resistances (Hicks et al., 1996; Crossley et al., 1998). We were able to show that an even more profound range of cardiac shunting can be produced with adrenergic drug injections that act primarily on the systemic circulation. Consequently, anaesthetised turtles exhibit large net left-to-right shunts (Q.pul/Q
.
sys of >1) when Rpul is lower than Rsys
(Rpul/Rsys of <1), while a net right-to-left shunt (Q
.
pul/Q
.
sys of <1)
exists when Rpul is higher than Rsys (Rpul/Rsys of >1). This
relationship implies that systemic outflow resistance, regulated through α-adrenergic systemic vasoconstriction at the arterial level (as shown by the fourfold changes in Rsys between α-adrenergic stimulation and blockade), is the primary determinant of distribution of Q.totto the blood flows between
the two circuits in these anaesthetised turtles. In non-anaesthetised turtles, changes in the shunt pattern are effected primarily by cholinergically mediated constrictions of the pulmonary circulation. Thus, by focusing on adrenergic control, our work has provided evidence that modulation of the systemic vascular resistance produces the same types of cardiac shunts in turtles as does modulation of pulmonary resistance. Consequently, for turtles, it appears that up to 97% of the observed variability in the cardiac shunting (Fig. 5) can be explained by the ratio of the resistances in the two circulations.
It remains unanswered whether the profound changes in
cardiac shunting produced here by adrenergic mechanisms play a role in non-anaesthetised turtles. Increased adrenergic tone is often associated with exercise and stressful conditions such as hypoxia, where sympathetic stimulation safeguards systemic oxygen delivery through increased fH
and cardiac output. In addition, reduced cardiac right-to-left shunting through increased adrenergic tone and decreased vagal tone increases oxygen delivery (Wang and Hicks, 1996b, 2002). Our study is consistent with this view. However, because anaesthetised turtles have no vagal tone, adrenergic stimulation serves to increase the net left-to-right shunt rather than abolishing the net right-to-left shunt that would occur in vivo. Furthermore, the changes in shunt pattern are primarily accomplished through increased Rsys
and are associated with reductions in Q.sys. Therefore,
adrenergic stimulation of anaesthetised animals is unlikely to improve systemic oxygen delivery. It is probable, however, that oxygen delivery in fully recovered animals would benefit from increased sympathetic tone, as resting and undisturbed animals are characterised by net right-to-left shunts and low arterial oxygen levels (see tables 1, 2 in Wang and Hicks, 1996a).
This study was supported by the Danish Research Council and NSERC Canada.
References
Badeer, H. S. and Hicks, J. W. (1994). Pitfalls in the assessment of vascular
resistance. Cardiology 85, 23-27.
Berger, P. J. (1972). The vagal and sympathetic innervation of the isolated
pulmonary artery of a lizard and a tortoise. Comp. Gen. Pharmacol. 3, 113-124.
Berger, P. J. (1973). Autonomic innervation of the visceral and vascular
smooth muscle of the lizard lung. Comp. Gen. Pharmacol. 4, 1-10.
Berger, P. J. and Burnstock, G. (1979). Autonomic nervous system. In
Biology of the Reptilia, Neurology, vol. 10B (ed. C. Gans, R. G. Northcutt
and P. Ulinski), pp. 1-57. New York: Academic Press.
Burggren, W. W. (1975). A quantitative analysis of ventilation tachycardia
and its control in two chelonians, Pseudemys scripta and Testudo graeca.
J. Exp. Biol. 63, 367-380.
Burggren, W. W. (1977). The pulmonary circulation of the chelonian reptile:
morphology, haemodynamics and pharmacology. J. Comp. Physiol. 116, 303-323.
Comeau, S. and Hicks, J. W. (1994). Regulation of central vascular blood
flow in the turtle. Am. J. Physiol. 267, R569-R578.
Crossley, D., Altimiras, J. and Wang, T. (1998). Hypoxia elicits an increase
in pulmonary vasculature resistance in anaesthetised turtles (Trachemys
scripta). J. Exp. Biol. 201, 3367-3375.
Crossley, D. A., Wang, T. and Altimiras, J. (2000). Role of nitric oxide in
the systemic and pulmonary circulation of anesthetized turtles (Trachemys
scripta). J. Exp. Zool. 286, 683-689.
Donald, J. A., O’Shea, J. E. and Lillywhite, H. B. (1990). Neural regulation
of the pulmonary vasculature in a semi-arboreal snake, Elaphe absolata. J.
Comp. Physiol. B 169, 677-685.
Glass, M. L., Boutilier, R. G. and Heisler, N. (1983). Ventilatory control of
arterial PO2in the turtle Chrysemys picta bellii: effects of temperature and
hypoxia. J. Comp. Physiol. B 151, 145-153.
Hicks, J. W. (1994). Adrenergic and cholinergic regulation of intracardiac
shunting. Physiol. Zool. 67, 1325-1346.
Hicks, J. W. (1998). Cardiac shunting in reptiles: mechanisms, regulation and
physiological functions. In Biology of Reptilia, Morphology G, Visceral
Organs (ed. C. Gans and A. S. Gaunt), pp. 425-483. Ithaca: SSAR Press.
Hicks, J. W. and Comeau, S. G. (1994). Vagal regulation of intracardiac
shunting in turtles. J. Exp. Biol. 186, 109-126.
red-eared slider (Trachemys scripta) acclimated to either 22 or 5°C. II. Effects of anoxia on adrenergic and cholinergic control. J. Exp. Biol. 203, 3775-3784.
Hicks, J. W., Ishimatsu, A., Molloi, S., Erskin, A. and Heisler, N. (1996).
The mechanism of cardiac shunting in reptiles: a new synthesis. J. Exp. Biol.
199, 1435-1446.
Hicks, J. W. and Wang, T. (1998). Cardiovascular regulation during anoxia
in the turtle: an in vivo study. Physiol. Zool. 71, 1-14.
Johansen, K. and Burggren, W. W. (1980). Cardiovascular function in the
lower vertebrates. In Hearts and Heart-Like Organs, vol. 1 (ed. G. H. Bourne), pp. 61-117. New York: Academic Press.
Kirby, S. and Burnstock, G. (1969). Comparative pharmacological studies
of isolated spiral strips of large arteries from lower vertebrates. Comp.
Biochem. Physiol. 28, 307-319.
Luckhardt, A. B. and Carlson, A. J. (1921). Studies on the visceral sensory
nervous system VIII. On the presence of vasomotor fibers in the vagus nerve to the pulmonary vessels of the amphibian and the reptilian lung. Am. J.
Physiol. 56, 72-112.
Milsom, W. K., Langille, B. L. and Jones, D. R. (1977). Vagal control of
pulmonary vascular resistance in the turtle Chrysemys scripta. Can. J. Zool.
55, 359-367.
Morris, J. L. and Nilsson, S. (1994). The circulatory system. In Comparative
Physiology and Evolution of the Autonomic Nervous System (ed. S. Nilsson
and S. Homgren), pp. 193-246. Chur: Harwood Academic Publishers.
Nilsson, S. (1983). Autonomic Nerve Function in the Verebrates. New York:
Springer Verlag.
Shelton, G. and Burggren, W. W. (1976). Cardiovascular dynamics of the
Chelonia during apnoea and lung ventilation. J. Exp. Biol. 64, 323-343.
Van Harn, G. L., Emaus, T. L. and Meester, W. D. (1973). Adrenergic
receptors in turtle ventricle myocardium. Eur. J. Pharmacol. 24, 145-150.
Wang, T. and Hicks, J. W. (1996a). Cardiorespiratory synchrony in turtles.
J. Exp. Biol. 199, 1791-1800.
Wang, T. and Hicks, J. W. (1996b). The interaction of pulmonary ventilation
and cardiac shunts on arterial oxygen levels. J. Exp. Biol. 199, 2121-2129.
Wang, T. and Hicks, J. W. (2002). An integrative model to predict maximum
O2uptake in animals with central vascular shunts. Zoology 105, 45-53.
West, N., Butler, P. J. and Bevan, R. M. (1992). Pulmonary blood flow at
rest and during swimming in the green turtle, Chelonia mydas. Physiol.
Zool. 65, 287-310.
White, F. N. and Ross, G. (1966). Circulatory changes during experimental
diving in the turtle. Am. J. Physiol. 211, 15-18.
White, F. N., Hicks, J. W. and Ishimatsu, A. (1989). Relationship between