UNIVERSITY OF TWENTE
Development of a new
pro-active vehicle actuated
signal control strategy
-Evaluation on an urban
intersection in Athens
Master ThesisAntonios Chaziris
s1000667
2
Table of Contents
Table of Contents ... 2
List of Tables ... 7
List of Figures ... 8
List of Pictures ... 9
1. Introduction ... 10
1.1 Background ... 10
1.2 Scope ... 10
1.3 Research questions - approach ... 11
1.3.1 Strategy definition ... 11
1.3.2 Strategy building ... 12
1.3.3 Implementation/testing ... 13
1.3.4 Further questions ... 13
1.4 Available resources ... 13
1.4.1 Hardware ... 14
1.4.2 Software ... 14
P2 ... 14
Control ... 15
Traffic Language ... 15
VISSIM ... 16
1.5 Report Structure ... 16
2. Literature review ... 18
2.1 Background ... 19
2.2 Signal control objectives / measures of effectiveness ... 20
2.2.1 Objectives ... 20
Efficiency related objectives ... 21
Other objectives ... 22
2.2.2 Discussion ... 24
2.2.3 Measures of effectiveness ... 25
2.3 Detector capabilities ... 26
2.4 Traffic estimates ... 27
2.4.1 General ... 27
2.4.2 Existing methods... 28
3
2.4.4 Discussion ... 31
2.5 Signal optimisation methods... 33
2.5.1 General ... 33
2.5.2 Heuristic (rule-based) techniques ... 33
2.5.3 Fuzzy logic in signal control ... 35
2.5.4 Dynamic programming ... 36
2.5.5 Explicit/Implicit enumeration techniques ... 38
2.5.6 Store and Forward methods... 39
2.5.7 Discussion ... 41
2.6 Related aspects ... 42
2.6.1 Stage sequence flexibility ... 42
2.6.2 Signal coordination ... 43
3. Study area design ... 44
3.1 Study area selection ... 45
3.2 Traffic data ... 45
3.2.1 General ... 45
3.2.2 Finding an appropriate data set ... 46
3.2.3 Building demand scenarios ... 47
3.2.4 Exporting the appropriate data to VISSIM ... 48
3.2.5 Additional observations ... 49
3.3 Design in SITRAFFIC ... 50
3.3.1 General ... 50
3.3.2 Design process ... 50
Topography ... 50
Signal group references ... 51
Traffic data ... 51
Stage control ... 51
Signal programs ... 51
VISSIM export ... 52
3.4 Simulation development ... 53
3.4.1 Layout and signal plans ... 53
3.4.2 Turning movements ... 53
3.4.3 Measurement locations ... 53
4
3.4.5 Routes ... 54
3.4.6 Conflict areas ... 55
3.4.7 Driving behavior... 56
3.4.8 Traffic compositions - Speeds ... 57
3.4.9 Pedestrian crossings ... 58
4. Strategy development ... 59
4.1 General framework... 60
4.1.1 Adoption of the rolling horizon approach ... 60
4.1.2 Parameterisation ... 60
Horizon duration ... 60
Time step – switching step ... 61
4.1.3 Optimisation ... 63
4.1.4 Traffic estimation ... 68
4.1.5 Optimum search technique ... 69
4.1.6 Signal coordination ... 69
Existing approaches ... 69
Current framework ... 70
Remarks on study design ... 70
4.1.7 Additional practical issues ... 71
4.2 Strategy modules ... 72
4.2.1 Traffic estimation (TE) module ... 72
General... 72
Module description ... 72
Consistency checks ... 75
Oversaturation ... 76
Advantages ... 77
Further considerations... 77
4.2.2 Signal monitoring (SM) module ... 78
4.2.3 Turning percentage (TP) module ... 78
4.2.4 Branch and bound (BB) module... 80
Module structure ... 80
Possible enhancement ... 82
4.3 Development process ... 83
5
5.1 Evaluation method ... 90
5.2 Validation of results ... 92
5.3 Testing... 93
5.3.1 Evaluation design ... 93
5.3.2 Results ... 95
5.3.2.1 Scenario 1 - morning ... 95
5.3.2.2 Scenario 2 – mid-day ... 103
5.3.2.3 Scenario 3 – evening ... 110
5.3.2.4 Scenario 4 – night... 116
5.3.3 Robustness ... 122
Hardware failures ... 123
Capacity drops ... 124
Demand ... 125
Practical example ... 125
6. Discussion ... 131
6.1 Efficiency and applicability ... 131
6.2 Added value ... 132
7. Further research ... 135
References ... 136
Annex 1 – Intersection layout ... 141
Annex 2 – Fixed time signal plans ... 142
Signal Program 1 (scenario 1) ... 142
Signal Program 2 (scenario 2) ... 142
Signal Program 3 (scenario 3) ... 143
Signal Program 4 (scenario 4) ... 143
Annex 3 – TL code manual ... 144
1 Commonly used subroutines... 144
1.1 arrivalselection ... 145
1.2 arrivalupdate, arrivalupdate1, arrivalupdate2 ... 145
1.3 STstateselection, STstateupdate ... 145
2. Signal Monitoring (SM) module ... 145
3.0 Traffic Estimation (TE) module ... 146
3.1 “queuecheck” subroutine ... 149
6
5.0 Branch and Bound (BB) module ... 150
5.1 “bbcontinue” subroutine ... 155
5.2 “bbswitch” subroutine ... 155
5.3 “pathindicator” subroutine ... 156
6.1 “Initial values” module ... 156
7.1 “Interface SL” module ... 156
8.1 Anwenderfunktion, AnwenderInit, Hauptfunktion ... 157
7
List of Tables
Table 1. Work Package 2 objectives ... 44
Table 2. Average flows (veh/h) per measurement location (for Tuesdays, Wednesdays and Thursdays, for February-March, 2008)... 47
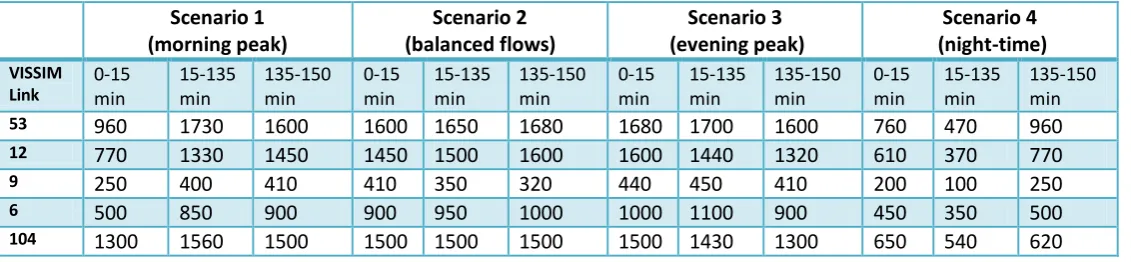
Table 3. Link flows (hourly) per demand scenario ... 49
Table 4. Turning proportions (%) at intersections per demand scenario... 55
Table 5. Versions of the strategy tested through the development process ... 63
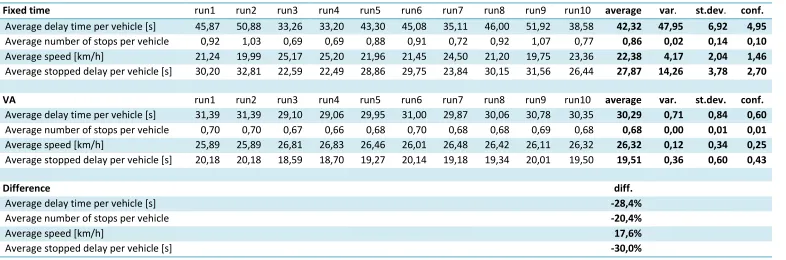
Table 6. Average delay, nr of stops, speed and stopped delay per vehicle, for the intersection (Scenario 1) ... 96
Table 7. Average and maximum queue lengths (m) per intersection approach (Scenario 1) . 98 Table 8. Average delay, stopped delay and number of stops per vehicle, per intersection approach (Scenario 1) ... 100
Table 9. Fuel consumption over the intersection under fixed-time and VA strategies (Scenario 1) ... 102
Table 10. Average delay, nr of stops, speed and stopped delay per vehicle, for the intersection (Scenario 2) ... 104
Table 11. Average and maximum queue lengths (m) per intersection approach (Scenario 2) ... 105
Table 12. Average delay, stopped delay and number of stops per vehicle, per intersection approach (Scenario 2) ... 107
Table 13. Fuel consumption over the intersection under fixed-time and VA strategies (Scenario 2) ... 109
Table 14. Average delay, nr of stops, speed and stopped delay per vehicle, for the intersection (Scenario 3) ... 111
Table 15. Average and maximum queue lengths (m) per intersection approach (Scenario 3) ... 112
Table 16. Average delay, stopped delay and number of stops per vehicle, per intersection approach (Scenario 3) ... 113
Table 17. Fuel consumption over the intersection under fixed-time and VA strategies (Scenario 3) ... 115
Table 18. Average delay, nr of stops, speed and stopped delay per vehicle, for the intersection (Scenario 4) ... 117
Table 19. Average and maximum queue lengths (m) per intersection approach (Scenario 4) ... 119
Table 20. Average delay, stopped delay and number of stops per vehicle, per intersection approach (Scenario 4) ... 120
8
List of Figures
Figure 1 Graphical representation of two possible future vehicle arrivals (Source:
Mirchandani and Head, 2001) ... 32
Figure 2. Graphical representation of the explicit (left) and implicit (right) enumeration techniques (source: Shelby, 2004) ... 38
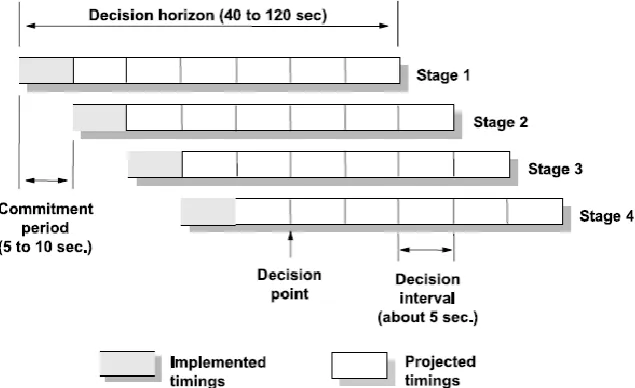
Figure 3. The rolling horizon concept (source: Dion and Hellinga, 2002) ... 41
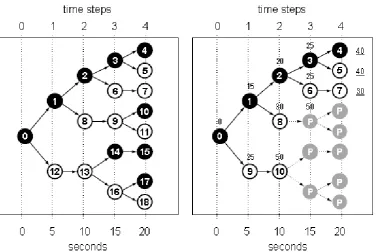
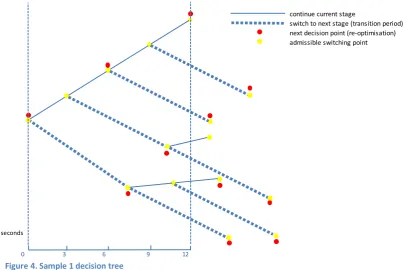
Figure 4. Sample 1 decision tree ... 65
Figure 5 Sample 2 decision tree ... 65
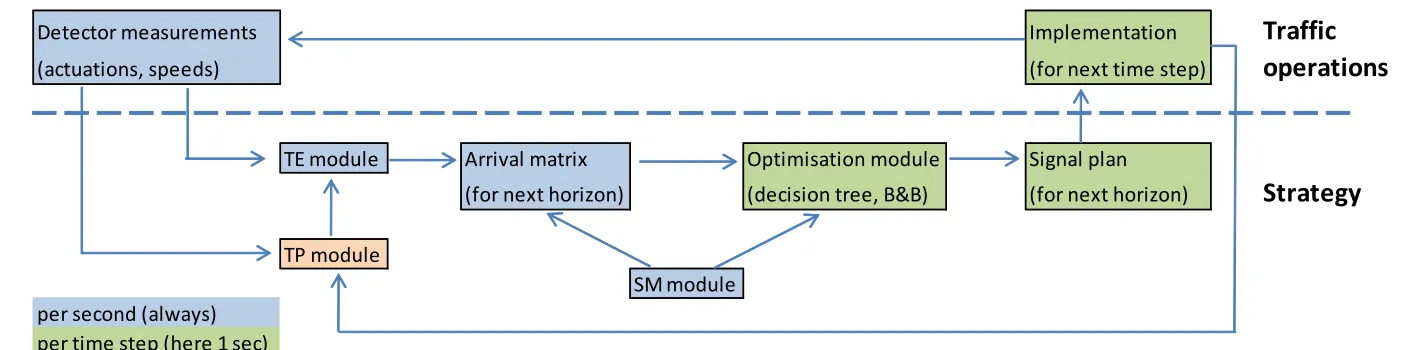
Figure 6. Strategy framework ... 85
Figure 7. Queue evolution under incident and under normal flow (approach 1) ... 127
Figure 8. Queue evolution under incident and under normal flow (approach 2) ... 128
Figure 9. Queue evolution under incident and under normal flow (approach 3) ... 128
9
List of Pictures
Picture 1. Measurement locations (cars) around the intersection ... 46
Picture 2. Intersection layout in P2 ... 50
Picture 3. Example of signal plan creation in P2 ... 52
Picture 4. SC-Det record in full screen ... 94
10
1. Introduction
1.1 Background
Traffic congestion is a problem that has appeared during the second half of the 20th century, as car ownership has risen dramatically. Along with it, the need for efficient traffic signal control became apparent. Efficient control of traffic with the use of traffic signals, especially in large cities, results in the reduction of lost time, increased safety and potential environmental benefits. Although the use of signal control alone, is not able to entirely solve the problem of traffic congestion, it can significantly improve the movement of vehicles and goods through road networks yielding significant benefits in economic and social terms.
The use of traditional fixed-time signal control is efficient in cases where demand is relatively constant and results in an straightforward operation which is relatively easy to maintain. Several methods exist for optimizing the operation of fixed-time traffic signals, like the well known delay-minimization method proposed by Webster (1958). Moreover, commercial systems like TRANSYT-7F (Wallace et. al., 1998) offer a well established solution for assisting in the optimization and management of fixed-time traffic control.
However, in real-life traffic operations and especially within large cities, demand is rarely constant throughout the day and significant fluctuations can occur even within short time due to incidents, even within periods when demand is usually constant. In such cases, the operation of fixed-time traffic control can be sub-optimal and the need for vehicle actuated (VA) (elsewhere referred to as traffic responsive or adaptive) control arises.
VA control exploits traffic measurements in real time in order to adjust and optimize signal timings according to the prevailing (or future) traffic conditions. The advantage of vehicle actuated control is that it quickly responds to the prevailing traffic conditions therefore it is able to minimise several performance measures over the controlled network. The disadvantage is that usually, strategies are more complicated and include sophisticated logics which might be difficult to implement in practice. Moreover, this type of control is more prone to hardware failures.
A large number of different VA strategies exist which make use of several different methodologies ranging from simple modifications to fixed-time control to very sophisticated optimising strategies which make use of complex traffic prediction models. A detailed review of such strategies is provided in the literature review chapter. The benefits yielded by those strategies also vary significantly, therefore research and discussion around VA signal control approaches is vivid.
1.2 Scope
11 control has not been widely implemented and tested, apart from few small scale heuristic applications. Moreover, the typical traffic characteristics of a southern European country makes the development and testing of vehicle actuated control more interesting and challenging.
The scope of this Master Thesis is to develop a new vehicle actuated signal control strategy that can operate efficiently in an urban network with the particularities of a city like Athens, with the resources available in the Athens Traffic Management Centre (ATMC); and to contribute to the current state-of-the-art by identifying, studying and enhancing promising methods for VA control, found in the literature.
To implement a vehicle actuated signal control strategy (either for an isolated intersection of for a network) there is a need to tailor it to the needs and particularities of the area of interest. Even a very efficient signal control strategy will be successful only if it can be fully applicable to the selected field. Restrictions imposed by the available hardware (i.e. type of controllers and detectors), particularities in the traffic profile of the area of interest, capability to ‘translate’ the strategy into the language of the controller etc, could pose significant problems on the implementation of a VA signal control strategy. For this project, these concerns apply only to a certain extent as the target is to implement the signal control strategy at a micro-simulation environment. However, the strategy that will be developed aims at being potentially applicable to a real environment therefore the above considerations are taken into account.
Finally, this thesis, besides implementing a new vehicle actuated signal control strategy, aims to develop a methodology that will also be applicable to other similar networks. The development of the strategy does not aim to be an area specific study but a work with wider applicability.
1.3 Research questions - approach
In this section, the research questions of this thesis as well as the approach that was adopted to address each question are discussed. The research questions are divided into three parts: the first part concerns questions related to the definition of the strategy, the second part concerns questions about building the strategy and the third part is concerned with questions related to implementing and testing the strategy.
1.3.1 Strategy definition
The first part of the research questions aimed at outlining the possible objectives and methods that could be adopted for the development of the strategy. The first research question was:
1. What are the candidate objectives for the new vehicle actuated signal control strategy?
12 2. How will the particularities of the study area guide us in the definition of the strategy
objectives?
An extensive literature review (chapter 2) was also important to identify different objectives used in existing VA approaches, which would assist in the definition of the most appropriate ones for this case. After having defined a number of candidate objectives (chapters 2 and 3), the methods that could be exploited to achieve these, were explored. A set of research questions related to the exploration of these methods followed:
3. What can be measured from the available detectors? What are the advantages and disadvantages of using each type of measurement for the signal timing optimization?
4. Should the strategy aim at pro-active or reactive signal control? (from another point of view: the optimization procedure should be on a rolling horizon or once in each cycle?)
5. What models can be employed for traffic predictions? (in case of pro-active control)
Question 4 was a main research question which took into account the advantages and disadvantages of each approach and defined many subsequent parts of the strategy. Apart from the nature of the signal control method, research questions related to the optimisation process were defined:
6. Which measures of performance can be used for the signal optimization process? Why these?
7. What convergence algorithms can be exploited for the signal optimization process?
Concerning question 6 the selection of performance measures needed to be made by considering several factors, instead of simply selecting the minimization of delays as the most well-known and widely-used performance measure. The answer to questions 3 - 7 was provided through the literature review (chapter 2).
1.3.2 Strategy building
The definition of the objectives and of an appropriate toolbox of methods allowed to start developing the strategy. The set of research questions concerning the building of the strategy were:
8. How can the selected methods be developed with the existing software?
9. What are the limitations that restrict us from using some tools? What compromises should be made?
10. How can the selected methods be enhanced and be tailored to the needs of this project?
11. What is the added value of the developed strategy compared to previous VA approaches?
13
1.3.3 Implementation/testing
After the development of the strategy and the set up of the simulation environment, traffic operations under the new VA control were tested. On that purpose, firstly, a set of appropriate efficiency measures had to be selected:
12. Which set of efficiency measures will be employed to test the strategy?
Moreover, the performance of the strategy was compared to the performance under other operational situations and under different demands, so as to quantify the reliability of the strategy:
13. How does the strategy perform in comparison to the existing fixed time signal plans?
Finally, it was important to investigate the performance of the strategy under extreme scenarios concerning incidents or hardware failures. In other words:
14. What is the robustness of the developed strategy?
A final research question related to testing the strategy concerned its appropriateness for road networks with different characteristics. The strategy objectives as well as the measures of performance were affected by the study area particularities, therefore, its effectiveness on a different network would be under discussion. The above can be summarized to the following research question:
15. How might the applicability of the developed strategy be hindered on networks with significantly different characteristics than the one studied?
Research questions 12-14 were eventually answered through the evaluation study presented in chapter 5 and research question 15 through the discussion presented in chapter 6.
1.3.4 Further questions
A potential limitation arising from the adoption of vehicle actuated signal control strategies (as well as any other traffic management scheme aiming to improve traffic flow) concerns the rise of latent demand. In this respect, the following research question could have been addressed:
- What will be the impact in traffic demand from the implementation of the strategy in the selected arterial?
This question was not addressed because to answer this question adequately, fluctuations in demand at a macroscopic level, including the network outside the arterial (impact on OD matrices on a larger area, after the application of the new strategy) should be studied. However, this requires an extensive work which is not possible to be carried out with the time available for this study. However the potential of the rise of latent demand, might be considered as an interesting extension of this research in the future.
1.4 Available resources
14
1.4.1 Hardware
The most common type of controller used in the city of Athens is the SIEMENS C800. The controller’s microcomputer is able to control up to 48 signal groups. The maximum allowable signal cycle is 300 seconds. The standard functions of signal control are realized independently in the C800 controllers with the aid of the data and parameters entered by the user (signal plans, intergreen times etc.). Furthermore, the C800 controllers are capable of integrating vehicle actuated signal control strategies. For that purpose, various control processes are available for use from the controller. The most suitable control process for the needs of the current project (full traffic actuation, several intersections, control flexibility) is the PDM control process. In this process, signal groups are controlled at the stage transitions. Within one stage, the status of the signal groups remain the same.
The Athens Traffic Management Center uses two types of detectors for traffic measurements, namely inductive loop detectors and video detectors. Single inductive loop detectors will be exploited in this project as they are available in the selected study area (see following chapter). Each of the single loop detectors is connected to an LD4 module which has high sensitivity and quick response time. LD4 switches on the detector when a vehicle is present and switches it off when there is no vehicle. It has several sensitivity levels to account for different vehicle categories and hence it needs appropriate calibration. Furthermore, the status of LD4 is checked every 10 ms and the 10ms intervals are added for the time the detector is occupied (to calculate occupancy). These recordings also lead to the estimation of several other traffic data such as traffic flows and gaps.
1.4.2 Software
To develop a vehicle actuated signal control strategy and to implement it to a simulation environment three packages need to be used, namely: P2, Control and Traffic Language. Apart from the software mentioned before, the VISSIM micro simulation environment developed by PTV will be used. In this section, these packages are briefly presented.
P2
SITRAFFIC P2 is an object-oriented tool for planning traffic signal controlled networks and intersections in fixed-time and traffic-actuated control systems (SIEMENS, 2005). It covers the development of signal programs (taking any evaluation of signal plans into account), time-distance diagrams and basic data for vehicle actuated control.
15 After the previous steps, the traffic data can be inserted to serve as a basis for the calculation of the appropriate signal plans. P2 is capable of estimating green times for fixed-time signal plans, based on a simple method which aims at balancing the degree of saturation in each intersection approach. In order to develop signal plans, the appropriate control method should be selected (PDM in our case). The stages, the possible stage sequences, details concerning the stage transitions and the possible green extensions can then be defined. Finally, after the signal programs are developed, the appropriate switch-on and switch-off points are defined.
The data created in P2 can be exported for use to other programs. In case of vehicle actuated control, the output data from P2 are used by other packages (Control) and are used as a basis for the data that will be used as input in the C800 controllers.
Control
The SITRAFFIC Control data input program offers a convenient interface to communicate all required data of the signal programs to the C800 controllers (SIEMENS, 2003). The program allows the input data of the C800 to be created/imported, modified and loaded to the controller. All the data of an intersection is combined in one project. As early as the project configuration stage, the project administration function checks every component (basic data inputs, user program, simulation, etc.) for dependence relationships and compatibility.
The heart of Control is the Project Management component. The objects for all the sub-areas can be accessed from this component. When a new project is created, the type of controller should first be defined. A number of basic data should also be inserted (i.e. data transmission methods, activation/deactivation processes, signal groups, cycle times, etc). Color combinations and signal group descriptions are defined in the area concerning signal definitions. Minimum greens/reds, intergreen times, offsets, and switch-on/off patterns are defined in the area concerning signalization. Most of these data are automatically retrieved when an existing project from P2 is imported. Some additional data that need to be defined by the traffic engineer concern information that was not defined in P2 and concerning traffic actuation, i.e. the assignment of specific functions to detectors (type of traffic measurements, critical values etc.), the assignment of detectors to signal groups, the state of the various signal groups in the various stages, additional information on stage transitions etc.
Traffic Language
To integrate complicated processes and algorithms into the signal control strategy, the use of Traffic Language (TL) is required (SIEMENS, 2005). This tool serves for solving both simple and more demanding signal control problems. TL includes a flow-chart editor which assists the user in the formulation of logical conditions in a graphical manner. Within the program module, traffic function libraries offer solutions for a number of traffic sub-problems.
16 VISSIM
The micro simulation software VISSIM (PTV, 2008) will be used in this study as a platform for testing the applicability, efficiency and robustness of the developed signal control strategy.
The traffic flow model in VISSIM is based on a psycho-physical car following model for longitudinal vehicle movement and a rule-based algorithm for lateral movements. The model is based on an extension of Wiedemann’s 1974 car following model (Wiedemann, 1974), which is referred in VISSIM as “Wiedemann 1999”. VISSIM is a microscopic, time-step and behaviour based simulation model developed to model urban traffic and public transit operations. The program can analyze traffic and transit operations under constraints such as lane configuration, traffic composition, traffic signals, transit stops, etc., thus making it a useful tool for the evaluation of various alternatives based on transportation engineering and planning measures of effectiveness. VISSIM can record a large number of parameters for each vehicle moving in the network and provide disaggregate results per vehicle and time-step. Moreover, it can provide aggregate measures for the network performance and also evaluate specific parts of the network (i.e. intersections). Moreover, in order to obtain results which are not dependent on the arrival process (seed) of one specific demand, several simulations for each demand profile can be made using different seeds by exploiting the VISSIM feature called “Multirun simulation”. In this way, all data needed for signal control strategy evaluation can be obtained.
To design a realistic simulation, a lot of data have to be set manually in the software. Some of these are readily available (i.e. traffic demand for different days and hours), some can be obtained by drawings (i.e. intersection layouts) and some need to be estimated by the traffic engineer according to the selected study area (i.e. driving behavior, lane closures etc.).
The data and the traffic control strategy created and processed with P2, Control and Traffic Language can be transferred to VISSIM for implementation. The equivalent to the C800 controller can be selected in VISSIM (called SIEMENS VA). From P2 an export of a file is possible in order to transfer the intersection layout and fixed time signal plans directly to the VISSIM environment. However, as the design environment of the two programs differs, some elements (such as connectors, routes, conflict areas etc) have to be redefined or corrected in VISSIM. After the correct topography is created, the signal control strategy should be imported by selecting several program and configuration files and libraries exported from P2, Control and TL. Once the files are imported, the user can select the appropriate output files and windows in order to evaluate the operation of the signal control strategy.
1.5 Report Structure
17 More specifically, the second chapter concerns the literature review. The purpose of this chapter is to provide a good understanding of the existing methods and techniques used in traditional and contemporary VA control strategies in order for the selection of the methods for this Thesis to be properly supported.
The third chapter concerns the design of the study area using the available software. A robust picture of the study area and its particularities is formulated, the traffic data are collected, the demand scenarios to test the effectiveness of the strategy are developed and the design of the area in SITRAFFIC P2 (SIEMENS, 2005) and VISSIM (PTV, 2008) is presented. The simulated network resembles traffic operations in the area in a realistic way and operation under the existing fixed time plans and the new VA control strategy can be simulated.
The fourth chapter presents the development of the VA strategy. The chapter describes the concept in detail, describes the rationale of the new idea, analyses all technical issues concerning its development and discusses the programming effort. The programming code as well as an extensive manual that helps reading it and understanding it are provided in Annexes 3 and 4.
The fifth chapter includes the results from the testing of the VA strategy in VISSIM. This chapter includes comparisons of the results yielded by the VA strategy with the fixed time signal plans, performance under different demands and the robustness assessment of the road network under the new strategy.
The sixth chapter presents discussion around the new VA strategy, its usefulness, its applicability and its added value. This chapter draws conclusions from the whole development process as well as from the evaluation.
18
2. Literature review
This chapter presents the literature review concerning existing methods and techniques used in vehicle actuated signal control, as well as other aspects (such as hardware capabilities) related to the development of the strategy of this Thesis. Moreover, the aim is to discuss the applicability of the existing methods on the strategy to be developed and support the decisions taken for the design of the strategy.
More specifically, the chapter provides answers to the research questions 1-7:
1. What are the candidate objectives for this vehicle actuated signal control strategy?
2. How will the particularities of the study area guide us in the definition of the strategy objectives? (answered also through chapters 3 and 4)
3. What can be measured from the available detectors? What are the advantages and disadvantages of using each type of measurement for the signal timing optimisation?
4. Should the strategy aim at pro-active or reactive signal control? (from another point of view: the optimisation procedure should be on a rolling horizon or once in each cycle?)
5. What methods can be employed for traffic predictions?
6. Which measures of performance can be used for the signal optimisation process? Why these?
7. What convergence algorithms can be exploited for the signal optimisation process?
The structure of this chapter is as follows:
19
2.1 Background
This section provides information on the particularities of this study that played an important role in the decisions taken for the formulation of the strategy. These particularities should be kept in mind when reading the following chapters.
The signal control strategy formulated in this Thesis is intended to be applicable not only on isolated intersections but also to arterial networks. A very wide variety of vehicle actuated strategies developed during the last years, although very efficient, are difficult to be applied to more than one intersection either due to their complexity (in terms of required computational power) or due to their critical assumptions concerning the topology of the network, the detectors etc. Strategies like RHODES (Mirchandani and Head, 2001), OPAC (Gartner, 1983) and PRODYN (Farges et. al., 1983) aim to provide a solution to the optimal signal control problem by estimating signal timings that minimise a given performance measure, for traffic estimates referring to a future time horizon. In those cases, the formulation of the problem requires knowledge of vehicle arrivals on the downstream intersections, based on upstream detector data, for the near future. However, to obtain a reliable traffic forecast, the signal decisions of the upstream intersections are also required; while these signal decisions are based on the traffic forecasts. This results in a loop which requires employment of recursive algorithmic techniques such as dynamic programming, to be solved. Furthermore, the problem cannot be solved locally (for each intersection) but should be solved globally (for all intersections) and the complexity of the algorithm rises exponentially with the number of intersections. For that reason, such strategies have either remained at a theoretical level or have only been evaluated only in a simulation environment, mostly at a single intersection.
Other strategies, like GASCAP (Owen and Stallard, 1999) although conceptually applicable to more than one intersection, employ traffic estimation methods (in the specific case queue estimation) that requires upstream detectors at a large distance from the intersection, without significant changes in the amount of traffic between the detectors and the intersection. Such requirements make those strategies difficult to be applied in a real world arterial as the necessary assumptions are very difficult to be satisfied. Other strategies, like the one proposed by Liu et. al., (2002), present viable and efficient strategies which; however, use very specific applications especially developed for that purpose, such as vehicle re-identification from the detectors using waveforms (which serve as a unique id of each vehicle) to estimate individual vehicle delay, therefore are severely restricted by the capabilities of the available hardware.
One of the main purposes of this strategy is to be efficient but also applicable in an urban arterial with complicated traffic patterns (like in the Athens road environment), relatively closely spaced intersections and limited hardware availability (only inductive loop detectors). This challenge restricts the use of some methods as will be discussed in the following chapters.
20 1982) and UTOPIA (Mauro and Di Taranto, 1989), compute the whole control logic at a central computer and then distribute it to local traffic controllers. On the other hand, in a decentralised system, each intersection controller contains the whole control logic and decides what its signal state should be. There are, of course, hybrids of the decentralised/centralized architectures because, for any practical system, some of the intelligence for the signal system must reside at a central computer. However, decentralised vehicle actuated control potentially can serve an unlimited number of intersections because the control logic is distributed at each intersection. Examples of such systems are DYPIC (Robertson and Bretherton, 1974), OPAC, PRODYN, MOVA (Vincent and Young, 1986) and lately GASCAP (Owen and Stallard, 1999).
In this project, the choice between a centralised and a decentralised system was dictated by the capabilities of the available hardware. In fact, vehicle actuation applications, from the simplest to the most sophisticated, have to be carried out at the local controller as no superior level (central, or strategic computer) exists. Athens is a city which is still mostly controlled by semi-actuated strategies (automatic selection between a number of pre-specified fixed time plans) therefore no architecture that can serve a centralized, fully adaptive strategy has been developed. On that purpose, this strategy will be developed to fully operate locally, in each traffic controller.
2.2 Signal control objectives / measures of effectiveness
This section discusses the results of the literature review on signal control objectives, performance measures and measures of effectiveness. It should be mentioned that the signal control objectives and the performance measures are related but, for the same objective (i.e. minimisation of the environmental impact) different performance measures of can be used (i.e. minimisation of accelerations or number of stops or fuel consumption, etc). The measures of effectiveness though are the criteria by which the success of the strategy implementation will be evaluated. These measures can be different from the performance measures used for the optimisation. For example, the performance measure can be the delay over the intersection but the strategy can be evaluated also by the number of stops and the queues it results to.
The objectives as well as the strategies used to pursue them, presented in this chapter, include traditional as well as more modern approaches towards signal control. The possibility to select each objective for the strategy of this Thesis is discussed and leads to the selection of objectives presented in the final section. Finally, the last section, apart from the selection of objectives aims to provide an answer to the question: when is the strategy successful, or in other words: when can we say that the objectives were fulfilled. This question relates to the evaluation of the strategy presented in chapter 5.
2.2.1 Objectives
21 effectiveness. The second family of objectives, includes other objectives, not directly related to traffic efficiency which; however, are of high interest for other reasons. Such objectives include the environmental impact of traffic or the accessibility for vulnerable road users. The usefulness and applicability of each objective for the present Thesis is also discussed.
Efficiency related objectives
The most common objective, pursued by the majority of the signal control strategies, is the minimisation of vehicle delays. The minimisation of delay, as an objective, can be interpreted in many ways, depending on the examined area (total network delay, total intersection delay, link delay), on the type of delay (due to the presence of other vehicles, due to traffic signals, due to existing queues, etc) and on the measure of delay (per vehicle or rate of delay).
Most well-known vehicle actuated signal control strategies (SCOOT, SCATS, OPAC, PRODYN, RHODES, CRONOS), use delay as a performance measure to minimise within their optimisation procedure. However, delay can be quantified by using several methodologies. Traditional delay formulas such as the one proposed by Webster (1958) or by Kimber and Hollis (1979) estimate the delay due to the presence of traffic signals and not due to other reasons such as the presence of other moving vehicles. However, a vehicle actuated strategy might use these formulations to estimate the optimal traffic signals based on “delay minimisation”. Therefore, it should be kept in mind that the term delay minimisation is used by several strategies; however, not always in exactly the same way.
An example of a very simple delay minimisation method is provided by the CRONOS system (Boillot et. al., 2006). The system aims to minimise the total delay over the control zone (single or multiple intersections), for a given time horizon. The performance measure is a simple aggregation of the stopped vehicles (vehicles in queue, plus vehicles stopped within intersections) in each time step, multiplied by the duration of the time step, and summed up for the time horizon.
The delay minimisation objective can also include several weighted terms of delay. The weights can be assigned to distinguish between different links (i.e. the delay in the main direction can be considered as more important than the delay in a secondary road), different vehicle types (i.e. delay of transit vehicles more important than delay of cars) and so on. The delay is a performance measure considered closely related to other performance measures like vehicle emissions (Bretherton et. al., 2002, SCOOT advice leaflet). In that sense, delay is a universal performance measure that can be used as a proxy measure to satisfy various objectives.
22 will most likely lead to the extension of the green time until reaching its maximum value. Moreover, for the same reasons, this approach will always lead to the maximum allowable cycle time. Due to that fact, the objective of capacity maximisation will lead to significantly different signal timings than delay minimisation, these two objectives are contradicting.
An objective related to the capacity maximisation, from a more general point of view, aims at minimising the risk of oversaturation or the spillback of link queues at upstream intersections. As an example, the TUC strategy (Diakaki et. al., 2002), attempts to fulfill the above objective by balancing the link’s relative occupancies.
Signal control strategies are not always designed to pursue a single objective but usually use a combination of objectives. In that sense they attempt to minimise performance indices consisting of a weighted combination of different performance measures. As an example, the system proposed by Vasudevan and Chang (2006), uses a weighted combination of vehicle queues, intersection control delays, and stop times. Another characteristic example is SCATS, which adopts the multiple objective of minimising stops when the traffic is low, delay when the traffic is heavy and travel time. SCATS attempts to fulfill these objectives by balancing the degrees of saturation of the intersection approaches.
Efficiency, as expressed from all previous objectives, can be regarded as the main target set by the traffic engineer; however, other objectives not directly related to efficiency can be of equal or greater importance. These are discussed in the following section.
Other objectives
A limitation for many of the existing signal control strategies is that there is no special provision for transit vehicles, which are effectively treated as normal passenger cars. In networks where transit traffic shares the physical space with passenger cars this limitation is even more pronounced. However, in mixed traffic operation, transit vehicles may hold up other traffic while loading passengers even if the signal is green. When this happens, especially near a signalized intersection, this traffic-transit interaction should be described properly as an input into the signal plan generation procedure. One should also give appropriate priority to transit vehicles, so that the total cost and delay to cars and transit passengers can be minimised (Yagar and Han, 1994).
23 In the latest version of SCOOT, a differential priority objective is included where the degree of priority is defined according to how late a transit vehicle is according to its schedule as well as on the link that the transit vehicle is moving (main or secondary road). Of course, to include such an objective to the signal control strategy, an automatic vehicle location on every transit vehicle is required. Moreover, this objective is meaningful only in networks with significant passenger traffic using transit vehicles and where transit vehicles are more likely to experience significant delays due to congestion.
The environmental impact is increasingly taken into account in the objectives of vehicle actuated signal control strategies. However, the variety of approaches in the subject results in different objectives.
Bretherton et. al., (2002), referring to the latest version of SCOOT, claim that the reduction of delay, which is the primary objective of SCOOT, leads to a reduction in vehicle emissions. However, from other studies it has been suggested that pursuing efficiency in signal control will not always lead to a respective decrease in traffic emissions. Signal control strategies with an objective to mitigate traffic congestion and with an objective to reduce traffic emissions are usually different, and sometimes conflictive (Chen and Yu, 2007). On that purpose, signal control strategies including clearly environmental objectives have been developed.
To unambiguously include the emission reduction in its objectives, SCOOT uses an emission estimation model. The emissions model works by first calculating an emissions rate per vehicle and unit distance from the average speed on the link. An emissions rate is estimated for each vehicle class. The emissions are then multiplied by the length of the link and the flow rate of the relevant vehicle class. Finally, the emissions for each vehicle class are summed to provide a mass per unit time on the link. Apart from the availability of real time traffic flows, speeds and proportions of vehicle classes, this methodology implies the existence of an appropriate model which estimates the emissions per vehicle from the above data. However, such a model should be developed or calibrated to a specific study area otherwise differences in vehicle fleet technologies, vehicle ages or driving styles might result in significantly different emission estimates compared to reality.
Due to the absence of a model that can effectively be used online for the estimation of emissions from traffic, it is difficult to include the minimisation of the environmental impact of the strategy in this Thesis as a primary objective. However, it is possible to use a number of proxy measures directly related to emissions to evaluate the relative performance of different signal control strategies. On that purpose, these proxy measures can be used as measures of effectiveness of the strategy to allow comparisons with the existing fixed time plans. This subject is further discussed in the following sections.
24 nowadays a shift of emphasis to vulnerable road users like pedestrians and cyclists (Carsten et al., 1998). The consideration only of vehicular traffic on signal control optimisation might well lead to longer cycle times, especially during congested periods. However, longer cycles mean increased waiting times for pedestrians therefore can increase non-compliance and reduced safety.
Video and microwave technology have recently enabled signal control strategies to be not only “vehicle-actuated” but also “pedestrian-actuated”. This was the basis for the study conducted by Carsten et al. (1998) in the vulnerable road user traffic observation and optimisation (VRU-TOO) project. Microwave detectors were employed to register the approach of pedestrians at three different test sites. Results showed that the pedestrian green phase was prolonged if there was a high pedestrian demand or if there were still pedestrians on the road at the end of the green phase. Moreover, pedestrian actuated control lead to improved safety (measured in terms of fewer conflicts between cars and pedestrians, reduced crossing of pedestrians during red and less crossing nearby the junction) and significantly reduced delays for pedestrians. The vehicle delays increased but not significantly compared to the significantly reduced pedestrian delays. In that sense, multi-objective strategies including a combination of passenger car and vehicle delays might result in improved equity between the various road users.
The importance of pedestrian delay strongly depends on the location of the network as well as on the magnitude of pedestrian volumes. At busy central areas, commercial sites etc, pedestrian delays are far more important compared to main arterials outside the city centre with less frequent crossing attempts. Finally, to efficiently include pedestrians in the control loop, appropriate pedestrian identification systems like the one mentioned above should exist.
The range of objectives covered in the above sections reveal the main tendencies towards signal control derived from the most well-known vehicle actuated strategies. The following section summarises the findings and provides some discussion around the information presented.
2.2.2 Discussion
25 For the examined network, pedestrian delays are important because commercial land uses are adjacent to the road and relatively frequent crossings are taking place. Pedestrian detection can only be realized by using pedestrian buttons on traffic signals. The number of pedestrians waiting or approaching, the crossing time and other variables required for a more sophisticated pedestrian-actuated strategy do not exist. As a result, pedestrian stages will be included in the strategy but will not be included in the optimisation procedure. Pedestrian signal groups will run concurrently with other non-conflicting signal groups, ensuring that pedestrians receive sufficient green within a cycle, without however further optimisation.
The prioritization of public transport might be of high importance for a local traffic agency and might need to be achieved at expense of the rest of the traffic. As mentioned also in chapter 3, in the arterial studied in this Thesis, traffic consists only of passenger cars, while bus lines are only using a small part of the network. Moreover, traffic disruption by light rail or other public transport means does not exist. Finally, Automatic Vehicle Location for transit vehicles is not available in Athens. This poses a significant obstacle in the realization of a strategy including transit priority, as sometimes the transit vehicle needs to be detected at a distance further upstream from the available detector location. For that reason, the intersection for the strategy evaluation was selected so as to have minimal transit traffic.
2.2.3 Measures of effectiveness
This section discusses the selection of measures for the evaluation of the network operation under the new strategy. These measures should provide a good picture of the network operation and of the strategy efficiency by different viewpoints.
The first and most straight forward criterion, is whether the objectives of the strategy are sufficiently fulfilled. It is crucial to determine whether the operation of the intersection under the new strategy is more efficient in terms of the selected performance measures compared to the old fixed-time plans. Therefore, the performance measures related to the strategy objectives will be quantified and compared between the new and the existing strategy.
26 A final measure to evaluate the effectiveness of the strategy will be its robustness. Network robustness, regarding to Li (2008), is understood “as the analysis of the performance of the road network under the situations with considerable changes in its supply or/and demand compared with its normal or desired performance”. Therefore, robustness is critical for the operation of signal controlled networks under non-recurrent congestion caused i.e. by incidents. On that purpose, it is critical to study the degree of degradation of the network under these circumstances.
VISSIM evaluation files, include several indices which can cover the aforementioned performance measures. Such measures are the average speed in the network, the throughput, the travel times, the overall network delays, queues, stops, emissions and more. The selection of measures, the description of the evaluation testing and the results are presented in chapter 5.
2.3 Detector capabilities
The capabilities of the available vehicle detection hardware can be a critical bottleneck for the real-world implementation a vehicle actuated signal control strategy. A very integrated and sophisticated strategy that requires data that are not possible or very difficult to be collected, might not be able to be implemented. Detector capabilities can differ significantly, depending on the type of the detector (inductive or video) and its technology. For this study, the detectors used in the Athens urban road network are the only source of on-line traffic data. The capabilities as well as the strengths and weaknesses of the specific detectors are discussed in this section, aiming to provide an answer to the research question 3:
3. What can be measured from the available detectors? What are the advantages and disadvantages of using each type of measurement for the signal timing optimisation?
In general, two types of detectors exist in Athens. Inductive loop detectors, placed under the street surface and video detectors placed on poles above the street. This study will make use only of loop detectors as these are the only type of detectors available in the selected arterial. Therefore, this chapter focuses on the capabilities of the loop detectors.
The inductive loop detectors can be further categorized into single and double ones depending on the number of successive loops used. Single inductive loop detectors can primarily measure traffic flow, time occupancy and gap. Traffic flow is calculated as the sum of the times that the loop became occupied within a given interval, reduced to hourly rates. Occupancy is defined as the percentage of time for which the detector remained occupied. When using single loop detectors, speed can be estimated by a formula using the detector length, the average vehicle length, and the flow and occupancy for a given time interval. However, due to the usage of an average vehicle length, the speed measurements obtained from this formula are not always accurate. When using double loop detectors the vehicle speed can be estimated more accurately by exploiting the gap between the actuation of the two loops.
27 dimensions can affect the detection accuracy as a very wide loop might interfere with vehicles passing on adjacent lanes. For that reason, the loop width should be maintained substantially lower than the lane width.
An observation relevant to the formulation of the vehicle actuated strategy concerns the utilization of traffic detectors which affects the quality of measurements. At an urban arterial, where vehicles follow several different routes and change lanes frequently, detectors are not always capable to count all vehicles, as some vehicles might be passing between two detectors. Moreover, large vehicles can be counted by two detectors simultaneously, when changing lanes. Experience in the Athens TMC, has proven that the measurement of traffic flows can be problematic for the above reasons. A possible solution could be to use occupancy instead of traffic flow to determine the state of traffic; however this might be an obstacle for using specific formulas (i.e. for the estimation of delays) which require traffic flow as an input. Another solution is to carefully select the locations of the detectors and place them in sections where those anomalies rarely occur.
A final remark, concerns the presence of parked vehicles on the rightmost lane at specific parts of the arterial. This subject will be discussed in detail in the following chapter and the appropriate modifications to the simulation will be described to achieve resemblance with reality.
2.4 Traffic estimates
2.4.1 General
The availability of reliable traffic estimates is vital for every signal control strategy as it provides the magnitude of traffic for which the signal timings will be optimised. In traditional fixed time control these estimates are retrieved from historical data and refer to a number of representative periods which usually resemble the most characteristic traffic profiles within a typical day. In vehicle actuated control, traffic estimates need to be retrieved in real time and be updated frequently, enabling thus the adaptability component to the implemented strategy.
28 Eventually, this chapter will address the following research questions:
4. Should the strategy aim at pro-active or reactive signal control?
5. What methods can be employed for traffic predictions?
This section first discusses a number of traffic estimation methods used in existing vehicle actuated strategies. Furthermore, it discusses a number of issues related to reactive and pro-active strategies, to clarify a number of advantages and disadvantages associated with each approach. Finally it presents a discussion which leads to useful conclusions for the definition of the methods that will be employed in this Thesis.
2.4.2 Existing methods
A large number of methods exist for obtaining traffic data for the signal timing optimisation process. The complexity of the methods clearly depends on the traffic measures and the accuracy required from the signal optimisation method.
Strategies like SCOOT, TUC, SCATS and GASCAP use the measurements from upstream detectors of a link to optimise the signal timings for the next intersection. These strategies can use different estimates, for example, SCATS, which makes use of detectors at the stop line, collects the gaps between vehicles and the unused green time in each cycle, while SCOOT , which utilises upstream detectors, uses the traffic flow on the measurement location during the cycle. However, they have in common the fact that they use detector readings for a given time period to optimise signal timings for the next period. In that sense, depending on the signal optimisation logic, the traffic engineer can select the required detector readings and the collection method to obtain the most suitable estimates.
Contrary to the use of traffic measurements from past time periods, a number of methods make projections of traffic from an area upstream to a stop line downstream. These methods may require the exploitation of detectors many intersections upstream from the stop line of interest. A representative method of this kind is the PREDICT algorithm which is used in the RHODES system.
The PREDICT algorithm (Head, 1995) uses the actuations of upstream detectors together with the upstream signal decisions and the traffic state in the upstream intersections to determine the vehicle arrivals at the downstream intersection. The use of detector actuations from upstream detectors allows for a long time horizon of predictions to be adopted but also increases the complexity of the algorithm. This approach enables the consideration of the upstream signal decisions and the respective delays to be considered for the signal optimisation downstream.
29 approach of the upstream intersection. Each vehicle that actuates an upstream detector is projected downstream based on a predicted travel time. This travel time is estimated by taking into account: the free flow travel time until the upstream intersection, the respective delay due to other vehicles, the delay due to a possible queue in the upstream traffic signal, the delay due to the signal itself, and the delay due to other vehicles and possible queues after passing the upstream intersection until it reaches the downstream location.
Obviously, each vehicle that actuates a detector should be monitored and its travel time should be updated at every time step until it reaches the downstream location. Moreover, a queue growth and decay estimation should be made continuously. If the upstream intersection also operates under vehicle actuated control, its signal decisions might change over time therefore the delay due to the signal, and the growth and decay of queues will also be subject to further changes. In this way, at each time step, the algorithm returns a traffic arrival prediction for a future time horizon at the downstream location. This method includes monitoring of every vehicle that actuates a detector until it reaches the downstream location, at every time step. It is clear that the complexity for the development and the calibration of such algorithms is quite a large task, however a successful algorithm can provide very useful predictions.
An alternative approach which lacks mathematical elegance but has proved to be quite promising in terms of the accuracy of its traffic predictions is by using artificial neural networks. All neural networks share some basic common features. They are composed of a number of very simple processing elements, known as neurons. These elements receive data from a number of sources and calculate an output which depends on some way on the values of the inputs, using an internal “transfer function”. The neurons are joined together by weighted connections; data flows along these connections and is scaled during transmission according to the values of the weights. The output of a particular neuron may therefore contribute to the input received by another. Naturally such a system is of little use unless it communicates with the outside world and so some connections receive data from an external source, whilst others pass data back out. The neural network’s functionality is very much dependent on the values of the connection weights, which can be updated over time, enabling the neural network to adapt (Dougherty, 1995).
30 modifying the weights of the connections by comparing the network outputs (predictions) with observed values.
A different approach for obtaining the required traffic estimates is by using on-line or real-time simulation. This means that a microscopic simulation system is receiving real-real-time detector data where the objective is to model the prevailing traffic situation as realistically as possible. The on-line simulation can be used for monitoring the overall status of the traffic system despite incomplete detector input. An example of such a simulation system is HUTSIM, which was developed for operation along with the HUTSIG signal optimisation algorithm (Kosonen, 2003).
Finally a number of hybrid approaches for traffic predictions exist. An example is the method used in OPAC. The length of the optimisation stage is divided into two parts: the “head” (length r) and the “tail” (k - r, where k is the stage length). The flow data for the head are obtained from the upstream detectors of the same link, and the flow data for the tail are estimated from a model. An optimal policy is then calculated for the entire optimisation stage but implemented only for the head section. The projection period is then shifted (rolled) up to r units ahead, new flow data are obtained for the optimisation stage, and the process is repeated. This approach is very promising and could potentially be altered, to be combined with simpler estimates for the “tail” period (such as using data from past time-periods).
2.4.3 Reactive vs Pro-active
As mentioned above, reactive strategies use traffic counts for a past time period to optimise signal timings for a future time period. The length of the time period can vary according to the scope of the application. For example, in strategies like TUC, counts of the current number of vehicles present in a link are used to optimise traffic signals, for an infinite future time horizon. The optimisation procedure is repeated at time intervals equal to the cycle (therefore of the magnitude of 60-120 sec). The infinite time horizon ensures that the control does not make myopic decisions and the repetition of the optimisation ensures that the decisions are always in accordance with current demand in the network. However, the fact that the optimisation cannot be made in intervals smaller than the cycle has certain disadvantages which are discussed later on.
31 will eventually include the upstream intersection signal decisions on the prediction process, like in the case of PREDICT algorithm. This has certain implications that are discussed below.
The upstream signal decisions will eventually affect the time that each vehicle will arrive at the downstream stop line. More specifically, they will affect the queue length on the upstream intersection, the vehicle waiting time to receive green and the vehicle outputs continuing to the downstream intersection. Therefore when using an arrival flow profile to optimise traffic signals, the new optimised plan will alter the initial traffic predictions at the downstream locations. In this way the problem needs to be solved dynamically, resulting thus at more complicated and computational costly algorithms. Furthermore, the development of such algorithms is not an easy process. Apart from building a good traffic model, the algorithm should be extensively tested and calibrated to produce reliable estimates which eventually agree with the measured values. On the other hand, an attempt to develop a vehicle projection method which is not very sophisticated might not provide better results than a simpler and robust use of traffic data from past time periods.
Concerning reactive strategies, a disadvantage is that they make decisions concerning the next cycle and implement these decisions without re-evaluating them during the implementation period. The decision interval equal to the cycle means that if the initial decision proves to be sub-optimal (i.e. due to imperfectness of the flow prediction), the strategy cannot react before the next cycle. Secondly, if predictions concerning the vehicle arrivals are made, these will be based on the sum of arrivals (detector actuations) in the past, therefore an average flow is obtained. However, despite the fact that this might be a quite good approximation, it does not provide any information on the arrival procedure (seed) during the optimisation period. Finally, using traffic data from previous time periods to optimise for the next time period means that the reaction of the strategy in sudden flow changes might not be quick enough. This disadvantage can be mitigated though, with more frequent updates of the traffic estimate (based i.e. on a rolling horizon with a small time step), so as to adopt to the changing traffic conditions more quickly.
Despite the shortcomings mentioned above, reactive approaches are simpler in their development and need less input data compared to pro-active. Furthermore, they are less sensitive to errors and to hardware failures (as less detectors are required). However, they will not provide the traffic predictions with the same resolution of more integrated models.
2.4.4 Discussion
Two issues are important when making traffic predictions: The first is the length of the future horizon for which the predictions will be made. The length of the prediction horizon defines the ability of the strategy to optimise signal decisions. If the horizon is short (i.e. a few seconds) then the strategy can only make decisions concerning the extension of the pre-mature termination of a stage and cannot plan stage sequences rationally for a longer period. However, if the horizon is long, the predictions unavoidably become less reliable.
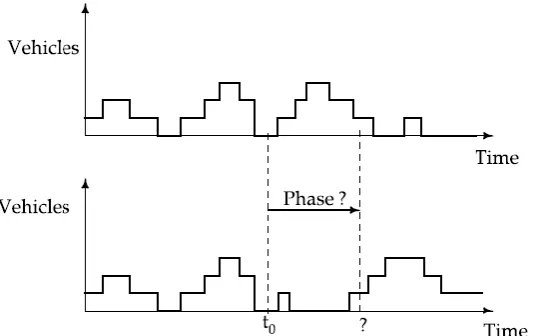
32 signal timing optimisation problem given two possible predictions of traffic flow for a future time horizon, as depicted in Figure 1. Each arrival pattern represents the number of vehicles to arrive at the next intersection for a given time interval. Both arrival patterns are identical until time t0 when the signal control algorithm has to optimise signal timings for the next period. In the first case, the demand occurs immediately following t0 whereas in the latter case the demand is zero immediately after t0 and rises after a some time. In both cases, the total demand over the horizon is equal, however the optimal signal timings between the two cases might well be different.
Figure 1 Graphical representation of two possible future vehicle arrivals (Source: Mirchandani and Head, 2001)
Obviously the arrival profile for a specific location is dependent on the signal decision of the upstream intersection. In sufficiently dense traffic conditions in the upstream intersection, the departures (arrivals towards the location of interest) will be equal to the saturation flow when the signal is green and zero otherwise. A simplifying approach would be to consider the average of the arrival flow for the whole time horizon, instead of taking into account the flow oscillations occurring from the upstream signal decisions. Such a model describes a continuous (uninterrupted) average outflow from each network link (as long as there is sufficient demand upstream and sufficient space downstream). The consequences of this simplification is the price to pay for avoiding the explicit modeling of intra-cycle red-green switches which would render the resulting optimisation problem discrete (combinatorial) and would lead to exponential increase of computational complexity for its exact solution as in several previous works (Aboudolas et. al., 2009).
33 considered that the lack of sufficient theoretical knowledge is a major obstacle for their development within the available time.
However, reliable traffic estimates can be obtained without necessarily adopting the above methods. It should be born in mind that, eventually, the traffic estimates needed depend on the signal optimisation algorithm. An efficient hybrid approach, developed in this thesis is described in chapter 4, where data from upstream detectors on the same link are used for making accurate arrival projections for a short horizon and estimate more crude arrival values for a long horizon. This method, implemented on a rolling horizon, proved to be promising for providing good traffic estimates to the optimisation modules.
2.5 Signal optimisation methods
2.5.1 General
This section presents a number of methods employed by various signal control strategies for the estimation of the optimal signal timings. These methods/algorithms are the core of each strategy therefore, their properties eventually define the effectiveness of each strategy and its applicability to a specific network. A discussion of the potential of using each algorithm for the strategy of this Thesis is also attempted.
The role of the optimisation algorithm as a part of the vehicle actuated signal control strategy is very specific. It estimates (or evaluates alternative) signal timings, aiming to minimise a performance index, for given traffic flow, arrival profile, time horizon, upstream signal decision and initial intersection conditions. In controlled networks with more than one intersection, it is evident that the objective of finding the optimal signal plans for a given intersection is dependent on the signal plans of the upstream intersections.
The formulation of the real-time optimised signal control problem is significantly different between various strategies, basically depending on their nature (reactive – pro-active). The following sections present various approaches towards estimating the optimal signal timings, based, each time, on their own problem formulation.
2.5.2 Heuristic (rule-based) techniques
Heuristic (or rule-based) techniques are commonly used