http://www.scirp.org/journal/msa ISSN Online: 2153-1188 ISSN Print: 2153-117X
DOI: 10.4236/msa.2017.812067 Nov. 27, 2017 918 Materials Sciences and Applications
Molecular Dynamics Simulation of Grain
Refinement in a Polycrystalline Material under
Severe Compressive Deformation
Takuya Uehara
Department of Mechanical Systems Engineering, Yamagata University, Yonezawa, Japan
Abstract
Grain refinement in a polycrystalline material resulting from severe compres-sive deformation was simulated using molecular dynamics. A simplified mod-el with four square grains surrounded by periodic boundaries was prepared, and compressive deformation was imposed by shortening the length in the y
direction. The model first deformed elastically, and the compressive stress in-creased monotonically. Inelastic deformation was then initiated, and the stress decreased drastically. At that moment, dislocation or slip was initiated at the grain boundaries or triple junction and then spread within the grains. New grain boundaries were then generated in some of the grains, and sub-grains appeared. Finally, a microstructure with refined grains was obtained. This process was simulated using two types of grain arrangements and three dif-ferent combinations of crystal orientations. Grain refinement generally pro-ceeded in a similar fashion in each scenario, whereas the detailed inelastic de-formation and grain refinement behavior depended on the initial microstruc-ture.
Keywords
Molecular Dynamics, Polycrystalline Material, Microstructure, Grain Boundary, Grain Refinement, Severe Plastic Deformation, Computer Simulation
1. Introduction
The microstructures of metallic materials determine the mechanical properties. Thus, controlling the microstructure is important in materials processing. Heat treatments such as annealing, quenching, and tempering have long been used for
How to cite this paper: Uehara, T. (2017) Molecular Dynamics Simulation of Grain Refinement in a Polycrystalline Material under Severe Compressive Deformation. Materials Sciences and Applications, 8, 918-932.
https://doi.org/10.4236/msa.2017.812067 Received: October 19, 2017
Accepted: November 24, 2017 Published: November 27, 2017 Copyright © 2017 by author and Scientific Research Publishing Inc. This work is licensed under the Creative Commons Attribution International License (CC BY 4.0).
http://creativecommons.org/licenses/by/4.0/
DOI: 10.4236/msa.2017.812067 919 Materials Sciences and Applications
this purpose, and various advanced techniques have been developed. These processes result in phase transformation along with grain refinement or coar-sening, allowing both the phase and grain size to be controlled. However, since heat treatment requires large equipment and significant energy inputs, alterna-tive methods are desired. One such alternaalterna-tive is mechanical processing, and various mechanical processing methods have been developed [1][2], including equal-channel angular pressing [3][4], accumulative roll bonding [5] [6], and asymmetric rolling [7]. In all these processes, the material is subjected to severe plastic deformation (SPD), and the microstructure is crushed by compressive load. Consequently, small crystal grains with sizes on the order of sub-microns or nanometers are obtained, generally resulting in remarkable improvements in material strength. However, the mechanism underlying the change in micro-structure is very complicated, and the optimal conditions for microstructural control have only been empirically explored.
To clarify the mechanism of grain refinement and develop more effective re-finement processes, many types of investigations have been conducted. For ex-ample, electron backscatter diffraction (EBSD) method can be used to study the polycrystalline microstructure [8][9]. However, in situ observation of dynamic behavior remains difficult, and computer simulation is indispensable for this purpose. Molecular dynamics (MD), which treats the motions of all individual atoms in the system considered, can effectively capture temporal changes in mi-crostructure. To date, MD simulations have been used to clarify the fundamental mechanism of plastic deformation, including the generation and motion of dis-locations, grain-boundary migration, changes in crystal orientation, and their relationships and interactions [10]-[11]. The author has also used MD simula-tions to investigate the atomistic mechanisms of phase transformation and plas-tic deformation. For example, an MD study of grain boundary stability revealed that the grain shapes change to reach a stable structure [16]. In a model of a po-lycrystalline shape-memory alloy, deformation was found to occur individually in every grain [17]. Transformation-induced plasticity was also simulated, and the dependence of strain on applied load was discussed [18]. Following these simulations, this study focuses on changes in microstructure resulting from se-vere deformation. Prior to this study, we reported on changes in microstructure under tensile load, during which grain-boundary migration and changes in grain shape were observed [19]. To study a more practical scenario for engineering applications, we evaluate severe compression in this study [20] and simulate the grain refinement process. This paper also presents a detailed investigation of the initiation of plastic deformation in a polycrystalline material.
2. Simulation Method, Model, and Conditions
2.1. Fundamental Equations
DOI: 10.4236/msa.2017.812067 920 Materials Sciences and Applications
equation:
d
1 1
,
d
ij ij
i i ij ij
j
i i ij
m m r
φ
= =
∑
= − r
r F f f
r , (1)
where, mi and ri are the mass and position vector of the i-th atom, respectively, Fi
is the force acting on the i-th atom, fij is the force acting on the i-th atom from
the j-th atom,
φ
ij is the interatomic potential between the i-th and the j-thatoms, and rij is the position vector drawn from the i-th to the j-th atoms. The
following Lennard-Jones function, which is often used for general investigation of fcc materials, is applied in this study:
(
) (
)
(
12 6)
4D R r R r
φ= − , (2)
where, D and R are energy and length parameters, respectively. This function is standardized in the non-dimensional form of
* r* 12 r* 6
φ = − − − , (3)
where φ* = φ/(4D) and r* = r/R. All other related physical quantities such as
stress and temperature are also non-dimensionalized using these standards. The values presented in this study are in the non-dimensional ones, while the asterisk notion is omitted hereafter.
2.2. Simulation Model
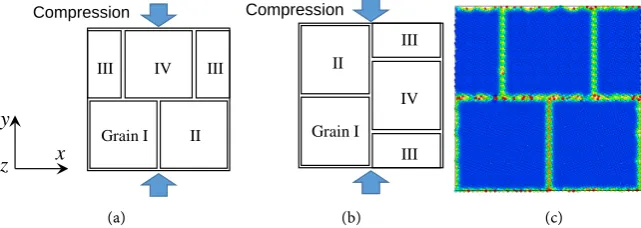
The simulation model is illustrated in Figure 1. The calculation model is divided into four domains and arranged in two different ways (Types A and B), as shown in Figure 1(a) and Figure 1(b). Compression is imposed along the y axis, and Types A and B differ based on whether the straight grain boundary traversing the model is perpendicular (Type A) or parallel (Type B) to the loading direc-tion. The model is three-dimensional in x-y-z space, and periodic boundary conditions are applied in all directions. The atoms are set on the fcc lattice points so that the (001) plane is on the x-y plane, and the [100] direction is along the x axis. The atoms are then rotated around the z axis, and the rotation angles are provided to the four grains individually. Consequently, grain boundaries are created as the misfit of the crystal arrangement at the domain boundaries. Note that all grain boundaries are perpendicular to the x-y plane, and no
[image:3.595.213.534.588.702.2](a) (b) (c)
Figure 1. Illustration of the simulation model: (a) Type A; (b) Type B; (c) MD model.
x z y
Compression
Grain I II
III IV III
Grain I II
III
IV
DOI: 10.4236/msa.2017.812067 921 Materials Sciences and Applications
boundaries parallel to the x-y plane are considered; i.e. all grains correspond to infinitely long columnar grains because of the periodic boundary in the z direc-tion. Figure 1(c) shows a sample of the atomic arrangement colored based on potential energy; the grain boundaries in Figure 1(c) are depicted by green or red atoms.
Compression is imposed by shortening the length in the y direction (Ly) at a
constant rate. At the same time, the stress components σxx and σzz are kept equal
to zero by adjusting the lengths in the x and z directions (Lx and Lz, respectively).
Shear deformation is not considered, and the model retains its rectangular pa-rallelepiped form.
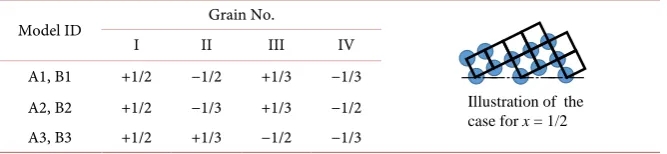
The model size is set as 50 × 50 × 5 fcc unit cells in the x, y, and z directions, respectively. Some atoms were added or removed around the grain boundary area when constructing the initial polycrystalline arrangement. The rotation an-gles of Grain k (k = I, II, III or IV), θk, are set as shown in Table 1. In Table 1,
the letters in the “Model ID” column represent the grain arrangement (Type A or B), and the number identifies the combination of the rotation angles of the four grains. The angles are selected so that the structure of the grain boundary is regularly ordered. For example, an illustration for the case of θ = tan−1(1/2) is
shown in the insert image in Table 1. Consequently, some of the boundaries in the model become coincident site lattice (CSL) boundaries. In Models A1 and B1, for example, the grain boundaries between Grains I and II and between Grains III and IV are typical CSL boundaries indicated by the low-index sigma values.
2.3. Simulation Conditions
The initially provided atomic positions are not stable sites, especially around the grain boundaries. Therefore, the configuration is relaxed for 15,000 timesteps under a stress-free condition while keeping temperature constant at T = 0.05 in non-dimensional value. Compressive load is then imposed in the y direction by decreasing the edge length Ly at a constant rate of ΔLy/τs, meaning that the total
decrease in length (ΔLy) is imposed in the compression period (τs, in timesteps).
In this study, the values are set as ΔLy = 25.0 and τs = 50,000. The length before
compression, 0 y
[image:4.595.208.542.634.711.2]L , is approximately 73.0, although differs slightly for each model. Hence the total compressive strain is approximately 0.34. In the practical SPD processes, the stress state is more complicated including shear, and the order of applied strain reaches 1 by repeating the unit process for several times. In this
Table 1. Rotation angles in Grains I to IV.
Model ID Grain No.
I II III IV A1, B1 +1/2 −1/2 +1/3 −1/3 A2, B2 +1/2 −1/3 +1/3 −1/2 A3, B3 +1/2 +1/3 −1/2 −1/3
*values represent x of θ = tan−1x.
DOI: 10.4236/msa.2017.812067 922 Materials Sciences and Applications
paper, a single process with uniaxial compression is assumed for modeling the fundamental process. Temperature is kept constant at T = 0.05 using veloci-ty-scaling method. Following the compression period, the model is unloaded by releasing the length restriction in the y-direction, and the calculation is contin-ued for 5000 more timesteps.
3. Simulation Results for Model A1
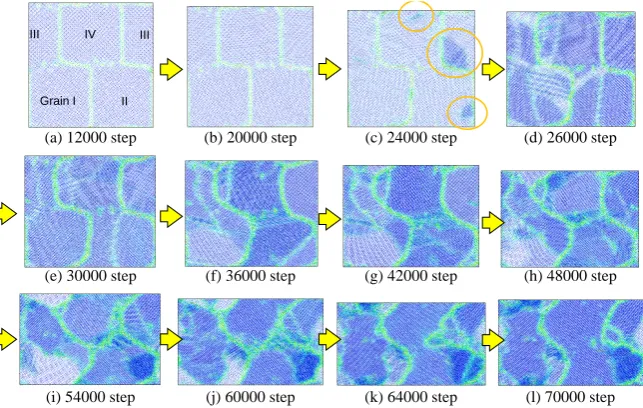
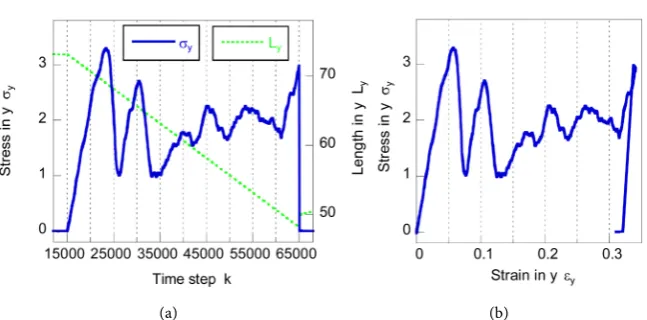
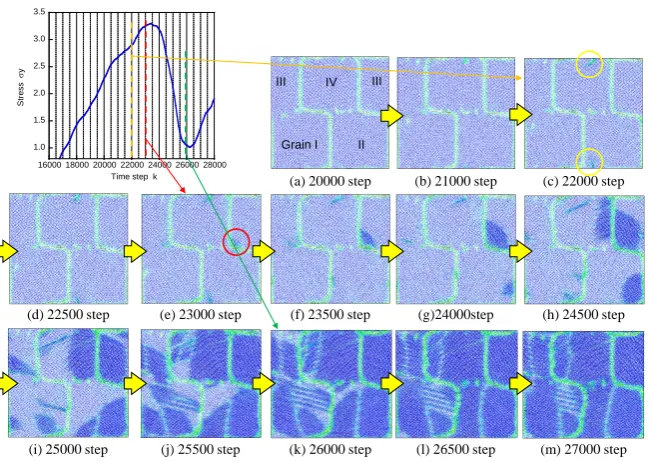
Figure 2 shows the variation in the configuration of atoms. Each image in Fig-ure 2 is a snapshot of atoms projected onto the x-y plane, and the color indicates the potential energy of each atom. The atoms in blue possess low energy, while those in green, yellow, and red have higher energy. Consequently, the atoms in-side the crystal grains are colored in blue, and those on the grain boundaries are depicted in green. Figure 3(a) and Figure 3(b) show the variation in compres-sive stress in the loading direction and the stress-strain curve, respectively. The stress variation in Figure 3(a) is divided into four stages: Stage I, initial relaxa-tion and monotonic increase; Stage II, stress peak and drastic decrease; Stage III, repeating gradual increases and sudden decreases; and Stage IV, unloading. The results in each stage are detailed in the following sections.
3.1. Stage I—Elastic Deformation
[image:5.595.213.535.499.703.2]The atomic configuration is initially relaxed under a stress-free condition. As shown in Figure 2(a), the shapes and sizes of the crystal grains are almost maintained, although the grains change slightly in shape from perfect square to slightly rounded squares as a result of the blunting of the angles at triple junc-tions. We can also see that every grain boundary has a different structure; con-tinuous straight boundaries are observed between Grains I/II, III/IV, I/IV, and II/III, whereas discrete boundaries are found between Grains I/III and II/IV.
Figure 2. Variation in microstructure under compression for Model A1.
(a) 12000 step (b) 20000 step (c) 24000 step (d) 26000 step
(f) 36000 step (h) 48000 step
(i) 54000 step (j) 60000 step
(e) 30000 step (g) 42000 step
(k) 64000 step (l) 70000 step
Grain I II IV
DOI: 10.4236/msa.2017.812067 923 Materials Sciences and Applications
[image:6.595.211.535.65.225.2](a) (b)
Figure 3. Variation of compressive stress (a) and stress-strain curve (b) for Model A1.
An external compressive load is imposed starting at the 15,000th timestep. The length in the y direction decreases, but the atomic configuration is not af-fected (Figure 2(b)). Since the compressive stress increases monotonically (Figure 3(b)), deformation in this stage is regarded as elastic deformation.
3.2. Stage II—Yielding
At the 24000th timestep, three regions indicated by different color densities, marked by circles in Figure 2(c), are generated. The color is still the same, indi-cating that the energy has not changed at this moment. Therefore, the atoms are considered to retain regularity in the local arrangement. The difference in ap-pearance is attributed to the change in orientation. The original grains are all arranged so that the (001) plane is on the x-y plane, and the atoms on multiple layers in the z direction overlap completely. Consequently, the snapshot appears to have discrete dots with large intervals. When the orientation of the crystals (i.e., the [001] direction) is dislocated from the z axis, all atoms on the accumu-lated layers do not overlap and are individually depicted in the snapshots. Therefore, a change in orientation is considered to have occurred in the dense blue region of Figure 2(c). Hereafter, we refer to such a region as the deforma-tion region. All the deformadeforma-tion regions are generated at grain boundaries; one is at the triple junction, and the others are on the grain boundaries.
DOI: 10.4236/msa.2017.812067 924 Materials Sciences and Applications
Figure 4. Detailed variation in microstructure around the first stress peak for Model A1.
timestep, another initiation is observed at the left-bottom corner of Grain III (marked with a red circle), and the stress stops increasing at this moment. This deformation region spreads quickly, as shown in Figure 4(e) to Figure 4(h), and the stress begins to decrease. Deformation regions originated from other points are also activated and extend to the entire domain by the 26,000th timestep, and the stress value is minimized at this point.
In the above process, two types of deformation regions are observed: linear deformation regions like those marked with yellow circles in Figure 4(c); and planar regions like the one marked with the red circle in Figure 4(e). These de-formation modes correspond to dislocation and slip, respectively. Since the pe-riodic boundary condition in the depth (z) direction may affect the behavior, more detailed discussion is reserved for future work.
3.3. Stage III—Plastic Deformation and Grain Refinement
At the completion of the extension of the deformation region at the 26,000th timestep, some defects or mismatches in crystal orientation have been intro-duced. For instance, in Grain II, a vertical grain boundary is generated, as shown in Figure 2(d). In other grains, as well as similar new boundaries, transversal oblique lines are observed. These misalignments in crystal structure caused by abrupt deformation are relieved by the 30,000th timestep (Figure 2(e)). In this time duration, the stress value again increases and reaches the second peak value followed by a drastic decrease. The snapshot after the second peak at the 36000th timestep (Figure 2(f)) shows significantly distorted grain shapes. In particular, the original vertical grain boundaries between Grains I/II and III/IV are conti-nuously curved and become S-shaped, as shown in Figure 2(g). In addition, several new boundaries and defects are generated in all grains. In the stress
1.0 1.5 2.0 2.5 3.0 3.5
16000 18000 20000 22000 24000 26000 28000
St
re
ss
σ
y
Time step k
(a) 20000 step (b) 21000 step (c) 22000 step
(d) 22500 step (e) 23000 step (f) 23500 step (g)24000step (h) 24500 step
(i) 25000 step (j) 25500 step (k) 26000 step (l) 26500 step (m) 27000 step
Grain I II IV
DOI: 10.4236/msa.2017.812067 925 Materials Sciences and Applications
curve, no notable peak like the first and second peaks is observed; instead, a gradual increase with intermittent increases and decreases is found. Finally, the model is divided into many fine grains consisting of various sizes and shapes of grains, as shown in Figure 2(k).
3.4. Stage IV—Unloading
The addition of compressive load stops at the 65,000th timestep, and the stress in the y direction is released to zero. The edge length in the y direction is then slightly extended. This recovery is slight, and a permanent strain of approx-imately 0.31 is retained (Figure 3(b)). Comparing the snapshots in Figure 2(k)
and Figure 2(l), the microstructure does not change in this process; hence, the unloading behavior reveals to be elastic. Finally, a refined grain distribution is obtained. As a conclusion, the changes in microstructure resulting from severe compressive deformation are properly simulated.
4. Simulation Results for Other Models
4.1. Model A2
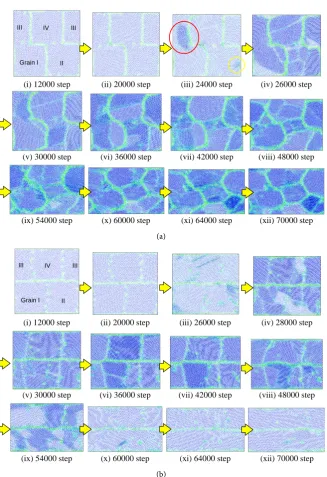
Simulations for other models are conducted under the same conditions. Figure 5(a) shows the variation in the microstructure of Model A2. As for Model A1, the initial configuration is maintained except for slight relaxation at the grain boundaries, and the model deforms elastically before the 20,000th timestep. In-elastic deformation is then initiated, and at the 24,000th timestep, as shown in
DOI: 10.4236/msa.2017.812067 926 Materials Sciences and Applications
(a)
[image:9.595.211.539.61.539.2](b)
Figure 5. Variation in microstructure under compression for Models A2 and A3: (a) Model A2; (b) Model A3.
4.2. Model A3
Figure 5(b) shows the variation in atomic configuration for Model A3. The characteristics in the initial grain boundaries are different from above presented Models A1 and A2; the horizontal grain boundaries between Grains I/III, I/IV, II/III, and II/IV are continuous and form straight lines, while the vertical boun-daries are discrete. The elastic deformation behavior is, nevertheless, similar to that observed in the other models, both in atomic arrangement and stress evolu-tion. However, a different feature is found around the first peak in stress (blue curve in Figure 6(b)). In Model A3, a short step on the increasing curve is seen
(i) 12000 step (ii) 20000 step (iii) 24000 step (iv) 26000 step
(vi) 36000 step (viii) 48000 step
(ix) 54000 step (x) 60000 step
(v) 30000 step (vii) 42000 step
(xi) 64000 step (xii) 70000 step
Grain I II IV
III III
(i) 12000 step (ii) 20000 step (iii) 26000 step (iv) 28000 step
(vi) 36000 step (viii) 48000 step
(ix) 54000 step (x) 60000 step
(v) 30000 step (vii) 42000 step
(xi) 64000 step (xii) 70000 step
Grain I II IV
DOI: 10.4236/msa.2017.812067 927 Materials Sciences and Applications
[image:10.595.212.535.64.228.2](a) (b)
Figure 6. Stress-strain curves (a) and the magnified view around the first and second peaks (b) for Models A1-A3.
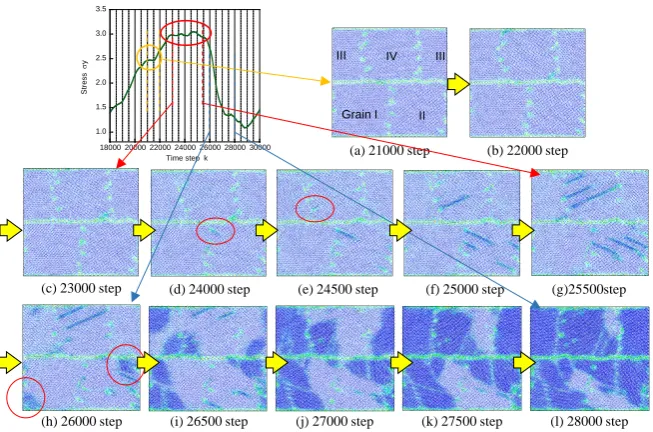
at the 18,000th timestep, whereas no specific change in atomic configuration is observed at this moment, as shown in the snapshot at the 20,000th timestep (Figure 5(b)(ii)). A similar short step appears at the 20,000th timestep, and the stress then reaches the peak at the 23,000th timestep. Unlike in the other models, the stress does not begin to decrease instantly after the peak; instead, it remains high for approximately 3000 timesteps.
The variation in atomic configuration during this stress plateau is shown in
Figure 7. No defects appear before the 23,000th timestep. A small source of li-near defect is generated at the 24,000th timestep (red circle in Figure 7(d)). This defect spreads straightly toward the right-bottom direction in Grain II and reaches the opposite grain boundary by the 25,500th timestep. The generation of defects at grain boundaries occurs successively, and the defects spread in the grains to form straight linear defects. Although the lines are all parallel in the grains, the direction is different for every grain; thus, they are assumed to be dislocations. This behavior continues until the 25,500th timestep, which corres-ponds to the end of the plateau in the stress curve.
Subsequently, the stress decreases drastically at the 26,000th timestep. At this moment, a planar deformation region is generated (Figure 7(h)) and then spreads in the grain. Nearly the entire region is occupied by the deformed region by the 28,000th timestep, corresponding to the end of decrease in the stress curve. This behavior is similar to the behavior observed in Models A1 and A2 during the stress decrease after the first peak.
The second peak in stress for Model A3 is not remarkable compared to those in Models A1 and A2. Instead, obvious peaks and decreases in stress are re-peated. The horizontal grain boundary traversing the model is quite stable and immobile. The vertical grain boundaries also become clear and remain straight after the first drop in stress, as shown in Figure 5(b)(v). Consequently, defor-mation region is not generated continuously but as isolated events. In addition, the newly generated grain boundaries are rather ambiguous, and most of them disappear. As a result, the grains are not clearly distinguished at the final stage
0 1 2 3 4
0 0.05 0.1 0.15 0.2 0.25 0.3
A1 A2 A3 S tr e ss in y σ y
Strain in y ε
y 0 1 2 3 4
15000 20000 25000 30000 35000
A1 A2 A3 S tr e s s i n y σ y
DOI: 10.4236/msa.2017.812067 928 Materials Sciences and Applications
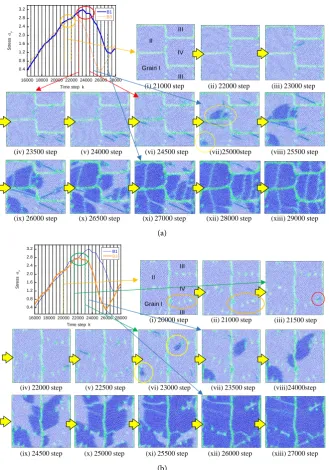
Figure 7. Detailed variation in microstructure around the first stress peak for Model A3.
with the exception of the horizontal clear boundary. The crystallographic rela-tionship among grains and grain boundaries relative to the loading direction might have caused the specific behavior observed in this model.
4.3. Models B1-B3
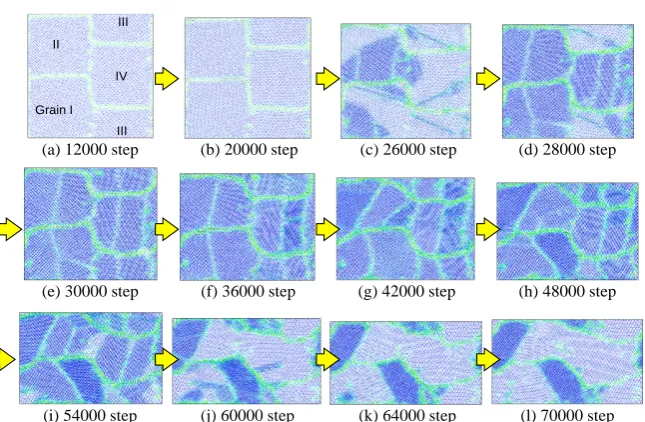
Figure 8 shows the variation in microstructure for Model B1. The stress−strain curves for Models B1, B2, and B3 along with the curve for A1 for comparison are shown in Figure 9. The change in microstructure is similar to that observed for Model A1, while the grain size at the 48,000th timestep is even smaller than that for Model A1. In Model B1, the stress level after the first peak in stress is lower on average than in Model A1, as shown in Figure 9(a). Therefore, the resistance for the applied load is weaker in Model B1, resulting in finer grains. Note that the different color densities in Figures 8(j)-(l) indicate differences in crystal orientation in the depth (z) direction (as explained in Section 3.2), and are insig-nificant here. A comparison of Models B1−B3 indicates that the first peak-stress value is relatively low for Model B3, as shown in Figure 9(b). Therefore, the variations in atomic configuration around the first stress peak for Models B1 and B3 are compared in Figure 10.
As shown in Figure 10(a)(i), the horizontal grain boundaries in Model B1 are continuous, whereas the vertical boundaries between Grains I/III and II/IV are discrete. The gradient in the stress curve is somewhat dulled before the peak, al-though no corresponding change is observed in atomic configuration. A linear defect appears at the 23,000th timestep but soon disappears. The stress then reaches the peak at the 23,500th timestep. At this moment, multiple linear de-fects are generated in Grain III, as shown in Figure 10(a)(iv). Several defects are continuously generated in other grains by the 24,500th timestep, while the stress value remains high approximately at the peak value in this duration. Planar
1.0 1.5 2.0 2.5 3.0 3.5
18000 20000 22000 24000 26000 28000 30000
St
re
ss
σ
y
Time step k (a) 21000 step (b) 22000 step
(c) 23000 step (d) 24000 step (f) 25000 step
(h) 26000 step
(e) 24500 step (g)25500step
(i) 26500 step (j) 27000 step (k) 27500 step (l) 28000 step
Grain I II IV
DOI: 10.4236/msa.2017.812067 929 Materials Sciences and Applications
Figure 8. Variation in microstructure under compression for Model B1.
(a) (b)
Figure 9. Stress-strain curves (a) and the magnified view around the first peak (b) for Models B1-B3.
defects are then generated at the 25,000th timestep (marked by circles), and the stress begins to decrease at this moment. Subsequently, the deformation regions spread to the entire domain by the 27,000th timestep, when the drop in stress is completed.
In Model B3, as shown in Figure 10(b)(i), the vertical straight grain bounda-ries are continuous, whereas the horizontal boundabounda-ries are all discrete. The grain boundary between Grains III/IV (marked with an oval) moves slightly by the 21,000th timestep, at which point the stress is still increasing monotonically be-fore reaching the peak value. At the 21,500th timestep, a linear defect is gener-ated from one of the defects on the grain boundary, as indicgener-ated by the red circle in Figure 10(b)(iii). The generation of this first defect occurs earlier than in Model B1. After this point, the deformation behavior is similar to those observed in the other models; multiple linear defects are generated and extended during
(a) 12000 step (b) 20000 step (c) 26000 step (d) 28000 step
(f) 36000 step (h) 48000 step
(i) 54000 step (j) 60000 step
(e) 30000 step (g) 42000 step
(k) 64000 step (l) 70000 step
Grain I II
IV
III III
0 1 2 3 4
0 0.05 0.1 0.15 0.2 0.25 0.3
B1
B2
B3
A1
S
tr
e
ss
in
y
σ y
Strain in y ε
y
0 1 2 3 4
15000 20000 25000 30000
B1
B2
B3
A1
S
tr
e
s
s i
n
y
σ y
DOI: 10.4236/msa.2017.812067 930 Materials Sciences and Applications
(a)
[image:13.595.210.540.67.538.2](b)
Figure 10. Detailed variation in microstructure around the first stress peak for Models B1 and B3: (a) Model B1; (b) Model B3.
the stress plateau followed by the spread of planar deformation regions with a drastic decrease in stress. Therefore, the difference in peak stress is attributed to the structures of the grain boundaries: when one of the grain boundaries is easy to become a source of the linear defect or dislocation, the model is easy to yield and the peak value in stress becomes lower.
5. Conclusions
Microstructural changes of a polycrystalline material as a result of severe com-pressive deformation were simulated using molecular dynamics method. A
sim-0.4 0.8 1.2 1.6 2.0 2.4 2.8 3.2
16000 18000 20000 22000 24000 26000 28000 B1
B3
S
tr
e
ss
σy
Time step k (i) 21000 step (ii) 22000 step (iii) 23000 step
(iv) 23500 step (v) 24000 step (vi) 24500 step (vii)25000step (viii) 25500 step
(ix) 26000 step (x) 26500 step (xi) 27000 step (xii) 28000 step (xiii) 29000 step
Grain I II
IV
III III
0.4 0.8 1.2 1.6 2.0 2.4 2.8 3.2
16000 18000 20000 22000 24000 26000 28000 B1
B3
S
tr
e
ss
σy
Time step k (i) 20000 step (ii) 21000 step
(iv) 22000 step (v) 22500 step (vii) 23500 step
(ix) 24500 step
(vi) 23000 step (viii)24000step
(x) 25000 step (xi) 25500 step (xii) 26000 step (xiii) 27000 step
Grain I II
IV
III III
DOI: 10.4236/msa.2017.812067 931 Materials Sciences and Applications
plified model consisting of four grains fulfilling the periodic boundary condition was prepared. Two types of grain arrangements and three combinations of crys-tal orientations were applied. The results obtained are summarized as follows. Following elastic deformation, yielding occurs in some of the grains. The source of the yielding is linear defects initiated at grain boundaries and planar deforma-tion regions which are often generated at triple juncdeforma-tions. When the linear de-fects or dislocations are generated, the stress stops increasing and tends to re-main constant, even as the number of dislocations increases. When a planar de-formation defect or slip occurs, the stress decreases drastically until the defor-mation region extends to the entire model. New boundaries dividing the original grains into two or more grains then appear, and a refined microstructure con-taining various grain sizes is obtained. The first peak stress depends on the grain arrangement and crystal orientation relative to the loading direction, for which grain boundary structure is considered to be dominative.
The following points remain unclarified: the detailed relationship between the initial microstructure and yield stress; the effect of grain boundary structure on defect generation; the relationships between the initial microstructure and the characteristics of refined grains (size, shape, and distribution); and the change in material properties resulting from the grain refinement. These points will be in-vestigated in future works using the present model, which was validated in this study. The model and method will be applicable to more practical problems for various materials including alloys and composites by using appropriate potential function. Comparison with the experimental results will also become available by accomplishing fully three-dimensional modeling.
References
[1] Sabirov, I., Murashkin, M.Y. and Valiev, R.Z. (2013) Nanostructured Aluminum Alloys Produced by Severe Plastic Deformation: New Horizons in Development.
Materials Science and Engineering A, 560, 1-24.
https://doi.org/10.1016/j.msea.2012.09.020
[2] Huang, Y. and Langdon, T.G. (2014) Advances in Ultrafine-Grained Materials. Ma-terials Today, 16, 85-93.https://doi.org/10.1016/j.mattod.2013.03.004
[3] Segal, V.M. (1999) Equal Channel Angular Extrusion: From Macromechanics to Structure Formation. Materials Science and Engineering A, 271, 322-333.
https://doi.org/10.1016/S0921-5093(99)00248-8
[4] Beyerlein, I.J. and Toth, L.S. (2009) Texture Evolution in Equal-Channel Angular Extrusion. Progress in Materials Science, 54, 427-510.
https://doi.org/10.1016/j.pmatsci.2009.01.001
[5] Saito, Y., Utsunomiya, H., Tsuji, N. and Sakai, T. (1999) Novel Ultra-High Straining Process for Bulk Materials—Development of the Accumulative Roll-bonding (ARB) Process. Acta Materialia, 47, 579-583.
https://doi.org/10.1016/S1359-6454(98)00365-6
[6] Kamikawa, N. and Furuhara, T. (2013) Accumulative Channel-Die Bonding (ACCB): A New Severe Plastic Deformation Process to Produce Bulk Nanostruc-tured Metals. Journal of Materials Processing Technology, 213, 1412-1418.
DOI: 10.4236/msa.2017.812067 932 Materials Sciences and Applications [7] Sidor, J., Miroux, A., Petrov, R. and Kestens, L. (2008) Microstructural and Crystal-loGraphic Aspects of Conventional and Asymmetric Rolling Processes. Acta Mate-rialia, 56, 2495-2507.https://doi.org/10.1016/j.actamat.2008.01.042
[8] Rehrl, C., Kleber, S., Renk, O., and Pippan, R. (2012) Effect of Grain Size in Com-pression Deformation on the Microstructural Evolution of an Austenitic Stainless Steel. Materials Science and Engineering A, 540, 55-62.
https://doi.org/10.1016/j.msea.2012.01.064
[9] Ghosh, P. Renk, O. and Pippan, R.R. (2017) Microtexture Analysis of Restoration Mechanisms during High Pressure Torsion of Pure Nickel. Materials Science and Engineering A, 684, 101-109.https://doi.org/10.1016/j.msea.2016.12.032
[10] Van Swygenhoven, H., Caro, A. and Farkas, D. (2001) A Molecular Dynamics Study of Polycrystalline Fcc Metals at the Nanoscale: Grain Boundary Structure and Its In-fluence on Plastic Deformation. Materials Science and Engineering A, 309-310, 440-444.https://doi.org/10.1016/S0921-5093(00)01794-9
[11] Wolf, D., Yamakov, V., Phillpot, S.R., Mukherjee, A. and Gleiter, H. (2005) Defor-mation of Nanocrystalline Materials by Molecular-Dynamics Simulation: Relation-ship to Experiments? Acta Materialia, 53, 1-40.
https://doi.org/10.1016/j.actamat.2004.08.045
[12] Trautt, Z.T. and Mishin, Y. (2012) Grain Boundary Migration and Grain Rotation Studied by Molecular Dynamics. Acta Materialia, 60, 2407-2424.
https://doi.org/10.1016/j.actamat.2012.01.008
[13] Farkas, D. (2013) Atomistic Simulations of Metallic Microstructures. Current Opi-nion in Solid State and Materials Science, 17, 284-297.
https://doi.org/10.1016/j.cossms.2013.11.002
[14] Spearot, D.E. and Sangid, M.D. (2014) Insights on Slip Transmission at Grain Boundaries from Atomistic Simulations. Current Opinion in Solid State and Mate-rials Science, 18, 188-195. https://doi.org/10.1016/j.cossms.2014.04.001
[15] Hahn, E.N. and Meyers, M.A. (2015) Grain-size Dependent Mechanical Behavior of Nanocrystalline Metals. Materials Science and Engineering A, 646, 101-134.
https://doi.org/10.1016/j.msea.2015.07.075
[16] Uehara, T., Wakabayashi, N., Hirabayashi, Y. and Ohno, N. (2008) An Atomistic Study of Grain Boundary Stability and Crystal Rearrangement Using Molecular Dynamics Techniques. International Journal of Mechanical Sciences, 50, 956-965.
https://doi.org/10.1016/j.ijmecsci.2007.09.001
[17] Uehara, T., Asai, C. and Ohno, N. (2009) Molecular Dynamics Simulation of Shape-Memory Behaviour Using a Multi-Grain Model. Modelling and Simulation in Materials Science and Engineering, 17, Article ID: 035011.
https://doi.org/10.1088/0965-0393/17/3/035011
[18] Uehara, T. (2015) Molecular Dynamics Simulation on Transformation-Induced Plastic Deformation Using a Lennard-Jones Model. Key Engineering Materials, 626, 414-419.https://doi.org/10.4028/www.scientific.net/KEM.626.414
[19] Uehara, T. (2017) Molecular Dynamics Simulation of the Variation in the Micro-structure of a Polycrystalline Material under Tensile Load. Key Engineering Mate-rials, 748, 375-380.https://doi.org/10.4028/www.scientific.net/KEM.748.375