This paper is made available online in accordance with
publisher policies. Please scroll down to view the document
itself. Please refer to the repository record for this item and our
policy information available from the repository home page for
further information.
To see the final version of this paper please visit the publisher’s website.
Access to the published version may require a subscription.
Author(s): Andrea Marshall , Douglas G Altman, Patrick Royston and
Roger L Holder
Article Title: Comparison of techniques for handling missing covariate
data within prognostic modelling studies: a simulation study
Year of publication: 2010
Link to published version:
R E S E A R C H A R T I C L E
Open Access
Comparison of techniques for handling missing
covariate data within prognostic modelling
studies: a simulation study
Andrea Marshall
1,2*, Douglas G Altman
1, Patrick Royston
3, Roger L Holder
4Abstract
Background:There is no consensus on the most appropriate approach to handle missing covariate data within
prognostic modelling studies. Therefore a simulation study was performed to assess the effects of different missing data techniques on the performance of a prognostic model.
Methods:Datasets were generated to resemble the skewed distributions seen in a motivating breast cancer example. Multivariate missing data were imposed on four covariates using four different mechanisms; missing completely at random (MCAR), missing at random (MAR), missing not at random (MNAR) and a combination of all three mechanisms. Five amounts of incomplete cases from 5% to 75% were considered. Complete case analysis (CC), single imputation (SI) and five multiple imputation (MI) techniques available within the R statistical software were investigated: a) data augmentation (DA) approach assuming a multivariate normal distribution, b) DA assuming a general location model, c) regression switching imputation, d) regression switching with predictive mean matching (MICE-PMM) and e) flexible additive imputation models. A Cox proportional hazards model was fitted and appropriate estimates for the regression coefficients and model performance measures were obtained.
Results:Performing a CC analysis produced unbiased regression estimates, but inflated standard errors, which affected the significance of the covariates in the model with 25% or more missingness. Using SI, underestimated the variability; resulting in poor coverage even with 10% missingness. Of the MI approaches, applying MICE-PMM produced, in general, the least biased estimates and better coverage for the incomplete covariates and better model performance for all mechanisms. However, this MI approach still produced biased regression coefficient estimates for the incomplete skewed continuous covariates when 50% or more cases had missing data imposed with a MCAR, MAR or combined mechanism. When the missingness depended on the incomplete covariates, i.e. MNAR, estimates were biased with more than 10% incomplete cases for all MI approaches.
Conclusion:The results from this simulation study suggest that performing MICE-PMM may be the preferred MI
approach provided that less than 50% of the cases have missing data and the missing data are not MNAR.
Background
Assessing the prognostic ability of clinical factors using a Cox proportional hazards model is often performed [1]. However, missing covariate data complicates the analysis, but often occurs [1]. A review of published prognostic studies [1] found that on average 13% of cases had incomplete data (range 0 - 60%) in 39 studies where this information could be obtained. In addition, 27% of values, on average, were missing within a single
variable (range 0 - 72%) in 55 studies [1]. Simply using the cases with complete covariate data, i.e. performing a complete case (CC) analysis, loses information and hence efficiency, and may lead to biased regression coef-ficients if the missingness is related to the outcome [2,3]. Sophisticated likelihood based techniques can explicitly handle missing covariate data in analyses of survival (time to event) data (e.g. [4-6]). However, these generally require problem-specific programs to be writ-ten and hence may not be readily available.
Imputing the missing data poses a suitable alternative that uses all the data and can be performed using easily * Correspondence: [email protected]
1
Centre for Statistics in Medicine, University of Oxford, Oxford, UK
accessible methods. Multiple imputation (MI), where each missing value is replaced with a set ofm(>1) inde-pendent values [7] to givemseparate complete datasets, incorporates uncertainty of the missing data that cannot be achieved with single imputation (m = 1). The m completed datasets are analysed individually using stan-dard statistical methods and the results combined into one summary estimate using simple rules devised by Rubin [7]. The parameter estimates of interest are aver-aged and a variance estimate is obtained that incorpo-rates both the within and between imputation variability. There are many different techniques for per-forming MI, but most approaches assume the missing data to be at least missing at random (MAR), where the probability of missingness is only associated with the observed and not the unobserved data [8]. MI approaches are generally based on an imputation model from which plausible values for the missing data are obtained. The imputation model should contain all vari-ables to be subsequently analysed, which for prognostic modelling studies includes the outcome and all potential covariates, but also any variables that help to explain the missing data [9]. The more compatible the imputation and analysis models are, the more successful the MI approach will be [10]. However, the use of MI in the published medical literature remains limited [11].
Simulation studies provide a framework to compare the performance of different approaches for handling missing data with a variety of missing data mechan-isms, as the true value is known. Several simulation studies have investigated the effects of missing data using different MI approaches, but these have primar-ily imposed missingness only on the outcome variable (e.g. [11,12]). These studies demonstrated that model based imputation approaches for an incomplete out-come variable were better than ad hoc imputation pro-cedures and were fairly robust to some model departures [13]. Furthermore, when a fully parametric imputation model correctly fitted the data, it per-formed better than alternative techniques such as pre-dictive mean matching [14]. Conversely, fully parametric methods performed worse when the impu-tation model did not fit [15]. Few simulation studies have considered missing covariate data (e.g. [3]), espe-cially situations where missingness was imposed on more than one covariate (e.g. [11,16]). Only a limited number of these studies included survival as the out-come and these have only considered a CC analysis [3] or maximum likelihood based approaches (e.g. [17,18]) and not MI techniques. There remains a lack of evi-dence about the effects of missing covariate data and its handling on the performance of the survival models and no consensus on the most appropriate MI techni-ques to use with a survival outcome.
In addition, no definitive guidelines appear to exist on the allowable proportion of missing data to validly apply MI techniques [19]. With a single incomplete covariate or outcome, Harrell [20] suggested using imputation rather than a CC analysis with 5% missingness, although Barzi and Woodward [21] suggested that a CC analysis may still be suitable with up to 10% missingness. For MAR data, MI performed well up to 25% missingness, and adequately with 50% missingness [22]. However with more than 60% missingness, the extreme levels of uncertainty about the imputed values resulted in high standard deviations and convergence problems of the imputation procedure with MI [21]. With missing not at random (MNAR) data, where the probability of missing-ness is associated with the unobserved values [8], var-iance estimates were affected when more than 5% of the data were missing [22]. All of these findings relate to an incomplete outcome or a single covariate and not to the situation with multiple incomplete covariates, where the missingness could relate to the level of an individual covariate or to the proportion of cases that have incom-plete data for at least one covariate.
This paper reports the results of an extensive simula-tion study that aimed to assess the effects of applying different standard approaches to handle missing data in more than one covariate when fitting a Cox propor-tional hazards model to the full set of covariates. This simulation study investigated how the performance of the model was affected by varying amounts of missing-ness and different missing data mechanisms. We aimed to determine the maximum allowable proportion of missingness to validly apply these missing data techniques.
Methods
Details of the simulation procedures used within this simulation study are provided below. All simulations were performed using the freely available R statistical software [23], thus allowing all researchers access to any suitable methods identified.
Generating the datasets
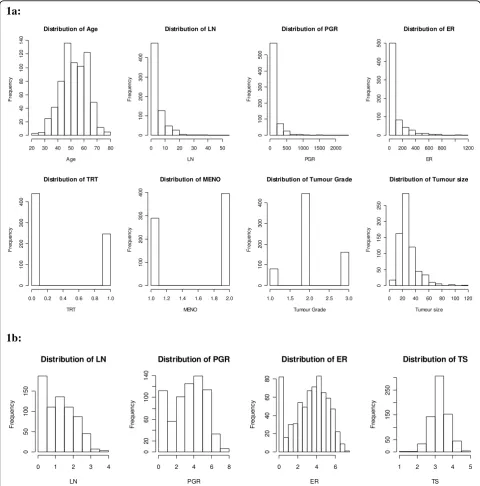
For simplicity, the covariate data were generated using an underlying multivariate normal distribution [25] with the covariate means and covariance matrix obtained from the German breast cancer study data after suitable transformations (Table 1, Figure 1b). A log transforma-tion was used for the continuous covariates X2 and X8 and a log (X + 1) transformation used for X3 and X4to avoid taking logs of zero. The generated covariate data were back transformed onto their original scales, e.g.
[image:4.595.57.538.89.576.2]using exponential transformations, prior to any analyses being performed. A cut-point of 0.5 was used to obtain the three binary covariates (X5, X6, X7) and the same cut-points as in the original data were used for the cate-gorical covariate (X8). Two dummy variables for X8 were created to indicate values of 21-30 mm or not and >30 mm or not respectively. Continuous covariates were truncated using their upper observed limits to produce realistic values and reasonable estimates for the mean
Figure 1a: Distribution of the covariates for the German breast cancer dataset; b: Distribution of the transformed continuous
and standard deviations that were not too dissimilar from the original dataset.
For each case a linear predictor was calculated as the sum of the products of the generated covariate values and the associated regression coefficient estimates obtained from fitting the full Cox proportional hazards model to the motivating dataset, such that:
LP X X X X X
X
X 0 0088 0 051 0 0023 0 00015 0 349 0 225
1 2 3 4 5
6
. . . . .
. 0 67. X70 223. X8(dum1)0 331. X8(dum2).
All continuous covariates were assumed to have a lin-ear effect on the log relative hazard. An uncensored sur-vival time was generated for each case assuming an exponential distribution with a hazard rate of 0.00027, which approximated the hazard seen in the breast can-cer dataset, and their associated linear predictor [26]. A censored time was also generated for each case using an exponential distribution with a hazard rate of 0.0002 to give approximately 35% censored observations. A smal-ler censoring rate than that seen in the breast cancer dataset ensured there were a sufficient number of events to fit a prognostic model for all levels of missingness. The required survival time was then defined for each case as the minimum of the uncensored and censored survival times and the event status determined accordingly.
A sample size of 1000 cases was used for all simula-tions, which represented the average sample size observed in a literature review of 100 reported prognos-tic factor studies [1].
Number of simulations
The whole simulation process was repeated 1000 times, which enabled the smallest regression coefficient for X4 to be estimated with at least 20% accuracy and all remaining regression coefficients estimated to within 10% accuracy of their true values [25]. The true values
were obtained from fitting a Cox proportional hazards model to the motivating breast cancer data. Independent random samples were generated using different starting seeds that were separated by at least the sample size [25].
Imposing missing data mechanisms
Missingness was imposed on four covariates: X3, X2, X5 and X8. A case was said to be incomplete if they had at least one missing covariate, but each case could have up to four covariates missing. Five overall rates of missing-ness of 5, 10, 25, 50 and 75% per case were considered to explore the effects with small, medium and large amounts of missingness. A moderately independent simulation strategy [25] was adopted, utilising the same set of 1000 datasets each time but with different values randomly deleted through using different starting seeds. This approach strengthens the comparison between dif-ferent methods as it eliminates any sampling variability leaving all methods striving for exactly the same results, whilst allowing variability to exist between simulated datasets and amounts of missingness.
Data for four incomplete covariates (performance sta-tus, albumin, grade and residual disease) from an ovar-ian cancer study [27] provided empirical evidence of realistic patterns and frequencies of missing data and associations between the missingness of each covariate. The amount of missingness imposed on each of the four covariates, X3, X2, X5 and X8 were approximately 70%, 55%, 20% and 10%, respectively, of the overall amount of cases with any missing data. Dependencies between the missingness indicators for the incomplete covariates were generated such that 35% of incomplete cases were missing both X2 and X3, 10% were missing X5 and X2, and 5% were missing X8and X3.
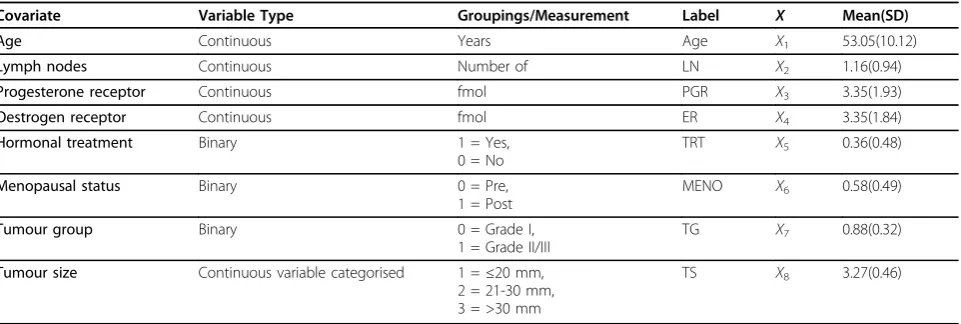
[image:5.595.59.540.110.272.2]Four multivariate missing data mechanisms were imposed, since these are the least studied mechanisms, Table 1 Data structure for the breast cancer dataset and associated means and standard deviations (SDs) after suitable transformation
Covariate Variable Type Groupings/Measurement Label X Mean(SD)
Age Continuous Years Age X1 53.05(10.12)
Lymph nodes Continuous Number of LN X2 1.16(0.94)
Progesterone receptor Continuous fmol PGR X3 3.35(1.93)
Oestrogen receptor Continuous fmol ER X4 3.35(1.84)
Hormonal treatment Binary 1 = Yes,
0 = No
TRT X5 0.36(0.48)
Menopausal status Binary 0 = Pre,
1 = Post
MENO X6 0.58(0.49)
Tumour group Binary 0 = Grade I,
1 = Grade II/III
TG X7 0.88(0.32)
Tumour size Continuous variable categorised 1 =≤20 mm, 2 = 21-30 mm, 3 = >30 mm
TS X8 3.27(0.46)
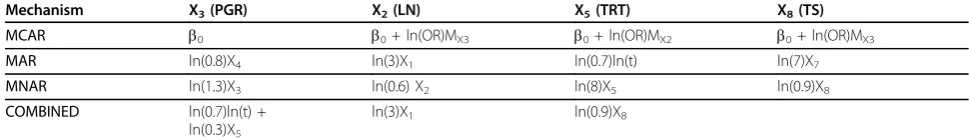
yet the most appropriate to real life situations. The mechanisms investigated were missing completely at random (MCAR), MAR, MNAR [8] for all incomplete covariates and a combined multivariate mechanism that imposed a different mechanism on each incomplete cov-ariate (Table 2). The MAR and combined mechanisms involved both covariate-dependent and outcome depen-dent mechanisms. Separate logistic regression models for each incomplete covariate were used to model the probability of the covariate being missing according to the appropriate missing data mechanism (Tables 2 and 3). A probability of missingness for each incomplete covariate was calculated for each case and compared against a random value from the Uniform [0, 1] distri-bution. The covariate value for a case was set to be missing if their uniformly distributed value did not exceed the calculated probability.
Analysis and outcomes of interest
A Cox proportional hazards model including all eight covariates was fitted to each dataset. A linear relation-ship was assumed for all continuous covariates as used in the data generation process.
The outcomes of interest were the regression coeffi-cients, associated standard errors (SE) and the signifi-cance of the covariates in the regression model. The average regression coefficient estimates over all simula-tions were assessed using the bias from the true value [12], the percentage bias and the coverage [28]. The effect of the missingness on the overall model perfor-mance was assessed using the likelihood ratio chi-square test [20], the model’s predictive ability using Nagelkerke’s R2 statistic [20], the prognostic separation D statistic [29] and the 2-year predicted survival probability.
The bias introduced from maximising the partial like-lihood estimator and not the full estimator when fitting a Cox regression model [30] in addition to any bias due to the data generation process impedes the detection of
any additional bias incurred due to the missing data and its handling. Hence the average regression coefficient estimates and associated empirical SE (i.e. the standard deviation of the estimates across simulations) from per-forming a large simulation study with no missingness involving 20,000 replications formed the true values against which the missing data simulations were compared.
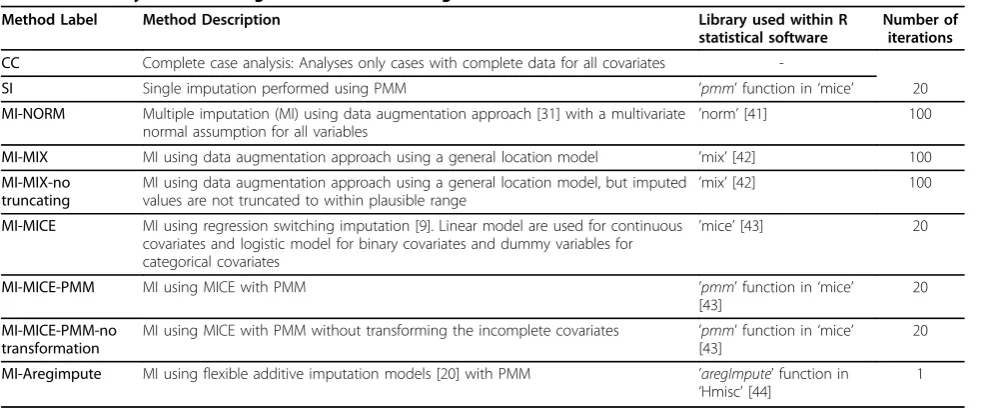
Missing data methods
A CC analysis, single imputation (SI) using predictive mean matching [9] and five MI techniques, available within the R statistical software, were investigated (Table 4). All are suitable for imputing multivariate arbi-trary missingness and are easily accessible. The MI tech-niques included two data augmentation approaches [31], one assuming a joint multivariate normal distribution (NORM) and one using a general location model (MIX); a regression switching approach (MICE) and the appli-cation of predictive mean matching after regression switching (MICE-PMM) [9]. The final MI approach (aregimpute) fitted separate flexible additive imputation models to each incomplete covariate [20].
[image:6.595.305.539.110.175.2]For all imputation approaches, the imputation model included all eight covariates in addition to the survival time and event status, indicating whether a case had the
Table 2 Specification of the missing data mechanisms to be imposed
Mechanism X3(PGR) X2(LN) X5(TRT) X8(TS)
MCAR b0 b0+ ln(OR)MX3 b0+ ln(OR)MX2 b0+ ln(OR)MX3
MAR ln(0.8)X4 ln(3)X1 ln(0.7)ln(t) ln(7)X7
MNAR ln(1.3)X3 ln(0.6) X2 ln(8)X5 ln(0.9)X8
COMBINED ln(0.7)ln(t) + ln(0.3)X5
ln(3)X1 ln(0.9)X8
Note:A logistic regression model was used to model the probability of missingness for each incomplete covariate. The entries in the table represent the variables associated with the missingness of each incomplete covariate. For MAR, MNAR, and the combined mechanism, the terms given are extra to those for the MCAR mechanism, e.g. the MAR mechanism for X2is
logit p X is missing 2 0ln OR M X3ln 3 X 1,
whereb0is the intercept, estimated by solving the above equation using the specified probabilities of missingness for X2and X3and the average covariate value
of X1, MX3is the missingness indicator for covariate X3, which equals 1 if an observation is missing and 0 if the value is observed and OR is odds ratio for the
relationship between the missingness of X2and X3, and is obtained from Table 3. The coefficients for the variable associated with the mechanism were modified
[image:6.595.54.539.573.643.2]from relationships with missing data seen in another study [27] to provide significant associations. All continuous variables including survival (t) were standardised by dividing by the standard deviation. When the mechanisms included other covariates subjected to missingness, the original complete data were used.
Table 3 Odds ratios (OR) to be specified in the missing data mechanisms given in Table 2
Mechanism OR Missingness (%)
for: for: 5 10 25 50 75
X2 MX3 101.12 45.5 15.68 5.50 2.17
X5 MX2 42.04 20.78 7.41 3.00 1.51
X8 MX3 45.14 14.23 5.44 1.92 0.92
Note:MXiis the missingness indicator for covariate Xi, which equals 1 if an
observation is missing and 0 if the value is observed.
event or was censored at the time of analysis [9]. A logarithmic transformation was used for survival time and the incomplete continuous covariates to make the assumption of normality more applicable [9]. All imputed values were rounded to plausible values, where necessary. Twenty imputations were performed for each MI approach to provide a relative efficiency of at least 96% [7] compared to having an infinite number of imputations for the five amounts of missingness to be imposed from 5% to 75%.
Combining estimates of the outcomes of interest after MI and over all simulations
Estimates of the outcomes of interest after MI were combined following proposed guidelines [32]. Rubin’s Rules [7] were used to combine each of the regression coefficient estimates, the prognostic separation D statis-tic and the predicted survival estimates after a comple-mentary log-log transformation. An overall MI p-value from the Wald test for assessing the significance of each covariate in the regression model was also determined using Rubin’s Rules [7]. An overall significance estimate for the likelihood ratio statistic was obtained using the method for combining X2 statistics [33]. The median and inter-quartile ranges of the mNagelkerke’s R2 sta-tistics [32] were calculated for each of the simulated datasets. Any deficiencies in the model performance measures and approaches for combining these estimates after MI should be similar across missing data methods and therefore still allow a valid and worthwhile compari-son. After performing all 1000 simulations, the out-comes of interest were summarised, in general using the average value over all simulations or using the median value, where appropriate.
Results
The results from performing MI using MICE, NORM and MIX were indistinguishable for all mechanisms and therefore only the results using MICE are presented. Firstly, the results from imposing a multivariate MAR mechanism are reported for all missing data methods.
Results from imposing a multivariate MAR mechanism
Regression coefficient estimates from the Cox proportional hazards model
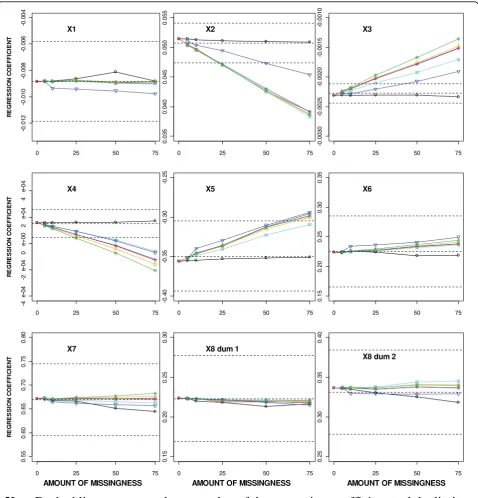
[image:7.595.56.548.97.301.2]The regression coefficient estimates obtained from per-forming different missing data methods with increasing amounts of MAR missingness are shown in Figure 2. The regression coefficient estimates after performing a CC analysis remained within the limits for unproble-matic estimates [12] of ± 0.5SE for all levels of missing-ness and were generally closer to the true value for all covariates than after using SI or MI (Figure 2). For SI and most MI approaches, the regression coefficient esti-mates were more than 0.5SE away from the true value for the two incomplete continuous covariates (X2 and X3) and X4, the covariate highly correlated with X3, when 25% or more of the cases had at least one covari-ate missing. For X2 and X3, the percentage bias exceeded the allowable 10% with 50% missingness using MICE-PMM without transformations but with only 25% missingness for all other MI approaches. The regression coefficient estimate for X4 was extremely close to zero and therefore the percentage bias was not meaningful for this covariate. The percentage bias remained within 10% for the remaining five covariates, except for X5 with 50% missingness using all MI approaches and for X1 and X6 with 75% missingness using MICE-PMM without transformations.
Table 4 Summary of the missing data methods investigated
Method Label Method Description Library used within R statistical software
Number of iterations
CC Complete case analysis: Analyses only cases with complete data for all covariates
-SI Single imputation performed using PMM ’pmm’function in‘mice’ 20
MI-NORM Multiple imputation (MI) using data augmentation approach [31] with a multivariate normal assumption for all variables
’norm’[41] 100
MI-MIX MI using data augmentation approach using a general location model ’mix’[42] 100
MI-MIX-no truncating
MI using data augmentation approach using a general location model, but imputed
values are not truncated to within plausible range ’
mix’[42] 100
MI-MICE MI using regression switching imputation [9]. Linear model are used for continuous covariates and logistic model for binary covariates and dummy variables for categorical covariates
’mice’[43] 20
MI-MICE-PMM MI using MICE with PMM ’pmm’function in‘mice’
[43]
20
MI-MICE-PMM-no transformation
MI using MICE with PMM without transforming the incomplete covariates ’pmm’function in‘mice’ [43]
20
MI-Aregimpute MI using flexible additive imputation models [20] with PMM ’aregImpute’function in
‘Hmisc’[44]
1
R E G R E SSI O N C O EF F IC IEN T
0 25 50 75
-0 .0 1 2 -0 .0 1 0 -0 .0 0 8 -0 .0 0 6 -0 .0 0 4 X1
0 25 50 75
0. 03 5 0 .0 40 0. 04 5 0 .0 50 0. 05 5 X2
0 25 50 75
-0 .0 03 0 -0. 00 25 -0 .0 02 0 -0. 00 15 -0 .0 01 0 X3 R E GR E S S ION C O E F F IC IE N T
0 25 50 75
-4 e -04 -2 e-04 0 e+ 0 0 2 e -0 4 4 e-0 4 X4
0 25 50 75
-0 .4 0 -0 .35 -0 .3 0 -0. 25 X5
0 25 50 75
0. 15 0. 20 0. 25 0. 30 0. 35 X6 R E G R ES SIO N C O E F F IC IEN T
0 25 50 75
0 .55 0. 6 0 0. 65 0. 70 0. 7 5 0. 8 0 X7
0 25 50 75
0 .15 0 .2 0 0. 25 0. 3 0
X8 dum 1
0 25 50 75
0. 2 5 0. 30 0 .3 5 0 .40
X8 dum 2
AMOUNT OF MISSINGNESS AMOUNT OF MISSINGNESS AMOUNT OF MISSINGNESS
Key
: Dashed lines represent the true value of the regression coefficient and the limits
SE
5 . 0
between which the estimate should lie for unbiased estimates [12]
CC
SI
MI Aregimpute
MI MICE
MI MICE - PMM
[image:8.595.59.538.88.587.2]MI MICE - PMM - no transformations
MI MIX - no truncating
For the highly skewed continuous covariates X2, X3 and X4, the least biased regression coefficient estimates were produced when MI was performed using MICE-PMM without transformations. In contrast, more bias was seen for the regression estimates for X1, X5, and X6 using this approach. When the imputed values were not truncated to within a plausible range (MIX-no truncat-ing), all regression coefficient estimates tended to be slightly more extreme than with all other MI approaches.
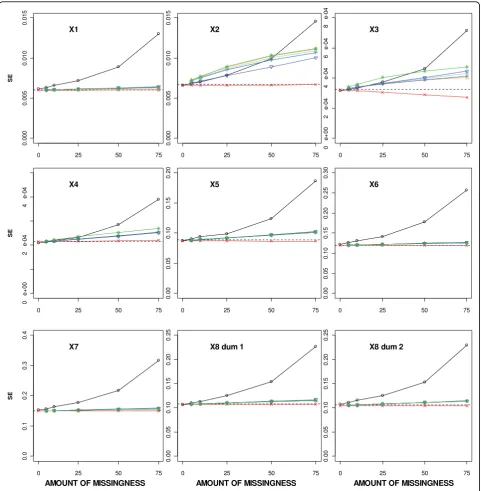
SE of the regression coefficient estimates
The average SE estimates for the incomplete covariates from all MI approaches were similar and fell between the estimates from CC analysis and those obtained after SI (Figure 3). Applying SI or MI did not affect the aver-age SE for the complete covariates, but the estimates after performing a CC analysis were considerably increased, reflecting the decrease in sample size analysed.
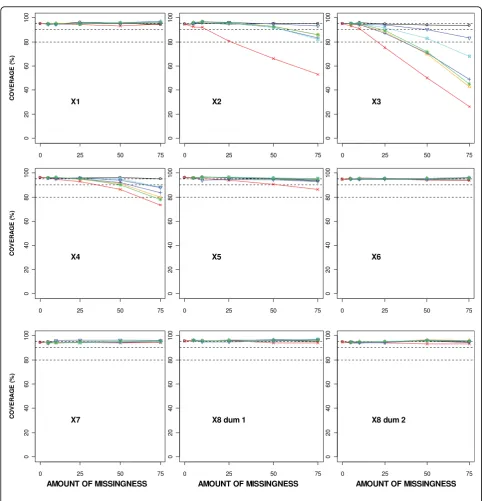
Coverage of the true value
Figure 4 shows the coverage of the regression coefficient estimates for the different missing data methods in rela-tion to an increasing percentage of MAR missingness. The coverage of the true value within the confidence limits constructed after performing a CC analysis remained around the nominal 95% level for all amounts of missingness (Figure 4). The underestimated SE with SI resulted in much shorter confidence intervals than with the other missing data methods and poorer cover-age especially for the incomplete covariates and also X4. Even with 10% missingness, the coverage for the regres-sion coefficient estimates associated with X2and X3was around 90% using SI.
The coverage using the different MI approaches remained around the nominal 95% level irrespective of the amount of missingness for all covariates except the highly skewed covariates of X2, X3 and X4 (Figure 4). The coverage for X2 and X4 fell below 90% with 75% missingness for all MI approaches, except using MICE-PMM without transformations for X2, which still had coverage of 93% with 75% missingness. The coverage for X3, the covariate with a highly skewed distribution and the most missingness imposed, fell below 90% with 50% missingness using MICE-PMM without transformations and the ’aregImpute’ function, but fell below 90% with only 25% missingness for all other MI approaches. Significance of covariates in the prognostic model
The significance of the covariates in the prognostic model after applying different missing data methods to increasing percentage of MAR missingness is displayed in Figure 5. After performing a CC analysis, all covari-ates in the model became less significant irrespective of their completeness, due to the reduction in sample size. The borderline X8 dummy variable representing group 3
(>30 mm) became non-significant at the 5% level with 25% or more missingness, and the covariates X5and X7 became non-significant with 50% or more missingness (Figure 5).
With MI and SI, none of the covariates changed their significance in the model at the 5% level (Figure 5). However, the binary covariate X5and the dummy vari-able for X8 representing group 3 (>30 mm) became bor-derline significant with increasing amounts of missingness.
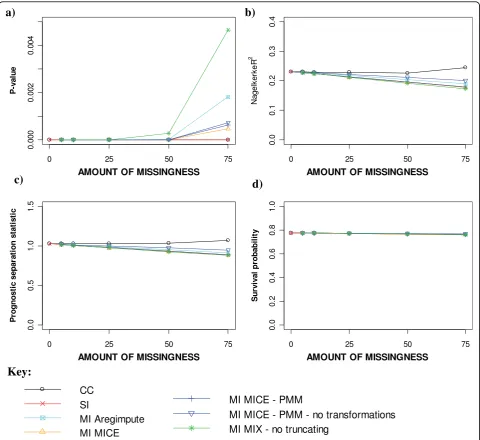
Model performance measures
Figure 6 provides the estimates of the model perfor-mance measures for the different missing data methods applied to increasing levels of MAR missingness. The likelihood ratio statistic remained highly significant for all missing data methods and levels of missingness (Fig-ure 6a). However, discrepancies appeared between the MI approaches with 50% missingness. Of the MI proce-dures, applying MICE had the least effect on the signifi-cance of the likelihood ratio statistic, whereas MIX without truncating to plausible values reduced the sig-nificance of the model the most. Estimates of both the Nagelkerke’s R2 statistic and the prognostic D statistic tended to worsen similarly for SI and all MI approaches as the amount of overall missingness increased, although slightly better R2 estimates were seen with MICE-PMM without transformation and the ’aregImpute’ function (Figure 6b and 6c). The overall predicted survival prob-abilities at 2 years were relatively unaffected by the methods used to handle the MAR data or the amount of missingness imposed (Figure 6d).
Results from imposing other missingness mechanisms
No apparent differences from the above results for a multivariate MAR mechanism were seen in the results after imposing a multivariate MCAR or combined miss-ing data mechanism. The similarity of results for the multivariate MAR mechanism and the combined mechanism may have occurred because the MNAR mechanism was imposed on the covariate with the smal-lest amount of missingness and hence this mechanism had the least effect on the overall results.
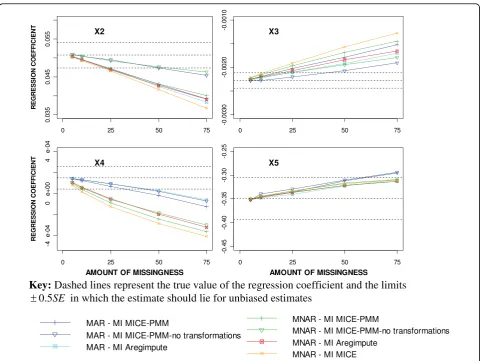
coverage for X2, X3 and X4 was worse after MI using a MNAR mechanism than a MAR mechanism (Figure 8).
Discussion
Using a real dataset to provide a suitable structure for simulating the datasets, as in this study, simplifies the data generation procedures, avoids arbitrary choices and can aid the generalisability of the results. The simulated data were not an exact replica of the original, but pro-vided sufficiently strong similarities to the original data to not warrant using more complicated semi-continuous distributions for PGR level (X3), and ER level (X4). Approximating the patterns of missingness seen in an
[image:13.595.58.539.88.528.2]incomplete dataset provided a realistic framework for simulating the missing data. The levels of missingness imposed reflected those seen in a review of prognostic modelling studies [1]. The effects of using MI when fit-ting prognostic models were unknown. Therefore this simulation study restricted the modelling process to including all covariates in the prognostic model and assuming linear relationships for all continuous covari-ates, both in the generation of the survival times and in the fitting of the prognostic model. Extensions of this research could include investigating the possible approaches for performing variable selection and fitting fractional polynomials after MI (e.g. [34]).
Figure 6Model performance measures for different missing data methods for increasing percentage of MAR missingness. a) Likelihood
In this simulation study, performing a CC analysis with any multivariate missingness produced less biased regression coefficient estimates with better coverage rates than using SI or MI. However, this benefit was at the expense of larger standard errors and hence loss of efficiency due to the reduction in the sample being ana-lysed [8]. This loss in efficiency affected the significance of the covariates in the prognostic model of the mar-ginal prognostic covariates, making them appear non-significant with 25% or more missingness when in fact they were prognostically important. It is advisable to use a CC analysis only when fitting a Cox proportional hazards model with a reasonably small amount of miss-ing data. Previous evidence [2,3] suggested that impos-ing univariate MAR missimpos-ingness associated with outcome would result in biased regression coefficient estimates when using CC analysis. Demissie et al [3] found large biases when the MAR mechanisms were associated with longer survival times or event status and the covariates had large hazard ratios for survival, but
not with a hazard ratio of 1 or when the missingness was associated with shorter survival times. Relatively unbiased results were found in our simulations with multivariate MAR missingness where the missingness of X5, the binary covariate with 20% of the total missing-ness, was associated with shorter survival times and the hazard ratio for X5 in the prognostic model was 0.7. Biased regression estimates may be more evident with more missing covariate data that is highly dependent on the outcome, especially longer survival times and event status, and with large hazard ratios.
With multivariate missing covariate data, using SI is not recommended with more than 10% missingness, due to its underestimation of the variability and correspond-ing detrimental effect on the coverage rates.
[image:14.595.58.539.86.447.2]The results from performing simulations based on the German breast cancer dataset showed some bias, espe-cially with over 25% missingness, for all mechanisms and MI approaches. The average SEs for all MI approaches and mechanisms were similar. They fell
Figure 7Comparison of the regression coefficient estimates for the different MI methods after imposing MAR and MNAR
between the inflated estimate from the CC analysis and the underestimated SE from SI, as expected from pre-vious research [8,35]. The coverage was unaffected and remained around the nominal 95% level for all mechan-isms and covariates, except for the skewed covariates. Tang et al [36] also found that the coverage may be poorer after MI for highly skewed data. Better coverage rates were seen using MICE-PMM without transforma-tions or the ‘aregImpute’function than with the other MI approaches and also when a MAR mechanism was imposed rather than a MNAR mechanism.
Researchers have suggested that MI approaches are fairly robust to departures from normality due to the separation of the imputation and analysis phases [12,13,37]. Any deficiencies in the assumptions and implementation of the imputation model will only affect the incomplete component of the dataset and not the whole sample [38]. Having skewed continuous data and an outcome of survival time as in this simulation study may have affected the performance of the methods under investigation, especially those which assumed an underlying normal distribution for the continuous cov-ariates, e.g. NORM, MIX and MICE. This study high-lighted the problems that can exist when the imputation and analysis models differ and the model assumptions may not be fully satisfied. The bias seen in this simula-tion study even when the MAR mechanism assumpsimula-tion was correct may be an artefact of the transformations used in the imputation process [39]. Not only are the incomplete covariates transformed for imputation and then back-transformed prior to analysis, but the survival
times are also transformed in the imputation model and then fitted using an alternative model. Imputing without transformation can reduce the bias in the mean estimate but distort other aspects of the distributional shape [39]. Log transformations were used for the continuous cov-ariates in the data generation process. However, as the simulated data were then truncated to resemble the real data, applying the same transformations in the imputa-tion process failed to satisfy normality. No other simple power transformations sufficiently improved normality or provided more plausible imputations.
[image:15.595.57.540.87.322.2]The inclusion in the imputation model of survival time after log transformation and event status may not be the optimal choice to account for the censoring pro-cess and thus may have also introduced bias into the results. Using the Nelson-Aalen estimate of the cumula-tive hazard of the survival time may be more appropri-ate in future [40]. If the hazard rappropri-ates for the survival and censoring times differ then it may be sensible to consider these times separately in the imputation model. The MI procedures using MICE-PMM or the ’ aregIm-pute’function, which rely on the distributional assump-tions only to match complete and incomplete responders, performed better for all missingness mechanisms than the other MI approaches. This con-firmed the results from Faris et al [15] that with incom-plete skewed data, MICE-PMM would be preferred to other MI Markov Chain Monte Carlo type approaches. However, caution is needed when using the’aregImpute’ function, especially when the missingness is highly related to survival, as although the estimates for the
incomplete covariates may exhibit little bias, the esti-mates for other prognostically important covariates may display more bias than seen with other MI approaches. Both MICE-PMM and the’aregImpute’function identify suitable matches from the observed data and therefore additional caution is required with small samples and with covariates with rare events as there may be a lim-ited number of available cases to be selected as imputed values. With skewed data, values of a few cases have a lot of leverage that may distort the imputations and influence the results. Therefore it is essential to examine the distributions of the covariates requiring imputation to determine whether transformations are likely to pro-vide reasonable estimates for the data to be analysed. With MICE-PMM, transforming the continuous covari-ates produced worse estimcovari-ates than simply using the covariate values on their original skewed scale. Our find-ings suggest that if suitable transformations do not improve normality it is better to use MICE-PMM with-out transformations. With a fully observed normally dis-tributed outcome and more normally disdis-tributed incomplete covariates and hence compatible imputation and analysis models, MICE-PMM may not remain the best MI approach.
In this simulation study, truncating imputed values for the continuous covariates to within the plausible range produced less bias than allowing implausible values. Schafer [31] suggested rounding values for the incom-plete binary covariate to the observed values. In these simulations, where only 20% of the total missingness was imposed on the binary covariate, that approach did not produce any more bias than using the correct distri-butional assumption, e.g. fitting logistic regression mod-els. Biases may be more apparent when the binary covariate has an uneven split or greater missingness [39].
From this simulation study, with incomplete skewed data, MI using MICE-PMM without transformations produced precise unproblematic estimates [12] within the allowable 10% accuracy with up to 25% missingness, but would not be recommended with 50% or more missingness for any missing data mechanism. Further-more, with a MNAR mechanism, MI performed poorly with 25% or more overall missingness. Including vari-ables in the imputation model that help to explain the missingness or are highly associated with the incomplete covariates themselves, can reduce the effect of an MNAR missing data mechanism [8]. With less enriched imputation models, and datasets where there is little correlation between variables, the results from the MNAR may be even more extreme than seen here. Further research is required to assess whether alterna-tive MI procedures or fully Bayesian approaches that can model the skewness of the covariate distribution
and the missing data mechanism may be more appropri-ate when there is more than 25% missingness.
The true performance of the various missing data methods is likely to vary in relation to the underlying distribution of the covariates, the correlations between these variables as well as with different missing data mechanisms and associations between the outcome and the covariates with missing data. Therefore, the generali-sability of the results from this simulation study, how-ever rigorous, is limited due to reflecting the data from a single real prognostic study and imposing a restricted number of missing data mechanisms. Confirmatory investigations are required to examine the extent to which these findings are consistent across alternative populations, distributions and clinical contexts.
Conclusions
For approximately 10% or less missingness, it remains unclear whether the benefits of MI, including efficiency and utilising all data, outweigh the simplicity of a CC analysis. With increasing amounts of missingness, the benefits of MI over a CC analysis become clearer. When some data are skewed, as in this simulation study, MICE-PMM may be the preferred MI approach pro-vided that less than 50% of the cases have missing data and the missing data are not MNAR.
Acknowledgements
Andrea Marshall (nee Burton) was supported by a Cancer Research UK project grant. Douglas G Altman is supported by Cancer Research UK. Patrick Royston is supported by the UK Medical Research Council.
Author details
1Centre for Statistics in Medicine, University of Oxford, Oxford, UK.2Warwick
Clinical Trials Unit, University of Warwick, Coventry, UK.3Hub for Trials
Methodology Research and UCL, MRC Clinical Trials Unit, London, UK.
4Department of Primary Care Clinical Sciences, University of Birmingham,
Birmingham, UK.
Authors’contributions
AM participated in the design, coordination and analysis of this study and drafted the manuscript. DGA participated in the design of the study, the interpretation of the data and helped in the writing of the manuscript. PR participated in the design of the study, the interpretation of the data and revision of the manuscript. RH advised on the design and interpretation of the study, and participated in the revision of the manuscript. All authors have read and approved the final manuscript.
Competing interests
The authors declare that they have no competing interests.
Received: 19 August 2009
Accepted: 19 January 2010 Published: 19 January 2010
References
1. Burton A, Altman DG:Missing covariate data within cancer prognostic studies: a review of current reporting and proposed guidelines.British Journal of Cancer2004,91(1):4-8.
3. Demissie S, LaValley MP, Horton NJ, Glynn RJ, Cupples LA:Bias due to missing exposure data using complete-case analysis in the proportional hazards regression model.Statistics in Medicine2003,22(4):545-557. 4. Lipsitz SR, Ibrahim JG:Using the EM-algorithm for survival data with
incomplete categorical covariates.Lifetime Data Analysis1996,2(1):5-14. 5. Lipsitz SR, Ibrahim JG:Estimating equations with incomplete categorical
covariates in the Cox model.Biometrics1998,54(3):1002-1013. 6. Meng XL, Schenker N:Maximum likelihood estimation for linear
regression models with right censored outcomes and missing predictors.Computational Statistics & Data Analysis1999,29(4):471-483. 7. Rubin DB:Multiple Imputation for Nonresponse in Surveys.New York:
John Wiley and Sons 2004.
8. Little RJA, Rubin DB:Statistical Analysis with Missing Data, Second edition.New York: John Wiley and Sons 2002.
9. van Buuren S, Boshuizen HC, Knook DL:Multiple imputation of missing blood pressure covariates in survival analysis.Statistics in Medicine1999,
18(6):681-694.
10. Meng XL:Multiple-imputation inferences with uncongenial sources of input.Statistical Science1994,9(4):538-558.
11. Hu M, Salvucci S, Weng S, Cohen MP:Evaluation of Proc Impute and Schafer’s imputation software.Proceedings of the survey research methods section of the American Statistical Association. Chicago, Illinois1996, 287-292. 12. Schafer JL, Graham JW:Missing data: our view of the state of the art.
Psychological Methods2002,7(2):147-177.
13. Schafer J, Ezzati-Rice T, Johnson W, Khare M, Little R, Rubin D:The NHANES III multiple imputation project.Proceedings of the Survey Research Methods Section of the American Statistical Association. Chicago, Illnois1996, 28-37. 14. Schenker N, Taylor JMG:Partially parametric techniques for multiple
imputation.Computational Statistics & Data Analysis1996,22(4):425-446. 15. Faris PD, Ghali WA, Brant R, Norris CM, Galbraith PD, Knudtson ML:Multiple
imputation versus data enhancement for dealing with missing data in observational health care outcome analyses.Journal of Clinical Epidemiology2002,55(2):184-191.
16. Greenland S, Finkle WD:A critical look at methods for handling missing covariates in epidemiologic regression analyses.American Journal of Epidemiology1995,142(12):1255-1264.
17. Chen HY:Double-semiparametric method for missing covariates in Cox regression models.Journal of the American Statistical Association2002,
97(458):565-576.
18. Herring AH, Ibrahim JG, Lipsitz SR:Non-ignorable missing covariate data in survival analysis: a case-study of an International Breast Cancer Study Group trial.Journal of the Royal Statistical Society Series C-Applied Statistics
2004,53(2):293-310.
19. Oostenbrink R, Moons KGM, Bleeker SE, Moll HA, Grobbee DE:Diagnostic research on routine care data prospects and problems.Journal of Clinical Epidemiology2003,56(6):501-506.
20. Harrell FE:Regression Modeling Strategies with Applications to Linear Models, Logistic Regression, and Survival Analysis.New York: Springer-Verlag 2001.
21. Barzi F, Woodward M:Imputations of missing values in practice: Results from imputations of serum cholesterol in 28 cohort studies.American Journal of Epidemiology2004,160(1):34-45.
22. Scheffer J:Dealing with missing data.Research Letters in the Information and Mathematical Sciences2002,3:153-160.
23. R Development Core Team:R: A language and environment for statistical computing.Vienna, Austria: R Foundation for Statistical Computing 2004. 24. Sauerbrei W, Royston P, Bojar H, Schmoor C, Schumacher M:Modelling the
effects of standard prognostic factors in node-positive breast cancer. German Breast Cancer Study Group (GBSG).British Journal of Cancer1999,
79(11-12):1752-1760.
25. Burton A, Altman DG, Royston P, Holder RL:The design of simulation studies in medical statistics.Statistics in Medicine2006,25(24):4279-4292. 26. Bender R, Augustin T, Blettner M:Generating survival times to simulate
Cox proportional hazards models.Statistics in Medicine2005,
24(11):1713-1723.
27. Clark TG, Stewart ME, Altman DG, Gabra H, Smyth JF:A prognostic model for ovarian cancer.British Journal of Cancer2001,85(7):944-952. 28. Collins LM, Schafer JL, Kam CM:A comparison of inclusive and restrictive
strategies in modern missing data procedures.Psychological Methods
2001,6(4):330-351.
29. Royston P, Sauerbrei W:A new measure of prognostic separation in survival data.Statistics in Medicine2004,23(5):723-748.
30. Kong FH:Adjusting regression attenuation in the Cox proportional hazards model.Journal of Statistical Planning and Inference1999,
79(1):31-44.
31. Schafer JL:Analysis of Incomplete Multivariate Data.New York: Chapman and Hall 1997.
32. Marshall A, Altman D, Holder R, Royston P:Combining estimates of interest in prognostic modelling studies after multiple imputation: current practice and guidelines.BMC Medical Research Methodology2009,
9(1):57.
33. Li KH, Meng XL, Raghunathan TE, Rubin DB:Significance levels from repeated p-values with multiply-imputed data.Statistica Sinica1991,
1(1):65-92.
34. Wood AM, White IR, Royston P:How should variable selection be performed with multiply imputed data?.Statistics in Medicine2008,
27(17):3227-3246.
35. Rubin DB, Schenker N:Multiple imputation in health-care databases: an overview and some applications.Statistics in Medicine1991,10(4):585-598. 36. Tang LQ, Song JW, Belin TR, Unutzer J:A comparison of imputation
methods in a longitudinal randomized clinical trial.Statistics in Medicine
2005,24(14):2111-2128.
37. Rubin DB:Multiple imputation after 18+ years.Journal of the American Statistical Association1996,91(434):473-489.
38. Schafer JL, Olsen MK:Modelling and imputation of semicontinuous survey variables.The Methodology Center, Penn State University, USA 2000.
39. Horton NJ, Lipsitz SR, Parzen M:A potential for bias when rounding in multiple imputation.American Statistician2003,57(4):229-232.
40. White I, Royston P:Imputing missing covariate values for the Cox model.
Statistics in Medicine2009,28(15):1982-1998.
41. Schafer JL, Novo AA:norm: Analysis of multivariate normal datasets with missing values.R package version 1.0.9 2002.
42. Schafer JL:mix: Estimation/multiple Imputation for Mixed Categorical and Continuous Data.R package version 1.0.4 2003.
43. van Buuren S, Oudshoorn CGM:mice: Multivariate Imputation by Chained Equations library.R package version 1.13.1 2005.
44. Harrell FE:Hmisc: Harrell Miscellaneous library for R statistical software.R package 2.2-3 2004.
Pre-publication history
The pre-publication history for this paper can be accessed here:http://www. biomedcentral.com/1471-2288/10/7/prepub
doi:10.1186/1471-2288-10-7
Cite this article as:Marshallet al.:Comparison of techniques for handling missing covariate data within prognostic modelling studies: a simulation study.BMC Medical Research Methodology201010:7.
Publish with BioMed Central and every scientist can read your work free of charge
"BioMed Central will be the most significant development for disseminating the results of biomedical researc h in our lifetime."
Sir Paul Nurse, Cancer Research UK
Your research papers will be:
available free of charge to the entire biomedical community
peer reviewed and published immediately upon acceptance
cited in PubMed and archived on PubMed Central
yours — you keep the copyright
Submit your manuscript here:
http://www.biomedcentral.com/info/publishing_adv.asp