A Thesis Submitted for the Degree of PhD at the University of Warwick
http://go.warwick.ac.uk/wrap/47727
This thesis is made available online and is protected by original copyright. Please scroll down to view the document itself.
Vedad Hulusi´
c
BSc
A thesis submitted in partial fulfilment of the requirements for the degree of
Doctor of Philosophy in Engineering
School of Engineering University of Warwick
Acknowledgements xiii
Declaration xv
List of Publications xvi
Abstract xix
1 Introduction 1
1.1 High-fidelity rendering . . . 2
1.1.1 Applications . . . 3
1.2 Cross-modal interaction . . . 5
1.3 Research aim and objectives . . . 6
1.4 Thesis outline . . . 7
2 Human Sensory System 9 2.1 Human visual system . . . 10
2.1.1 The anatomy of the HVS . . . 10
2.1.2 Visual perception . . . 15
2.2 Human auditory system . . . 18
2.2.1 Sound properties . . . 18
2.2.2 Peripheral auditory anatomy . . . 24
2.2.3 Auditory perception . . . 28
2.3 Attention and Perception . . . 32
2.3.1 Attentional capture . . . 33
2.3.2 Attentional resources and limitations . . . 35
2.4 Summary . . . 37
3 High-Fidelity Rendering 38 3.1 Radiometry . . . 40
3.2 Light reflectance models . . . 41
3.3 Light transport . . . 42
3.4 Rasterisation . . . 43
3.9 Summary . . . 49
4 Cross-Modal Interaction 51 4.1 Auditory-visual cross-modal interaction in psychology . . . 51
4.1.1 Auditory influence on visual perception . . . 53
4.1.2 Visual influence on auditory perception . . . 56
4.2 Auditory-visual cross-modal integration . . . 58
4.3 Auditory-visual cross-modal interaction in computer graphics . . . 61
4.3.1 Auditory rendering . . . 61
4.3.2 Visual rendering . . . 62
4.4 Summary . . . 66
5 The Influence of Cross-Modal Interaction on Perceived Render-ing Quality Thresholds 68 5.1 Introduction . . . 68
5.2 Experiment . . . 69
5.2.1 Stimuli . . . 70
5.2.2 Visual difference predictor . . . 72
5.2.3 Hardware and rendering time . . . 75
5.2.4 Procedure . . . 75
5.3 Results . . . 77
5.3.1 Statistical analysis of psychophysical experiment . . . 77
5.3.2 Comparison using VDP . . . 83
5.4 Discussion . . . 84
6 Beat Rate Effect on Frame Rate Perception 86 6.1 Introduction . . . 86
6.2 Experiments . . . 87
6.2.1 Design . . . 88
6.2.2 Participants . . . 89
6.2.3 Apparatus . . . 91
6.2.4 Stimuli . . . 91
6.2.5 Procedure . . . 92
6.2.6 Analysis methods . . . 96
6.3 Results . . . 98
6.3.1 Static scenes . . . 98
6.3.2 Dynamic scenes . . . 102
7.2.1 Design . . . 111
7.2.2 Participants . . . 111
7.2.3 Apparatus . . . 111
7.2.4 Stimuli . . . 113
7.2.5 Procedure . . . 115
7.3 Results . . . 116
7.3.1 Test 1: Camera movement speed influence on animation smoothness perception . . . 116
7.3.2 Test 2: Sound effect’s influence on perceived smoothness threshold . . . 117
7.3.3 Test 3: Sound effect’s influence on animation smoothness perception . . . 119
7.4 Discussion . . . 121
8 Conclusions and Future Work 123 8.1 Contributions . . . 130
8.2 Impact . . . 131
8.3 Directions for future work . . . 132
8.4 Final remarks . . . 134
References 135
9 Appendix A: Additional materials from the study presented in
Chapter 5 156
10 Appendix B: Additional materials from the study presented in
Chapter 6 164
11 Appendix C: Additional materials from the study presented in
1.1 Rasterisation: 3D object projection onto a 2D image plane. . . 2
1.2 An example of different rendering techniques: plain rasterisation
(left) and ray tracing technique using Photon mapping. Additional
features are included, such as global illumination and caustics (right). 3
1.3 Ray tracing: ray traversal through pixels on the image plane. . . . 3
2.1 The human eye. From [Bri11b] . . . 11
2.2 The electromagnetic spectrum with visible wavelengths. After
[Kai11] . . . 12
2.3 Rods and cones normalised spectral sensitivity. From [Sch06]. . . 13
2.4 Rods and cones distribution across the retina. After [BS06]. . . . 13
2.5 The top projection of the optic nerves stretching from the eyeballs
to the visual cortex. From [Bri11c] . . . 14
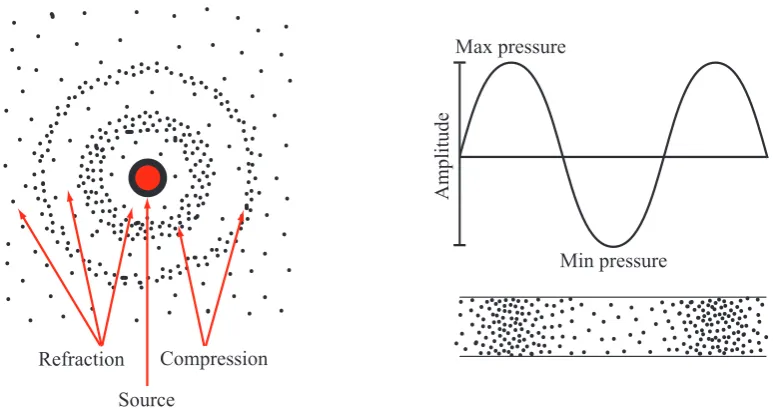
2.6 An illustration of wave creation: The number of molecules
dis-placed by a vibration determines the amplitude of a sine wave.
After [Alt04]. . . 19
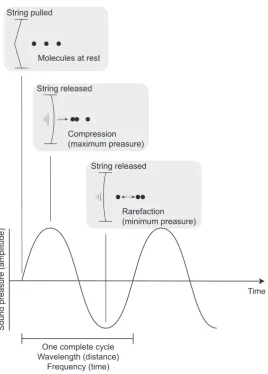
2.7 Sinusoidal representation of a wave: After the string is released,
molecules bump into each other, creating a compression.
Subse-quently, the string moves inwards pulling the molecules away from
2.9 Wave interference: w1 and w2 interfering waves; w1+w2 resultant
wave. . . 22
2.10 Response of the human ear to different frequencies. Inspired by
Figure 2.3 from [Alt04]. . . 23
2.11 Sound envelope components: Attack, Initial decay, Sustain and
Release (Decay). . . 24
2.12 The anatomy of the human ear. From [Bri11a]. . . 25
2.13 Illustration of the human cochlea. . . 27
2.14 Bianural cues: Interaural Intensity Difference (IID) and Interaural
Time Difference (ITD). . . 30
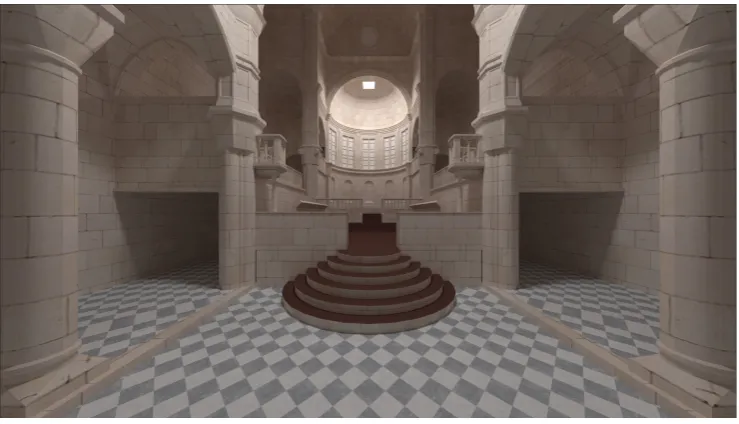
3.1 Physically-based rendering examples: images rendered using Path
tracing method (courtesy of Piotr Dubla) (top left and bottom right); an image rendered using Radiance rendering package [War94]
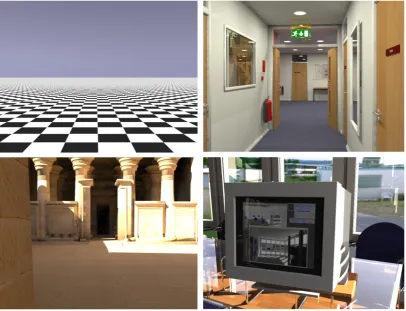
(top right); an image rendered using Mental Ray(courtesy of Jas-sim Happa) (bottom left). . . 38 3.2 Non-physically-based rendering: design concepts (left and middle)
and cultural heritage virtual reconstruction example (right). . . . 39
3.3 Light reflectance: diffuse (left), specular (middle) and glossy (right). 41
3.4 The bidirectional reflectance distribution function (BRDF). After
[PH10]. . . 42
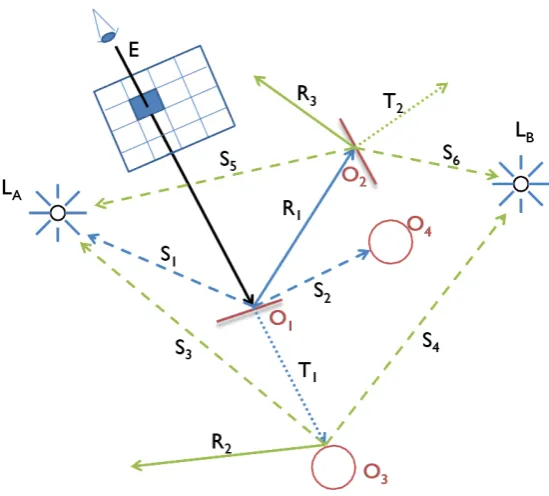
shot towards light sources; reflectance ray R1 is shot off the surface
at the calculated angle; transmission ray T1 is shot through the
surface. The process is repeated recursively for R1 and T1. . . 46
3.7 An example of path traced image (courtesy of Piotr Dubla). . . . 48 5.1 Example of the slide sequence from the experiment. . . 70
5.2 Scenes used for the experiment: Checkerboard (top left), Corridor
(top right), Kalabsha (bottom left), Library (bottom right). See
Appendix A for larger images. . . 71
5.3 White noise frequency spectrum. . . 73
5.4 An example of the VDP comparison. Top: mask image; Middle:
target image; Bottom: difference map with probability of detection
- green:0-50%; yellow: 50-75%; red:75-95%; pink:95-100%. See
Appendix A for large images. . . 74
5.5 The frequencies of the participants’ scores across sound conditions. 79
5.6 The frequencies of the participants’ scores across quality conditions
(RaysPerPixel). . . 80
6.1 A sample frame from each of the animations used in the study.
See Appendix B for larger images. . . 90
6.2 Correlation between beat rates (bps) and frame rates (fps). The
diagram shows the number of frames that fit within a beat. . . 93
6.3 An illustration of the frame rate concept used in the instructions. 93
6.4 Two frames from the sample animation. . . 94
6.5 Preview of the slider bar used in the experiment. . . 95
6.6 Mean values of subjective scores across static scenes with standard
6.8 Mean values of subjective scores across static scenes with standard
error. All static scenes and frame rates are pooled. . . 100
6.9 Mean values of subjective scores across static scenes and frame
rates with standard error. . . 101
6.10 Mean values of subjective scores across static scenes and beat rates
with standard error. . . 101
6.11 Mean values of subjective scores across frame rates and beat rates
with standard error. . . 101
6.12 Mean values of subjective scores across dynamic scenes with
stan-dard error. All frame and beat rates are pooled. . . 102
6.13 Mean values of subjective scores across frame rates with standard
error. All dynamic scenes and beat rates are pooled. . . 103
6.14 Mean values of subjective scores across beat rates with standard
error. All dynamic scenes and frame rates are pooled. . . 103
6.15 Mean values of subjective scores across dynamic scenes and frame
rates with standard error. . . 104
6.16 Mean values of subjective scores across dynamic scenes and beat
rates with standard error. . . 104
6.17 Mean values of subjective scores across frame rates and beat rates
with standard error. . . 105
7.1 Four frames taken from the walk-through animations. The top
two frames are from the animations with camera moving from
the corridor to the conference hall, and the bottom two from the
animations where the camera is moving from the conference hall
(blue) were used. . . 114
7.3 Oscillating camera motion along the vertical (z) axis. . . 114
7.4 The experimental procedure. From left to right: grey box, first
animation, grey box, second animation and A/B evaluation screen. 115
7.5 Mean values of the compared running animation test pairs. . . 120
2.1 The basic properties of the human visual system. . . 16
2.2 The basic properties of the human auditory system. . . 21
5.1 Related sounds used for the experiment. . . 72
5.2 Rendering times for all scenes presented in seconds. . . 75
5.3 Variables used in the experiment. . . 77
5.4 Summary of the contingency table for the sound condition. Test-Better shows the count of responses preferring the test image over gold standard one. GoldBetter is the count of responses preffering the gold image over the test one. . . 78
5.5 Summary of the contingency table for the rpp condition. Test-Better shows the count of responses preferring the test image over gold standard one. GoldBetter is the count of responses preffering the gold image over the test one. . . 80
in bold. Results show that the subjects were looking more closely,
and were able to find more differences. . . 82
5.9 VDP comparison of perceivable differences for all scenes showing
the percentage of pixels on which the probability of perceiving that
difference is the highest. . . 84
7.1 The details of the experimental design for each test. Numbers
represent frame rate, while “r” and “w” stand for running and
walking animations respectively. . . 110 7.2 Test 1: Observed and expected frequencies for the Run - Walk
animation smoothness perception comparison. . . 117
7.3 Test 2: Mean and p values for Audio condition. p − value is given for difference in preference between the test pairs and
60r-60w condition. Lower and upper bounds were 1 (first animation
preferred) and 2 (second animation preferred) respectively. *Not
inline with a 1-tailed test. . . 118
7.4 Test 3: Mean and p values forAudio condition. p−value is given for difference in preference between the test pairs and 60vs60
con-dition. Lower and upper bounds were 1 (first animation preferred)
and 2 (second animation preferred) respectively. . . 119
8.1 The cross-modal phenomena found in psychology and the main
studies within the computer graphics that were inspired by this
First and foremost I would like to thank God, the Almighty, for having made all this possible by giving me health, strength and courage to do this work. My deepest gratitude to my supervisor Alan Chalmers, for inviting me to Warwick and his continuous encouragement and support he demonstrated during my study. Many thanks to Kurt Debattista who was there whenever I needed him, providing me with invaluable comments and advice, which greatly contributed to my thesis completion. A special thanks to Selma Rizvic, my undergraduate and masters supervisor, who introduced me to Alan and has been a great friend and support during this journey.
Kurt, Anna and Alex you were like a family! Spending time with you over dinners, coffees and football matches made me feel like at home. I know that I have friends for life. Please don’t ever forget the pact we made.
I was so lucky to have such a great group here in Warwick. Vibhor, you are a great guy, always being there to help. Piotr, Matt and Gabriela thanks for being so patient with all my questions and for help with my PhD. I think we have done some significant work together. Tom, Jass, Carlo and Alessandro you are wonderful friends and enhanced my life in UK. Silvester, Francesco, Alena, Elena, Remi, Mike it was terrific having you here. Thank you all.
It was great having the other Bosnians at Warwick. Belma, you were the best flatmate, being so kind and supportive all those years. Elmedin, you are an awesome person, “jaran” who could understand me when no one else did. Thank you both for everything!
Thanks to all the volunteers who participated in the experiments. Without their help and patience this study would have never reached any conclusions. I would also like to express my gratitude to the University of Warwick for funding my research through the Vice Chancellor’s scholarship and all the people from the University who assisted me in various ways during my study. Many thanks to all the people from ISOC, who have made my stay in UK special.
There was a person whom I knew for only three months, but who has left an indelible mark in my life. Always smiling, willing to help, enjoying every thing he did and loving every person he knew. A very unique person, whose peculiarity can not be described in only a few sentences... Usama, you will always be remembered.
The work in this thesis is original and no portion of work referred to here has
been submitted in support of an application for another degree or qualification
of this or any other university or institute of learning.
Signed: Date: 27 May 2011
The following publications are the result of the work summarised within the
thesis:
Journal papers
• Hulusi´c, V., Debattista, K., Aggarwal, V., Chalmers, A. (2011): Main-taining frame rate perception in interactive environments by exploiting
audio-visual cross-modal interaction. The Visual Computer.
• Hulusi´c, V., Debattista, K., Dubla, P., Bessa, M.E.C., Chalmers, A. (2011): Smoothness perception: Investigation of beat rate effect on frame
rate perception, submitted to the Computer Graphics Forum, second round
of review.
Peer-reviewed Conference Papers
• Hulusi´c, V., Aranha, M., Chalmers, A. (2008): The influence of cross-modal interaction on perceived rendering quality thresholds, in WSCG 2008
Full Papers Proceedings, The 16th International Conference in Central
-A. (2009): Investigation of the beat rate effect on frame rate for animated
content, in Spring Conference on Computer Graphics 2009, Bratislava,
Slo-vak Republic
• Hulusi´c, V., Debattista, K., Aggarwal, V., Chalmers, A. (2010): Exploit-ing audio-visual cross-modal interaction to reduce computational
require-ments in interactive environrequire-ments, Proceedings of the IEEE conference on
Games and Virtual Worlds for Serious Applications, IEEE Computer
Soci-ety, VS-Games 2011, Braga, Portugal.
• Hulusi´c, V., Harvey, C., Tsingos, N., Debattista, K., Walker, S., Howard D., Chalmers A. (2011): Acoustic Rendering and Auditory-Visual
Cross-Modal Perception and Interaction, State of the Art Reports (STAR),
Eu-rographics 2011.
Additionally, my research has been incorporated with the work of other
re-searchers from the group. As a result of such work following has been published:
• Happa, J., Znyi, E., Hulusi´c, V., Chrysanthou, Y., Chalmers, A. (2008):
The High-Fidelity Computer Reconstruction of Byzantine Art in Cyprus,
IV International Cyprological Congress, Lefkosia, Cyprus.
• Happa, J., Znyi, E., Hulusi´c, V., Chrysanthou, Y., Chalmers, A., (2008):
Capturing and Visualising the Past: High-Fidelity Computer
Reconstruc-tion of Byzantine Artefacts, Presented at the World Archaeological Congress,
Dublin, Ireland.
• Happa, Jassim., Artusi, A., Dubla, P., Bashford-Rogers, T., Debattista,
2009, St. Julians, Malta.
Finally, I have been working on related topics, such as virtual reconstruction
of cultural heritage, which resulted in following peer-reviewed conference papers:
• Rizvi´c, S., Sadˇzak, A., Rami´c-Brki´c, B., Hulusi´c, V. (2011): Virtual
Mu-seum Applications and Their Public Perception in Bosnia and Herzegovina,
in 4th International Workshop 3D-ARCH 2011: 3D Virtual Reconstruction
and Visualization of Complex Architectures 2011, Trento, Italy.
• Hulusi´c, V., Rizvi´c, S. (2011): The use of live virtual guides in educational
applications, Proceedings of the IEEE conference on Games and Virtual
Worlds for Serious Applications, IEEE Computer Society, VS-Games 2011,
Generating high-fidelity images in real-time at reasonable frame rates, still re-mains one of the main challenges in computer graphics. Furthermore, visuals remain only one of the multiple sensory cues that are required to be delivered simultaneously in a multi-sensory virtual environment. The most frequently used sense, besides vision, in virtual environments and entertainment, is audio. While the rendering community focuses on solving the rendering equation more quickly using various algorithmic and hardware improvements, the exploitation of human limitations to assist in this process remain largely unexplored.
Many findings in the research literature prove the existence of physical and psychological limitations of humans, including attentional, perceptual and limi-tations of the Human Sensory System (HSS). Knowledge of the Human Visual System (HVS) may be exploited in computer graphics to significantly reduce rendering times without the viewer being aware of any resultant image quality difference. Furthermore, cross-modal effects, that is the influence of one sensory input on another, for example sound and visuals, have also recently been shown to have a substantial impact on viewer perception of virtual environment.
Introduction
High-fidelity rendering in real-time still remains one of the greatest challenges
in computer graphics. Despite substantial improvement in the performance of
general and dedicated graphics hardware, it is still not possible to generate
high-fidelity images of complex scenes on a single machine in real-time. Furthermore,
in virtual environments, such as video games, stimulation of auditory, and
possi-bly some other senses, is often also desirable to improve the user experience, since
we are used to environments where multiple senses are stimulated simultaneously.
This, however, does not necessarily need to be considered as an additional work
load, but instead, can be exploited, so that the overall work load is balanced
or even reduced, without any perceivable loss in quality. This is possible due
to various limitations of the Human Sensory System (HSS). One such limitation
is the influence of one sensory input on another, commonly termed cross-modal
interaction. In this thesis, auditory-visual interaction is investigated, adapting it
1.1
High-fidelity rendering
Rendering is the process of digital image synthesis of virtual scenes for
consump-tion by current displays - typically in the form of a 2D image. This can be done
using different methods with various levels of complexity, and therefore
achiev-ing higher or lower image fidelity. A complete calculation of light propagation
contributed by each photon individually would be impractical. Therefore,
dif-ferent techniques have been developed for approximating this process, making it
achievable on available hardware resources. A coarse image representation can
be achieved by straightforward projection of a 3D object on a 2D image plane,
see Figure 1.1. This technique is known as rasterisation, see Figure 1.2.
Image plane Eye
Rasterised image
Screen Projection
Figure 1.1: Rasterisation: 3D object projection onto a 2D image plane.
Another method, considered more physically accurate, is called ray tracing,
where light intensity of each pixel is calculated by traversing rays from a virtual
camera through each pixel, and calculating the light contribution from the light
sources and surrounding objects at the ray’s point of intersection with the virtual
scene, see Figure 1.3.
Physically-based rendering aims at solving the rendering equation [Kaj86],
see Section 3.3. This calculation considers physical properties of the materials,
calculated using Bidirectional Reflectance Distribution Functions (BRDFs). The
Figure 1.2: An example of different rendering techniques: plain rasterisation (left) and ray tracing technique using Photon mapping. Additional features are included, such as global illumination and caustics (right).
is rather high, making the rendering technique inappropriate for real-time
appli-cations. Therefore, the computer graphics research community has worked on
improving rendering algorithms and hardware enhancements for several decades,
utilising various alternatives including human sensory and attentional limitations.
Image plane Eye
View rays
[image:23.595.232.397.453.579.2]Shadow rays Light source
Figure 1.3: Ray tracing: ray traversal through pixels on the image plane.
1.1.1
Applications
Computer graphics have been employed for a wide variety of purposes.
How-ever, its utilisation has been restricted due to the inability to render graphics at
such as multi-core Central Processing Units (CPUs) and Graphics Processing
Units (GPUs), and significant enhancements of rendering algorithms, many
limi-tations have been overcome. This has increased the render quality and expanded
the use of computer graphics, which nowadays can be found in many applications,
such as:
• Virtual Worlds: Recently virtual worlds have become increasingly
popu-lar. Second Life, probably the most popular amongst immersive 3D virtual
worlds, allows users to socialise, connect and interact with other users in
the virtual world, using text or voice chat. It can also be used for training
and education [DLFPT09].
• Computer Games: One of the leading entertainment industries, along with
film industry, is computer games production. The game industry is a
sig-nificant factor in pushing the limits of the graphics hardware and rendering
techniques. This results in a continuous improvement of the user immersion
and graphics quality [Mit07].
• Visual Effects: The majority of current films use visual effects extensively
[TL04]. This can range from applying virtual lighting in a scene to adding
virtual characters or particles in form of fire, explosion, water, etc.
• Data Visualisation: Computer graphics can also be used for visualising
var-ious data when communicating information to a target audience [PNB03].
This data is abstracted and represented with an appropriate visual form.
• Architecture: Rendering is frequently employed in architecture for making
previews or producing realistic appearance of the design concepts. For the
latter, the physically-based rendering is usually used, in order to simulate
the building process, allowing for design improvements before actually
start-ing the physical construction.
• Training Simulators: A good training simulator needs to provide a high level
of immersion, which is achievable through high-fidelity stimuli [RMP04].
Its main purpose is to recreate a real life situation and simulate it as if the
user was there. The deliverables usually include graphics, audition, haptics,
olfaction, and other stimuli.
• Medicine: Computer graphics plays an important role in medicine. It
is used for medical imaging, such as Computer Tomography (CT),
Mag-netic Resonance Imaging (MRI), Positron Emission Tomography (PET)
and other similar techniques.
• Archaeology: Many archaeological sites contain only partial remains of the
original constructions and artefacts. Furthermore, very often it is not
possi-ble to physically rebuild them and present an authentic appearance.
There-fore, virtual reconstructions are made, where 3D representations of the
orig-inal site are created, giving the opportunity to interact with the model e.g.
walk around/through a building, examining artefacts, etc. [HMD∗10].
1.2
Cross-modal interaction
The computational expense of creating virtual environments, particularly those
involving multiple senses, has led researchers to explore the interactions between
different senses within the sphere of the Human Sensory System (HSS). Despite
being extremely complex, the HSS is not perfect and it has certain limitations.
In particular, limited attentional resources ensure that the HSS cannot attend
modali-ties is major topic of research in psychology, for example [GM59, Rec03, SS04].
Based on such work, one particular cross-modal effect, investigated in the field of
computer graphics is that of the vision and audition [Mas06]. Those results are
the initial step towards cross-modal interaction understanding and its utilisation
within computer graphics. Since it carries significant potential for enhancing
graphics rendering, it needs to be investigated further, which is the topic of this
thesis. There are multiple aspects of this phenomenon that have to be carefully
studied, in order to be able to design a framework that could adjust various
pa-rameters of both auditory and visual stimuli on demand, thus speeding up the
rendering process, without a degradation in overall perceived quality. This is
possible by tackling all those aspects, such as user experience and immersion,
scene dynamics, subjective emotional factors, auditory-visual stimuli
relation-ship, spatio-temporal perceptual influences, etc. individually.
1.3
Research aim and objectives
Until now, the auditory-visual cross-modal interaction in computer graphics has
been narrowly investigated, giving an indication of a potential that could benefit
the rendering community in the field of computer graphics. The main aim of this
thesis is to further explore the direct relationship between vision and audition
in both the spatial and temporal domains and provide results that, if harnessed
correctly, should make it possible to have a graphics engine that can adjust the
audio and visual quality on-demand, to reduce or balance its work load whenever
required. This would effectively reduce the computational time of rendering,
without the user noticing any perceptual loss in quality.
The research objectives are as follows:
interaction, give an overview of the anatomy and limitations of the HSS
and main findings and phenomena related to the human attention and
perception, all structured in a meaningful framework;
• to investigate the limitations of the human visual system and the impact
cross-modal interactions have on perceivable rendering thresholds, in order
to speed up the rendering process by reducing the spatial image quality,
with perceivable difference in fidelity;
• to investigate the effect of scene related and unrelated audio on spatial
visual perception;
• to investigate the effect of audio beat rate on video frame rate in order to
decrease the work load by rendering less frames, without any degradation
in perceivable rendering quality;
• to investigate the effect of movement related sound effects, such as the sound
of footsteps in a walking/running animation, on temporal visual perception;
• to investigate additional effects, such as camera movement speed,
familiar-ity with computer games and/or animation, scene complexfamiliar-ity on frame rate
perception in computer animations;
• to provide a groundwork and direction for developing an adaptive rendering
framework for high-fidelity graphics in real-time.
1.4
Thesis outline
The thesis is organised as follows:
• Chapter 3: High-Fidelity Renderingpresents the main rendering tech-niques, relevant to the work presented in the thesis.
• Chapter 4: Cross-Modal Interaction covers the background on cross-modal interaction in both psychology and computer graphics, focusing on
auditory influence on vision and visual influence on audition in both
audi-tory and visual rendering.
• Chapter 5: The Influence of Cross-Modal Interaction of Perceived Rendering Quality Thresholds describes the study on auditory influ-ence on perceived rendering quality threshold for static images.
• Chapter 6: Beat Rate Effect on Frame Rate Perception provides evidence of cross-modal interaction and the potential of utilisation of
audi-tory influence on temporal visual perception for rendering enhancement.
• Chapter 7: Exploiting Audio-Visual Cross-Modal Interaction demon-strates the difference in perception of slow and fast animations.
Addition-ally, the influence of the related auditory effects on visual perception is
examined and results are presented.
Human Sensory System
Humans are constantly surrounded by multi-modal stimuli, both relevant and
irrelevant. In order to interpret an environment - its content and/or
relation-ships between its elements, we use our external senses: vision, audition, smell,
taste, touch, temperature, proprioception and the vestibular system, etc. In
ad-dition, the internal senses, e.g. memory, imagination, thirst, hunger, fatigue, etc.
are used for informing us about changes within our body. Our sensory organs
receive the physical stimulation, which is then transformed into neural signals,
and finally interpreted by the brain. However, it is not only the reception of
inputs that creates perception. Due to the internal factors, a significant amount
of preprocessing and reprocessing is required in order to get the complete
per-ceptual output. This chapter will cover the basics of vision and audition, and
the most relevant limitations, including attentional and perceptual shortcomings,
that might be utilised in computer graphics for enhancing auditory and visual
2.1
Human visual system
The human visual system (HVS) is a complex system responsible for receiving
the light from the environment, transmitting it through the visual pathways
and processing it in the visual cortex. Due to its high importance in computer
graphics, the main aspects of the anatomy and functionality of the HVS will be
explained in this chapter. More details can be found in [Roo02, BS06, Kai11].
2.1.1
The anatomy of the HVS
The HVS comprises three major parts: the eye, visual pathways and visual cortex.
Each part has its own functionality and relies on the functionality of the other
two.
The eye
The human eye is the external organ of the HVS, and it functions as an interface
to the outer world, see Figure 2.1.
It has a nearly spherical shape and a diameter of approximately 24mm. The
outermost layer of the eye is the sclera, whose major function is to protect the eyeball. The layer below is the choroid, which nourishes the eye cells. The innermost and the most important layer - the retina, captures the light and initiates the signal transmission.
The front, transparent, bulged part of the eye is called the cornea. When light passes through the cornea, it enters the lens through a small opening called the pupil. The size of the pupil is mostly determined by the incoming amount of light. The size is controlled by the two sets of muscles, one for decreasing and one
for increasing the opening. The size of the pupil also affects the depth of field,
Figure 2.1: The human eye. From [Bri11b]
crystalline lens. The lens is a transparent structure, about 9mm in diameter and
4mm in thickness. Along with the cornea, its function is to refract the incoming
light, focusing the light beam onto the retina. The lens can change its shape in
order to change the focal distance and focus on an object at a certain distance.
This process is called accommodation [BS06].
The retina
The retina is made of the same tissue as the brain and it represents the
extension of the central nervous system. The retina itself is comprised of a few
layers, but the focus will be kept only on the layer consisting of the photoreceptor
cells. There are two types of photoreceptors in humans: rods andcones, sensitive to wavelengths from about 400 to 700 nm, see Figure 2.2.
1000 m 100 m 10 m 1 m 10 cm 1 cm 1 mm 100 µm 10 µm 1 µm 100 nm 10 nm 1 nm 1 Å 0.1 Å
106 107 108 109 1010 1011 1012 1013 1014 1015 1016 1017 1018 1019
Long waves Radio
TV Microwaves Infra-red Ultraviolet X-rays Gamma-rays
700 nm 600 nm 500 nm 400 nm
Visible
Frequency (Hz)
Wavelength
Figure 2.2: The electromagnetic spectrum with visible wavelengths. After [Kai11]
are responsible for colours and they are mostly concentrated in thefovea, a small region of the retina with the highest visual acuity. There are three different types
of cones (L, M and S-cones), each absorbing different wavelengths, corresponding
to red (564nm), green (534nm) and blue (420nm) respectively, see Figure 2.3.
The rods, on the other hand, are mainly sensitive to light and benefit vision
in low light conditions. The rods are concentrated around the fovea and their
density decreases towards the periphery of the eye, see Figure 2.4.
The photoreceptors are connected to theganglion cells, which transmit visual information from the retina to the visual cortex in the brain. The place where
the blood vessels enter the eye and where the ganglion cell axons exit the eye
forming the optical nerve is called the optic disc. The optic disc contains no photoreceptors and therefore, creates “the blind spot”.
The visual pathways
The main objective of the eye is to capture the light. This light is transformed into
neural signals and transmitted to the brain. Each eye has its own optic nerve
constructed from the axons of the ganglion cells. The nerves exit the eyeball
through the optic disc. After approximately 5cm they meet at the place called
Figure 2.3: Rods and cones normalised spectral sensitivity. From [Sch06].
Cone peak
Rod peak
Rod peak
Blind
spot
Rods
Cones
50,000 100,000 150,000
Number of c
ones/r
ods per mm
2
Fovea Optic
disk peripheryNasal Temporal
periphery
the same side of the brain (ipsilateral fibers), see Figure 2.5. VISUAL PATHWAYS optic nerve left eye left side of brain optic chiasma image occipital lobe occipital lobe right side of brain optic nerve right eye objectobject
Figure 2.5: The top projection of the optic nerves stretching from the eyeballs to the visual cortex. From [Bri11c]
From the figure we can see that the information from the right visual field,
falling on the left side of both eyes’ retinas, will be carried and processed by the
left hemisphere of the brain, and the information from the left visual field, will
be transmitted and processed by the right hemisphere.
The visual cortex
The visual cortex is the main part of the brain responsible for the interpretation
of the information coveted from the retinal input. It is comprised of several
cor-tical areas: the primary visual cortex (V1), V2, V3 ,V4 and V5. Each area has a
specific function for e.g. contrast and orientation detection, motion recognition,
pattern recognition, etc. Besides the visual cortex, there are other parts of the
brain that contribute to human vision. One such part is the superior colliculus, which represents a primitive visual area, capable of detecting if the eyes see
some-thing, but not what that actually is. This area also receives auditory information
detected, increasing the perceptual experience. Therefore, these cells are called
the multisensory cells.
2.1.2
Visual perception
As mentioned earlier, the highest concentration of the photoreceptors in the eye
is in the foveal region. Consequently, this region has the highest visual acuity,
and moving further from the fovea the acuity rapidly decreases. The phenomenon
of the foveal vision is also known as the internal spotlight [Jam90, HB89]. The area of the foveal vision covers only 2 degrees of the visual field. This low angular
sensitivity is compensated by the rapid eye movements called saccades. These movements are extremely fast (up to 600 degrees per second) and last from 10
to 100ms. However, most of the viewing time is spent on fixations, whose length ranges from 150 to 600ms.
Human perception is rather complex and helps guide the cognitive aspect of
seeing. It is constructive and content dependent, grouping things together and
looking at the elements with regards to their surrounding features, giving sense
to what is observed. Visual perception can be divided into two parts: spatial and
temporal perception.
Spatial visual perception
As described in [BS06], there are three stages in seeing things: detection, dis-crimination and identification. When we need to detect if a mug is on the table, we use the first, lowest level process - detection. If we need to distinguish the
blue mug from a set of mugs, we need to use discrimination. Furthermore, if we
need to find a specific mug, we use a process of identification. However, all these
processes happen very quickly and automatically, without us being aware of it.
input information and provide a feedback which initiates our reactions.
Wavelength sensitivity Spatial acuity Temporal acuity 400nm - 700nm visual angle of 1 minute [BS06] 26Hz [FN05]
Table 2.1: The basic properties of the human visual system.
Spatial perception highly depends on visual attention (discussed in Section
2.3). However, there are some other factors, such as spatial frequency, which
might influence the perception [LM00]. In computer graphics, the spatial
fre-quency is particularly important, as it directly affects the level of details or the
image sharpness. In humans, a visual angle of one minute is the threshold of
spatial visual acuity, see Table 2.1.
Temporal visual perception
Numerous stimuli that we are exposed to on a regular basis, such as TV, computer
and mobile displays, cinema, etc., are not continuous. They display visual content
at certain rates called temporal frequency (also called just frequency or frame
rate). For example, the standard cinematic frame rate is 24 fps (frames per
second), standard TV frequency is 25 fps, HDTV works at 50 or 60 fps, while
video games use even higher frame rates. Although the threshold of the temporal
visual sensitivity has been shown to be 26Hz [FN05] (see Table 2.1), we perceive
these stimuli as continuous thanks to the phenomenon called the flicker fusion. The reason for this is thepersistence of vision, which is the ability of the retina to retain an image for a period of 1/20 to 1/5 a second after the exposure [Rog25].
The continuous appearance of the stroboscopic display, also called the
ap-parent motion, where two or more distinct flashing stimuli are perceived as one
dynamic stimulus, is explained in [SD83, AA93, SPP00, Get07]. Alterations in
According to Bloch’s law, for example, the duration of the stimulus can affect
2.2
Human auditory system
Sound is a perceptual experience caused by disturbance in air pressure, that
results in the physical energy. In order to audible it requires a sound source
and a perceiver [BS06]. Unlike the eyes, that can be shut to block incoming
light, our ears are constantly exposed to sound. A sound can differ in many
properties, such as location, loudness, rhythm, complexity, duration, etc. It is
an important modality which helps us to learn about an environment and to
identify surrounding objects and their features. It provides both cognitive and
affective information. Furthermore, it has its visual component, resulting in an
image creation in our mind[BS06].
This section presents the basic properties of sound, sound perception and the
human auditory system. More details can be found in [Moo82,Yos00,Alt04,BS06].
2.2.1
Sound properties
Physical properties
Every sound is created by mechanical oscillations of an object in elastic medium,
such as gas, liquid or solid. These oscillations increase pressure in a medium
and compress molecules which start to vibrate and transfer the vibration to
surrounding molecules. This results in a wave creation, see Figure 2.6.
A simple sound can be represented as a sine wave or a sinusoidal vibration,
see Figure 2.7. This type of sound is also called a pure sound and is heard rather
rarely in nature. The sinusoid is characterised by three properties: frequency,
starting phase and amplitude.
Frequency Every sinusoidal oscillation has two extremes calledcompression
Refraction Source
Compression
Amplitude
Max pressure
[image:39.595.126.514.131.337.2]Min pressure
Figure 2.6: An illustration of wave creation: The number of molecules displaced by a vibration determines the amplitude of a sine wave. After [Alt04].
refractions is called the soundwavelength (λ). When a wave passes through both peaks and comes to its initial position, it has completed one cycle. The number of cycles that a wave passes through in a certain time is called frequency. In theory, humans can hear frequencies from 20Hz (20 cycles per second) to 20KHz
(20,000 cycles per second), see Table 2.2. However, in practise, the frequency
range of most humans is between 35Hz to 17KHz, which decreases further with
aging. The time of one cycle is called period (Pr). The relationship between frequency and period is given in equation 2.1.
f = 1
P r (2.1)
The speed of the wave propagation through a medium, called the speed of
sound (c), affects the wavelength and can be represented as:
λ = c
String pulled
Molecules at rest
String released
Compression (maximum preasure)
String released
Rarefaction (minimum preasure)
Sound preasure (amplitude)
Time
One complete cycle Wavelength (distance)
[image:40.595.184.453.212.587.2]Frequency (time)
Frequency Vertical spatial Horizontal spatial Temporal sensitivity acuity (elevation) acuity (azimuth) acuity 20Hz - 20kHz angle of 0.97◦ [PS90] angle of 3.65◦ [PS90] 89.3Hz [FN05]
Table 2.2: The basic properties of the human auditory system.
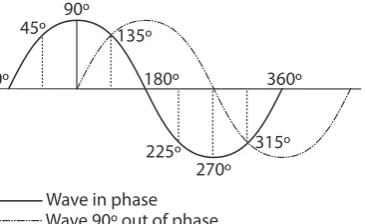
Phaseis relative difference in starting points of the cycles of two sound waves. If two waves start their cycles at the same time, they are in phase. Since one period corresponds to one full circle, phase is measured in degrees. Therefore, a
sine wave which is late for half of the period has the phase of 180◦, while the one
which is late for a quarter of a period has the phase of 90◦, see Figure 2.8. Some
other sounds, called periodic sounds, could also have this repetitive feature, and
therefore a phase can be defined for them.
0º
45º 90º 135º
180º
225º 270º
315º 360º
Wave in phase Wave 90º out of phase
Figure 2.8: Two sound waves: The first wave is in phase; the second wave is 90◦ out of phase. After [Alt04].
Amplitude represents theintensity of a vibration. The more molecules that are displaced, the higher the amplitude is. On the sinusoidal representation,
amplitude is the difference between the maximum height (crest) and the depth
(trough) of the wave.
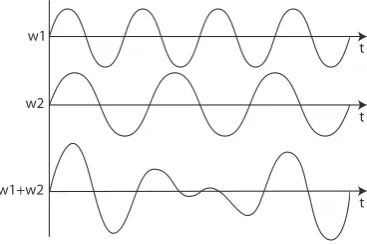
Although pure tones exist, we are far more often exposed to complex sounds
in environments. These sounds cannot be represented by a single sine wave, and
frequencies, the resultant sound wave will look like that shown in Figure 2.9.
The wave looks as if it was a single sine wave with changing amplitude. Such a
stimulus is called a beating sound, and it is perceived as a tone whose loudness is beating. However, this must not be mistaken with thebeat used in music, which represents a basic time unit of a piece. In this thesis, the term beat will be used as in music.
w1
w2
w1+w2
t
t
[image:42.595.223.407.271.393.2]t
Figure 2.9: Wave interference: w1 and w2 interfering waves; w1+w2 resultant wave.
Complex sound waves can be decomposed into a series of sine waves with
specific frequencies, phases and amplitudes using Fourier analysis. This analysis
is used primarily in Digital Signal Processing (DSP) and is beyond the scope of
the thesis. More details can be found in [Smi97].
Perceptual properties
The physical properties of a sound can be measured and controlled, but
nonethe-less, the same sound can be perceived differently by different individuals. This
is because the perceptual properties are subjective and require psychophysical
evaluation. The components that influence sound perception include: loudness,
pitch, harmonics, timbre, rhythm, sound envelope and speed.
percep-tion. The human ear is not equally sensitive to different frequencies (Figure 2.10),
and therefore tones presented at 100 Hz, 52 dB; 1000 Hz, 40 dB; and 4000 Hz, 37
dB are perceived as equal in loudness [Yos00]. This phenomenon is called equal loudness principle. Another factor, influencing the loudness perception is the
auditory masking. If a tone at 1000 Hz is masked by a broadband noise, which is a sound perceived as equally loud at all frequencies, its hearing threshold will
be shifted for 40 dB. Finally, the duration of the exposure to a tone modifies
its loudness perception. This phenomenon, where a sound loudness level is
per-ceived as lower by the time being presented, is called the loudness adaptation. This happens because our auditory system automatically adjusts to the noise
level in order to protect itself.
+10
0
-10
-20
-30
20 50 100 200 500 1K 2K 5K 10K 20K
Frequency (Hz)
Response (dB)
Figure 2.10: Response of the human ear to different frequencies. Inspired by Figure 2.3 from [Alt04].
Pitchis a relative, perceived tonal lowness or highness of a sound, mostly de-fined by frequency. Frequencies can be divided into three groups: low, midrange
and high. For a pure tone, the higher the frequency, the higher a pitch is
per-ceived. However, a complex sounds, such as a note played on a piano, comprises
of one predominant frequency called the fundamental frequency or the first har-monics and its resonant frequencies - harmonics. However, if we remove the fundamental frequency, we will still perceive the same pitch.
same pitch, duration and loudness can have different timbre. For example, the
same tone played on a piano, guitar or a trumpet will have a distinct sound.
Sound envelopeis another factor that influences the timbre of a sound. It is usually represented with three or four stages, see Figure 2.11. Attack is the way a sound is initiated by the sound source. Initial decay follows the attack and is a slight decrease in the sound intensity. Sustain is the stage of a relatively constant dynamics of the audio. After the sound source becomes inactive, the sound starts
to diminish. The time from that point until complete silence is termedrelease or
decay.
Time
A
mplitude
Envelope Attack Initialdecay Sustain
Release (Decay)
Figure 2.11: Sound envelope components: Attack, Initial decay, Sustain and Release (Decay).
Rhythm Any music can be divided into 2 components: melody and rhythm. Both of them are highly important for “communication” via this medium. Rhythm
in music refers to the temporal patterning of sound, and involves beat (pulse),
pace (beat rate, tempo) and pattern. It can exist without melody and can be
found in a number of contexts, such as heart beat, walking, speech, drums, etc.
2.2.2
Peripheral auditory anatomy
The Human Auditory System (HAS) comprises three parts: the ears; the auditory
nerves; and the brain. The ear consists of the outer ear, middle ear and inner
and the ear’s anatomy will be briefly explained. More details can be found in
[Moo82, Yos00, Alt04, BS06].
semicircular canals
vestibule apparatusvestibular
vestibulocochlear nerve cochlea oval window round window eustachian tube auditory ossicles tympanic membrane
external auditory canal lobule
tragus helix
temporal bone
outer
ear middleear inner ear
auricle
Figure 2.12: The anatomy of the human ear. From [Bri11a].
Outer ear
The outer ear is the visible part of the ear. The most noticeable, a shell-like part,
is the pinna. The pinna is mostly used for sound localisation. It differs in shape amongst individuals, and therefore, each individual hears each sound differently.
A sound, reflected off of the pinna, is further channeled down theear (auditory) canal. The ear canal is around 7mm in diameter, with its resonant frequency around 3,000Hz. Hence, the highest sensitivity at this and nearby frequencies.
Middle ear
The middle ear is an air-filled chamber, which connects the outer and the inner
ear. On one side, the tympanic membrane closes the “entrance” to the middle ear.
Similarly, another tiny membrane, called the oval window, separates the middle ear from the liquid-filled inner ear. The three smallest bones in the human body,
calledossicles, bridge these two membranes. The liquid in the inner ear produces more resistance to the wave movement than the air, because of its higher molecule
density. Therefore, the ossicles, besides transmitting, also amplify the vibrations
from the outer ear into the inner ear. The ossicles consist of three bones: hammer
(malleus), anvil (incus) and stirrup (stapes). The hammer is attached to the tympanic membrane and its vibrations are initiated by the membrane movement.
The anvil is further bound to the hammer by ligaments. The last one in the
chain is the stirrup, whose footplate is lying on the oval window. In order for the
middle ear to function correctly, the air pressure must be equal to the atmospheric
pressure in the ear canal. The mechanism for the pressure equalisation is provided
by theEustachian tube, the small canal connecting the middle ear and the throat. Another important mechanism, embedded into the middle ear is the acoustic reflex. Its function is to dampen the sound level entering the inner ear. The acoustic reflex includes two tiny muscles: the tensor tympani, attached to the
eardrum; and the stapedius, attached to the stirrup. When the ear is exposed
to a high level of noise, these two muscles contract, stiffening the eardrum and
reducing the movement of the stirrup.
Inner ear
The inner ear consists of few parts and two major functions: maintaining the
first function is achieved through a specialised sensory system calledsemicircular canals. The three liquid-filled, “looped” canals behave as an accelerometer, used in vehicles, navigation and other engineering systems. It also helps us to maintain
the fixation on an object of interest while moving our head in any direction.
Figure 2.13: Illustration of the human cochlea.
The other part of the inner ear, responsible for hearing, is the cochlea, see Figure 2.13. The cochlea is spiral shaped and comprises of three chambers:
vestibular canal, cochlear duct and tympanic canal. The first and the last are connected at the end (a place called the apex). The vibrations from the middle
ear are transmitted through the oval window, located at the base of the vestibular
canal. At the base of the tympanic canal there is another tiny membrane, the
round window, that compensates the pressure caused by the inward movement of the oval window. The cochlear duct is a separate chamber, containing a different
type of liquid. It is separated from the tympanic canal by a basilar membrane.
On top of the basilar membrane there is a structure namedthe Organ of Corti, which contains the receptors - hair cells - and transforms the fluid vibrations into
outer hair cells (OHC). Although the OHCs are more numerous (around three
times), 95% of the auditory nerve fibers are attached to the IHCs. A vibration of
the oval window creates a travelling wave along the basilar membrane.
Depend-ing on the wave frequency, it reaches its peak at a certain distance displacDepend-ing
the basilar membrane which stimulates hair cells at that location, resulting in
a tone perception. The relation between the frequency and the length of the
basilar membrane is calledtonotopic organisation. The same principle applies to the intensity of a sound. The higher the intensity, the higher the amplitude of
the travelling wave, and the stronger the hair cells stimulation. The neural
in-formation from both ears is further carried by the auditory nerve to the auditory
cortex.
2.2.3
Auditory perception
In our everyday life, we are constantly exposed to sounds, which are being
pro-cessed by the brain whether we listen to them or not. There are two major
elements of sound that we are interested in, when listening: meaning - what
we hear; and location - where is it coming from. Hearing sensitivity, auditory processing and localisation will be briefly explained below. More details can be
found in [Moo82, PISI00, Tsi07, RS08].
Spatial hearing and localisation
Although both sound and light are omnidirectional, our auditory system can
receive information from all the direction around. This is different from our
visual system. However, the HAS has mechanisms to filter certain sounds and
be missing, without any perceivable effect to a listener. This is possible due
to the continuity illusion phenomenon [KT02]. There are two important sound
characteristics that influence the auditory localisation: spectral bandwidth and
intensity [RS08]. The broader the bandwidth and the louder the sound is, the
better our ability for sound localisation. The main factors that affect sound
localisation are: binaural and monaural cues, reverberation and inter-sensory
interaction.
Interaural intensity difference (IID)is one of the binaural cues for sound localisation. Depending on the azimuth of a sound source, each ear receives the
sound at a different intensity level, except for the sounds originating directly
ahead or behind us, see Figure 2.14. This cue is stronger for the higher
frequen-cies, since the wave length of the low frequencies are longer than the diameter of
the head, which, in that case, does not impede the waves.
Interaural time difference (ITD)is a similar cue to the IID, where one ear receives the sound slightly earlier than the other, see Figure 2.14. Similarly to the
IID, the highest difference - around 700 µsec occurs when the sound originates
from the side of the head.
Although being a powerful tool for sound localisation, binaural cues do not
provide sufficient information about the sound source elevation. Monaural cues,
however, can provide us with that information using head-related transfer func-tions (HRTFs). As the sound travels it reflects off the head, body and pinna. During these reflections some of the energy is lost which leaves the sound
spec-trum suitable for sound localisation. In certain ambiguous positions, such as from
ahead or from the behind of the head, where the IID and ITD are the same, head
movement breaks the symmetry and resolves the confusion.
Another important element of sound localisation is distance perception. This
R ear
L ear
R ear L ear
ITD A1
A2
IID=A1-A2 t t Intensity
Figure 2.14: Bianural cues: Interaural Intensity Difference (IID) and Interaural Time Difference (ITD).
When listening to a sound indoors, we rely on the reverberation. However, this
cue is missing in outdoor environments, and it is substituted by sound
inten-sity and movement of the sound source. Although this can be useful in sound
localisation, it behaves rather poorly for unfamiliar sounds.
Despite these localisation techniques, the spatial auditory resolution is very
limited. According to Perrott and Saberi, the minimum vertical audible angle
without change in elevation is 0.97◦ and the minimum horizontal audible angle
without change in azimuth is 3.65◦ [PS90]. This makes hearing substantially
weaker than vision in spatially related tasks. However, the temporal resolution
of the HAS is rather high compared to the HVS, and according to Fujisaki et al.
it is 89.3Hz [FN05].
Temporal auditory processing
Temporal auditory processing can be divided into temporal integration and
tem-poral resolution. Temtem-poral integration is the ability to integrate acoustic features
of a particular sound over time. It has been reported that for humans this time
varies between 50 and 200ms [RS08]. One example of temporal integration is
a forward masking paradigm. If the observer is presented with two sequential
sounds, his/her ability to detect the second stimulus will depend on the duration
of the first one. This happens because of the adaptation to energy at the
frequen-cies present in the first sound (masker). Additional parameters that influence the
masking intensity are: intensity and duration of the masker, duration of the
in-terstimulus interval, duration of the second stimulus (target), the onset interval
between the masker and the target (duration of the masker plus interstimulus
interval) and interstimulus interval plus duration of the target.
Opposite to temporal integration is temporal resolution, which is the ability
to resolve time. Using experiments to measure the ability of gap detection in a
sound, it has been shown that humans can detect a silent period lasting a few
2.3
Attention and Perception
There are three stages in human sensory information processing: sensation,
per-ception and cognition. Sensation is the physical stimulation of the sensory organs.
Perception is a set of processes by which we deal with the information sensed in
the first stage. Cognition is the most complicated stage in which the information
has been fully processed and possibly used for learning, decision making, storing
into memory, etc. [MGKP08].
William James in his book The Principles of Psychology speaks about aten-tion: “Every one knows what attention is. It is the taking possession by the mind,
in clear and vivid form, of one out of what seem several simultaneously possible
objects or trains of thought. Focalization, concentration, of consciousness are of
its essence. It implies withdrawal from some things in order to deal effectively
with others, and is a condition which has a real opposite in the confused, dazed,
scatterbrained state which in French is called distraction...”. In his other book
Psychology he defines perception as “the consciousness of particular material things present to sense” [Jam92]. Research in psychology has considered the per-ception of individual senses separately, and across different modalities. Although
the understanding of the perception of individual senses is crucial, in reality, we
are rarely exposed to a stimuli affecting solely one modality. Instead, few or all
of the senses are stimulated simultaneously, where even if one modality “fails”,
the information is received and processed unmistakably, due to the cross-modal
integration, see Section 4.2. Additionally, stimulation in one sensory modality
can affect the perception in other. This will be discussed in Section 4.1.
Perception can also be affected by other factors, e.g. by user’s beliefs and
experience, or by value and need. This was described in 1947 by Jerome Bruner
paper inspired hundreds of experiments, which proved that e.g. poor children
perceive coins as bigger than rich and that a hungry person is more likely to see
food.
Our senses are exposed to a number of different stimulations at almost every
moment. However, even though they affect our sensory organs, due to attentional
limitations they may never get processed so that we experience them [Jam92].
This mostly depends on our consciousness and the focus of the senses and
our mind, which is called attention. It can be described as a filter to perception,
which helps us to process only relevant information and ignore the rest. The
attention can be: completely concentrated, where even the body injuries can
remain unnoticed due to the extreme focus of interest; dispersed attention, where
the mind is emptied and a person is thinking of nothing - we look and listen but
none of what we “see” and “hear” is being absorbed and processed; and the
attention that is between these two extremes [Jam92, Jam90]. Depending on the
intent, the attention can be intentional, endogenous, top-down attention, where
the observers voluntarily orients attention towards a spatial location relevant to
the task or action they are undertaking; and unintentional, exogenous, bottom-up
attention, in which it is involuntarily captured by a certain event [The91].
2.3.1
Attentional capture
The endogenous attention is selective, which means that we are able to focus
our attention in order to process some stimuli more than other. Additionally,
Pashner characterised attention capacitively limited and effortful [Pas99]. The
latter means that continuous processing of an even stimulus, even if it is enjoyable,
may lead to a fatigue. An example of the endogenous attention is seen in the
inattentional blindness phenomenon, firstly introduced by Mack and Rock, which
performing a task irrelevant to the distracting object [MR98]. In the experiment,
participants were asked to judge the size of the arms of a cross briefly presented on
a computer screen. The majority of the participants failed to notice unexpected
objects appearing on the screen along with the cross. The research was extended
with more natural displays by Simons and Chabris in 1999, confirming the same
hypothesis [SC99].
The exogenous attention is mostly attracted by a salient objects or their
salient features, or by a sudden motion [Yar67, IK01, Sch01]. This means that
if there is a red ball on the white background, our gaze will be shifted towards
it, or if in the static display an objects starts moving, our attention will
unin-tentionally move towards the moving object. According to Koch and Ullman,
exogenous visual attention depends on colour, intensity, orientation and
direc-tion of movement, which form topographical, cortical maps called feature maps
[KU85]. These maps combined form a saliency map, which can be used to
pre-dict the areas of an image which have the highest probability of attracting users’
attention. Itti et al. developed a computer implementation of the model for
static images [IKN98, IK00, IK01]. An extended version of the framework using
Aleph map, which includes the temporal component, was developed by Yee et al.
[YPG01].
Neither of the two attentions is constant and they change over the time.
Shift-ing the visual attention, is a particularly important process, as it can significantly
affect our visual perception. There are two types of visual attentional shifts: overt
and covert shift. If the visual attention is shifted by the eye movement, where the
object of interest falls in the foveal region of the eye, the overt attention is used.
On the other hand, if we do not require a high level of acuity, we can shift our
attention without the gaze shift. This process is known as the covert attention.
2.3.2
Attentional resources and limitations
As mentioned earlier in this section, our attentional capacity is limited. This
means that an attentional pool exists, which, once it gets saturated, cannot
re-ceive any further information. However, researchers are not sure on which level
this pool operates. There are two parallel, though opposed views on the
mat-ter. The first one claims that these resources are inter-modal, shared between
modalities, and the second that resources are individual, intra-modal, where each
modality has its own attentional pool. However, there are number of
parame-ters affecting the evaluation of this kind, such as detection versus discrimination
paradigm and forgetting in short-term memory [MW77].Furthermore, there is an
example of how cross-modal attentional links depend on type of attention, such
as covert versus overt and endogenous versus exogenous attention [DS98]. The
authors show that shifts of covert attention in one modality induce the attentional
shift in other modalities. Similar results can be found in [SM04].
Inter-modal
Some models of attention impose that our attention operates on a global level and
is not divided across multiple senses. This means that the performance of a task
requiring attention for one modality will be affected by concurrent task in some
other modality. For example, speaking on the mobile phone can disrupt the car
driving performance, due to the attention diversion [SJ01]. Additionally, there is
a difficulty in attending to different locations in the two modalities, e.g. when the
audio originates from the left hemisphere and video from the right hemisphere,
and vice versa [DS94]. They used recorded audio, played from either left or
right side, with active (synchronous lip-movement) and passive (meaningless lip
showed that the further the positions of auditory and visual stimuli are, the
easier it is to selectively attend to a particular modality [SJD00]. These findings
do not explicitly prove the existence of a supramodal attentional systems, but
they rather indicate that a spatial link between visual and auditory attentional
systems exists.
Intra-modal
On the other hand, Alais et al. in a research dealing with attentional resources
for vision and audition [AMB06], claim that there is no attentional
dependen-cies between modalities, at least for low-level tasks, such as discrimination of
pitch and contrast. In their experiment, they showed that there was no
signif-icant difference in performance between single stimulus and multi-modal dual
task. Nevertheless, when two tasks within the same modality were assigned, the
performance was significantly reduced, which indicates that there might be some
attentional limitations within the modality when performing a dual task. Similar
results can be found in [AAR72, BH98, DMW97, BA06].
A possible reason for different findings in these two groups might be the
way the experiments were set up. In the first group ([DS94, SJD00]) subjects
were directing attention to different spatial locations, while in e.g. [BA06], the
attention was distributed across the entire sensory field, with as little change in
spatial location of the stimulated regions as possible.
When observing visual and spoken letters presented simultaneously, there is
no significant difference in performance when both letters along with the
modal-ities must be reported or when either visual or auditory letter has to be reported
regardless of the modality [LMBB03]. Additionally, the modality confusion is often experienced, where spoken letter is reported to be seen or visual letter to
2.4
Summary
This chapter provided an overview of the HSS, attention and perception. The
anatomy of both HVS and HAS was briefly presented, followed by the perceptual
factors in both spatial and temporal domains. Additionally, sound properties
were presented. These concepts are important for the better understanding of
the following chapters. In this chapter the different types of attentional captures
and shifts have been described, and their implications have been discussed.
Fur-thermore, the attentional limitations were explained, presenting the concepts of
High-Fidelity Rendering
Figure 3.1: Physically-based rendering examples: images rendered using Path tracing method (courtesy of Piotr Dubla) (top left and bottom right); an im-age rendered using Radiance rendering packim-age [War94] (top right); an imim-age rendered using Mental Ray (courtesy of Jassim Happa) (bottom left).
Rendering is the process of digital image generation from a description of 2D
or 3D virtual space. This description generally comprises geometry, materials,
lighting properties and camera attributes. Rendering can be divided into two
![Figure 2.1: The human eye. From [Bri11b]](https://thumb-us.123doks.com/thumbv2/123dok_us/9680555.469683/31.595.119.502.122.405/figure-the-human-eye-from-bri-b.webp)
![Figure 3.1: Physically-based rendering examples: images rendered using Pathtracing method (courtesy of Piotr Dubla) (top left and bottom right); an im-age rendered using Radiance rendering package [War94] (top right); an imagerendered using Mental Ray (courtesy of Jassim Happa) (bottom left).](https://thumb-us.123doks.com/thumbv2/123dok_us/9680555.469683/58.595.134.504.340.579/physically-rendering-examples-pathtracing-radiance-rendering-imagerendered-courtesy.webp)