1
Faculty of Electrical Engineering,
Mathematics & Computer Science
Developing a smart rainwater
buffering system for the
municipality of Enschede
Gelieke Steeghs B.Sc. Thesis
July 2017
Abstract
This bachelor thesis describes the process of developing a monitoring and control infrastruc-ture for a smart rainwater buffering ecosystem for the municipality of Enschede. There was specifically looked at 1) how rainwater buffers can be made ’smart’, and 2) how the system’s data can be presented to the municipality. The purpose of the system is to reduce the strain on the sewerage system of the Oldenzaalsestraat, in order to combat urban flooding. As such, the system was supposed to be implemented on the private property of citizens living in the neighbourhoods De Bothoven and Velve-Lindenhof. A group of four people worked on the project. This report is written from the perspective of group member Gelieke Steeghs.
Literature research, neighbourhood research and interviews with stakeholders led to-wards the following concept: a system of smart rainwater buffers which adapt their perfor-mance according to the predicted rainfall and show their data on an interface. A prototype of the system was realised using a rainwater barrel, called ’Tonnie’. The barrel contains sen-sors to measure the water level as well as the outflow to the sewerage system, the garden and through a faucet. Furthermore, the barrel contains controllable valves to the sewerage system and garden. When rainfall is predicted for the next 2 hours, the valves are opened to release water and create sufficient capacity for the expected rainwater. This precipitation-dependent behaviour gives the buffer its intelligent nature. The data produced by the rain barrels is presented in a graphical way on two web interfaces: one for the municipality and one for the citizens. The overall buffer performance can be monitored by the municipality on their interface, while the buffers can be monitored and controlled locally by the citizens on theirs.
Acknowledgements
There are several people who I would like to thank for their help and contribution to this graduation project. First of all, I want to thank my supervisor Richard Bults and my critical observer Hans Scholten. They provided me with helpful feedback and facilitated communi-cation with stakeholders.
Then, I would like to thank the fellow students I worked on this project with, my partners in crime: Felicia Rindt, Jeroen Klein Brinke and Dennis van der Zwet. Without this team, the project would not have been possible. If it were not for their dedication, motivation and carefully timed doses of humor, working on the project would have been much more boring and tedious. I really enjoyed ’doing business’ with you.
Furthermore, I would like to thank Hendrik-Jan Teekens and Hans Koetsier from the municipality of Enschede for providing me with information sources, giving me input on the design process and helping me out during the user test.
I am very grateful for all the advice and help that Alfred de Vries provided during the construction of the buffer.
Moreover, I would like to thank the citizens and neighbourhood councils in De Bothoven and Velve-Lindenhof for listening to our story and filling in the survey.
Special thanks to Peter Hooijschuur and Laura Beunk for giving me feedback on my report, which allowed me to dot the i’s and cross the t’s.
Contents
Abstract iii
Acknowledgements v
1 Introduction 1
1.1 Problem statement . . . 1
1.2 Goal . . . 2
1.3 Research questions . . . 3
1.4 Report organisation . . . 3
2 Context analysis 5 2.1 Background research . . . 5
2.1.1 Past and current water problems and management in Enschede . . . 5
2.2 Literature review . . . 6
2.2.1 Novel approaches to urban rainwater management . . . 7
2.2.2 Assessing rainwater buffering solutions . . . 8
2.2.3 Making rainwater buffers intelligent . . . 10
2.2.4 Barriers in the transition towards water smart cities . . . 11
2.3 State of the Art . . . 12
2.3.1 Treating urban rainwater . . . 12
2.3.2 Rainwater solutions with intelligence . . . 12
2.3.3 Rainwater solutions without intelligence . . . 14
2.4 Conclusion and relevance of the research question . . . 17
2.4.1 Conclusion background research . . . 17
2.4.2 Conclusion literature review . . . 17
2.4.3 Conclusion state of the art . . . 18
2.4.4 Relevance of the research question . . . 18
3 Methods and Techniques 21 3.1 Creative Technology Design Process . . . 21
3.1.1 Ideation . . . 21
3.1.2 Specification . . . 21
3.1.3 Realisation . . . 22
3.2 Stakeholder analysis . . . 22
3.3 Surveys . . . 22
3.4 Interviews . . . 23
3.5 PACT and FICS scenarios . . . 23
3.5.1 PACT . . . 23
3.5.2 FICS . . . 24
3.6 MoSCoW . . . 24
3.7 Functional testing . . . 24
3.8 User testing . . . 24
3.8.1 User test protocol . . . 24
3.8.2 Usability heuristics . . . 25
4 Ideation 29 4.1 Stakeholder analysis . . . 29
4.2 Brainstorming process . . . 29
4.2.1 Focus . . . 29
4.2.2 How can rainwater buffers be made ’smart’, so they adapt their perfor-mance and capacity according to the anticipated rainfall? . . . 30
4.2.3 How can the system’s monitoring data be processed and presented to the municipality of Enschede? . . . 32
4.3 Neighbourhood research . . . 32
4.4 Interviews and survey with stakeholders . . . 34
4.4.1 Interview with the municipality . . . 34
4.4.2 Survey with citizens . . . 35
4.4.3 Interview with housing corporation Domijn . . . 36
4.5 Concept . . . 36
4.5.1 A system of smart rainwater barrels . . . 37
4.6 PACT analysis . . . 37
4.6.1 People . . . 37
4.6.2 Activities . . . 39
4.6.3 Context . . . 40
4.6.4 Technologies . . . 40
4.7 PACT-FICS scenario . . . 41
4.7.1 The citizens . . . 41
4.7.2 The municipality . . . 42
5 Specification 45 5.1 Requirements . . . 45
5.2 Functional block diagram . . . 45
6 Realisation 53
6.1 Software and hardware components . . . 53
6.1.1 Hardware . . . 53
6.1.2 Software . . . 54
6.2 Interface design . . . 55
6.2.1 Feedback on the second design . . . 56
6.2.2 Final design . . . 57
6.3 Data storage structure . . . 61
7 Evaluation 63 7.1 Functional test . . . 63
7.2 User test protocol . . . 64
7.2.1 Purpose . . . 64
7.2.2 Test setup . . . 64
7.2.3 Participants . . . 64
7.2.4 Interaction device . . . 64
7.2.5 Interaction method . . . 65
7.2.6 Data collection method . . . 66
7.2.7 Results . . . 66
7.3 Conclusion . . . 69
7.4 Iteration on the final interface design . . . 70
8 Conclusions and recommendations 71 8.1 Conclusions . . . 71
8.2 Recommendations . . . 73
References 75 References . . . 75
Appendices A Categories and measures of treating rainwater 79 B Pictures of De Bothoven and Velve-Lindenhof 81 C Iterations of the interface design for the municipality 85 D Notes of meetings with the municipality 89 D.1 Monday 8/05/2017 . . . 89
D.2 Thursday 18/05/2017 . . . 91
G Functional test 103
H Consent form (in Dutch) 107
I Survey for user testing 109
Chapter 1
Introduction
In this chapter, the context of this graduation project will be explained by describing the prob-lem statement, the goal and the research questions. Furthermore, the report organisation is described.
1.1 Problem statement
One of the main challenges that cities all over the world have to face today is urban flood-ing. Due to climate change, the average precipitation increases, as well as the frequency of extreme rain showers. Next to this, the temperature is rising, leading to situations of drought (van den Hurk et al., 2014). Dutch municipalities have to adapt to these changing circumstances, making sure that their city is rain-proof. Among them is the municipality of Enschede, a city with almost 160,000 inhabitants in the east of the Netherlands (Centraal Bureau voor de Statistiek, 2016).
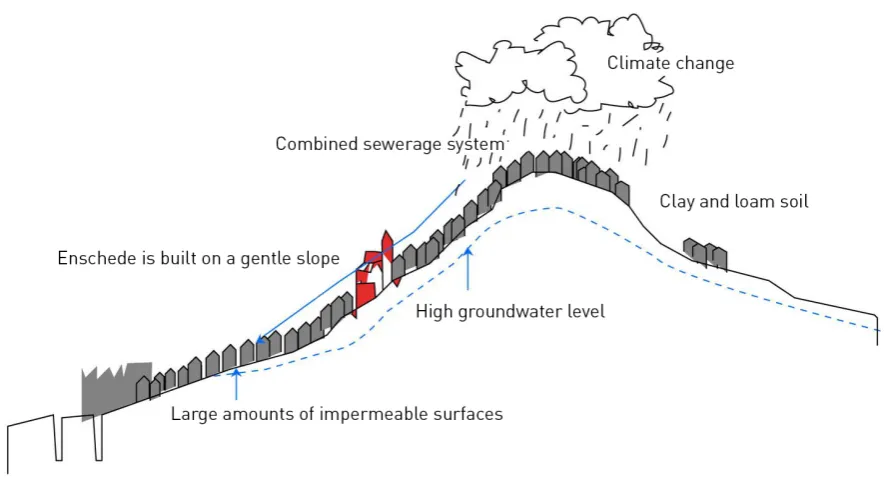
The city of Enschede is built on a push moraine, a gentle slope. Therefore, there is a height difference of around 44 meters between the highest and the lowest point of the city (Gemeente Enschede, 2012a). Additionally, most neighbourhoods in the city have a combined sewerage system, meaning that sanitary water and stormwater end up in the same pipe. This causes extra pressure on the sewerage system. Furthermore, the rate with which water infiltrates into the ground is quite low, due to large amounts of impermeable surfaces and the clay and loam soil in Enschede (Gemeente Enschede, n.d.). As a result, heavy rainfall leads to the flooding of streets as well as buildings, causing damage and dangerous situations.
Aside from extreme rain showers, Enschede is dealing with a high groundwater level, which causes flooding in the basements of citizens (Gemeente Enschede, Lensink, TV En-schede FM, & TC Tubantia, 2010). The groundwater level in the city is naturally high. In the late 19th century, there used to be a lot of textile plants that took care of this. These plants obtained water by using pumps, lowering the groundwater level and enabling the city to expand. However, after the second World War, the textile industry collapsed and the groundwater level started to rise again.
Figure 1.1: Causes of the water problems in Enschede. Based on a figure from the munici-pality, translated to English (Gemeente Enschede et al., 2010).
In order to deal with this problem, Enschede joined KlimaatActieve Steden (KAS), or Climate Active Cities, cities that take measures towards climate mitigation and adaptation (STOWA, Unie van Waterschappen, & Ministerie van I & M, 2015). The municipality pointed out several bottleneck areas they want to work on in the upcoming years in their ’Water-programma’ (Gemeente Enschede, 2012b). In this report, water management goals are linked to concrete plans and activities that Enschede wants to carry out in the future. One of the bottleneck areas is in the city centre, around the Oldenzaalsestraat and De Heurne, where there are a lot of shops. The strain on the combined sewerage system here would be reduced significantly if the neighbourhoods east of this area would take up (a part of) the stormwater runoff. These neighbourhoods are De Bothoven and Velve-Lindenhof (see Figure 1.2) and they are the focus area of this graduation project.
1.2 Goal
Figure 1.2:The focus area of the graduation project, featuring the neighbourhoods De Both-oven and Velve-Lindenhof.
1.3 Research questions
Based on the problem statement and challenges, the follow research question and two sub-questions were formulated:
1. How to develop a monitoring and control infrastructure for a smart rainwater buffer-ing ecosystem that will be placed in the neighbourhoods De Bothoven and Velve-Lindenhof?
(a) How can rainwater buffers be made ’smart’, so they adapt their performance and capacity according to the anticipated rainfall?
(b) How can the system’s monitoring data be processed and presented to the municipality of Enschede?
1.4 Report organisation
Chapter 2
Context analysis
This chapter starts with a section on background information. Then, a literature review is conducted, as well as a review of the state of the art. Finally, the relevance of the research question is demonstrated and the chapter is concluded.
2.1 Background research
In this section, the extent of the water problems in Enschede is illustrated with several ex-amples. Furthermore, the way that the water management works in the city is explained.
2.1.1 Past and current water problems and management in Enschede
In the past few years, Enschede increasingly has had to deal with urban flooding events. For example, heavy rainfall caused water on the streets on June 20, 2013 (Wateruniversiteit Twente, 2016; RTV Oost, 2013). Another incident took place in May 2016; the Facebook page ’Gespot: Wateruniversiteit Twente’ reported that several streets in the city were flooded (Wateruniversiteit Twente, 2016).
In the 20th century, the municipality of Enschede already took measures to combat their water problems. They placed water retention basins (’bergbezinkbassins’) all around the city and implemented a combined sewerage system in several neighbourhoods. Furthermore, they researched the possibility of re-introducing the water pumps that the textile industry once used, in order to get rid of the groundwater surplus.
Table 2.1: Risk matrix for the Oldenzaalsestraat (Stichting RIONED & STOWA, 2015b).
location repetition time (years)
maximum water height (cm)
hour
(min) extent risk
T = 5 10-15 30 street/
neighbourhood high
T = 10 20-25 60 neighbourhood high
De Heurne and
Oldenzaalse-straat T = 100 20-25 60 neighbourhood moderate
innovative and bottom-up solutions are needed. In their sewerage report (’Gemeentelijk Ri-oleringsplan’) the municipality of Enschede describes their aims and plans concerning water management for the years 2016-2020 (Gemeente Enschede, 2015). They state two goals: 1) tackle the water problems in the areas with the highest risks and 2) make sure that the sewerage tax does not increase by more than 6.1%.1
In order to help reaching the first goal, Stichting RIONED and STOWA created a report in which they introduce the concept of risk-based management (Stichting RIONED & STOWA, 2015b). By using a risk matrix, the municipality can decide in which cases they take action and in which cases the risk is negligible. This risk matrix assesses water problems by looking at the severity of the organisational values (healthy & safety, quality of the living environment, finances and image & branding) and the frequency of the event (time T in years, how often does the event occur). The risk matrix for the Oldenzaalsestraat is shown in Table 2.1. To find out the severity and frequency of the event, the municipality makes hydraulic calculations using the software ’RainTools’. With this software, one can test whether a certain rainshower with a certain frequency results in water on the streets.
Concerning the second goal, there is a need for low-maintenance and low-cost solutions that are developed in close collaboration with the citizens themselves, using a bottom-up ap-proach. That is where this graduation project comes in. But first, a look will be taken at urban water management practices all over the world and the different ways to treat rainwater.
2.2 Literature review
The aim of this literature review is to get an overview of how municipalities and citizens can work together to combine smart or intelligent technology with flooding mitigation measures. This will be achieved by first looking at the newest practices in urban rainwater manage-ment. Case studies from all over the world are considered, as one city can learn from the other. Secondly, the factors that determine the success and failure of such systems will be explored. The steps that should be taken before a proper solution can be chosen are de-scribed. Third of all, a look will be taken at the possibilities of incorporating smart technology
1The sewerage tax is paid by the citizens of Enschede. It has been increasing consistently over the past few
into urban water management. Finally, it is investigated which barriers and challenges come up when transitioning towards ’water smart cities’.
2.2.1 Novel approaches to urban rainwater management
There are four recurring aspects in the novel approach to urban rainwater management that can be identified from the literature: 1) integrating different measures, 2) shifting the focus from centralised to decentralised systems, 3) treating water as a resource instead of waste and 4) using best management practices (BMPs) and low impact development (LID) strategies. All over the world, countries have been using one or more of these aspects in their urban rainwater management practices, as a response to the increasing occurrence of extreme rainfall and severe drought. To start off, the key element that is stressed by many studies is to take an integrated approach (Carmon & Shamir, 2010; van Leeuwen, 2017; Schuetze & Chelleri, 2013). According to Camon and Shamir, integrated water re-source management aims to improve the planned environment, reduce damage done by stormwater, improves and increases water resources and preserves the biodiversity. All these objectives are reached in a cost-effective way, and take the citizens into account.
Secondly, there is a focus on decentralised instead of centralised systems. The decen-tralised collection and retention of rainwater can help to avoid stress on the water cycle and improve climate resilience (Schuetze & Chelleri, 2013; Zeng, Tan, & Wu, 2007). According to Schuetze and Chelleri, floods and water shortages will be avoided: a surplus can be drained and seasonal storage of rainwater can be helpful during periods of drought. They argue that citizens will be self-sufficient in their water provision. Zenget al. support this, describing that
urban rainwater should be ’shared’ between human beings, animals and plants, but also be-tween the wet and the dry season. Both articles support the notion that the system should be in balance.
The third aspect is whether rainwater should be considered as a resource instead of waste. Carmon and Shamir and Shuetze and Chelleri consider it as a resource, but Zenget al. argue that rainwater should be used as both waste and a resource, in order to maintain
a healthy hydrological cycle. However, the first two articles are both from 2010 or later, while the last source is from 2007 and therefore not representing the latest insights. Also, the articles from Carmon and Shamir as well as Shuetze and Chelleri were published in journals about water management and the environment, while the article by Zenget al. was
published in the Journal of China University of Mining & Technology. As such, the claim that water should be considered as a resource seems more trustworthy.
Figure 2.1: Structural BMPs for stormwater runoff management:
(a) Cisterns, either 1) below or 2) above ground (Water Storage Tanks Inc., 2015; Underground water cistern, 2013),
(b) Rain barrel (Mackenzie, 2008),
(c) Storage beneath a structure (Brett Marin Ltd, n.d.) and (d) Vertical storage structures (The Tank Depot, 1998).
Agency (USEPA) as a leading approach. Typically, it is applied to pavements, roofs, pipes and the lawn area (Saraswat, Kumar, & Mishra, 2016). Clearly, urban rainwater management has changed in the last few decades and new standards have arisen. The four described elements should be taken into account when developing a new approach to rainwater man-agement in the city of Enschede.
2.2.2 Assessing rainwater buffering solutions
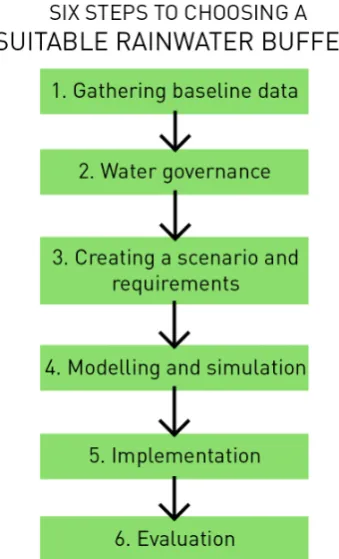
When choosing a suitable rainwater buffering solution, there are six steps that help to as-sess the options and take into account all relevant factors: 1) gathering baseline data, 2) water governance, 3) creating a scenario and requirements, 4) modelling and simulation, 5) implementation and 6) evaluation. Every step will be discussed in detail in this section and all steps are visualised in Figure 2.2.
Figure 2.2:The six steps that help by choosing the right rainwater buffer for a certain situa-tion.
amount of impervious surfaces (Saraswat et al., 2016; Schuetze & Chelleri, 2013; Palla, Gnecco, & La Barbera, 2017). Saraswat et al. write that the impervious surfaces directly
cause a reduction in the infiltration of water, as well as an increase in stormwater runoff by more than 50%. All these elements together determine the context in which the rainwater buffer will be implemented.
The second step is water governance. Water governance can be defined as ’the range of political, social, economic and administrative systems that are in place to develop and manage water resources, and the delivery of water services, at different levels of society and for different purposes’ (Rogers, Hall, & Global Water Partnership, 2003). This concept is explicitly mentioned by Saraswatet al. and Van Leeuwen. Carmon and Shamir support
this, adding that all relevant professionals (e.g. architects, hydrologists and urban planners) should be included and work together.
Thirdly, it is important to list objectives and requirements. Van Leeuwen and Shuetze and Chelleri propose to create a scenario, while Pallaet al. suggest to develop relevant criteria.
In any case, there are several ways to list objectives and requirements, as long as it results in a shared vision. By combining the results of the first three steps, a choice for a correct rainwater buffer can be made.
to Niemczynowicz, advanced calculation methods and modelling techniques are important for predicting how the system works in the hydrological-hydraulic domain. The simulation results can then be compared with the field measurements, as Carmon and Shamir as well as Saraswatet al. describe.
The fifth and sixth step constitute the implementation and evaluation of the devised rain-water buffer. Monitoring and evaluating are important for a strategic planning process (van Leeuwen, 2017; Palla et al., 2017). Together, the six steps will be a valuable aid in the development of a smart rainwater buffer for the municipality of Enschede.
2.2.3 Making rainwater buffers intelligent
Smart technology can be combined with rainwater buffering systems by the use of real-time (big) data, the Internet of things (IoT) and by means of intelligent sensing or metering. These three concepts are usually combined. First of all, in the transition towards a smart city, real-time data will become an important tool for real-time decision making. According to Niemczynowicz (1999), real-time control combined with local solutions can help to avoid flooding. Boyle et al. (2013) support this, adding that utilities consider data as a way to
decrease costs, have a more reliable water supply and limit their waste. Furthermore, big data will increase the efficiency of a city, because it enables countries to make better pre-dictions about the rain. Accordingly, the authorities will know earlier about potential flood events (Rathore, Ahmad, Paul, & Rho, 2016). As Rathore et al. write, this information can
then be spread throughout the country, warning citizens of extreme weather events. Water reservoirs are also managed by using data on rain levels, according to the author. However, currently only a few parties have a platform for monitoring and gathering data.
Secondly, the Internet of things is mentioned by several authors as a valuable attribute for urban water management (Rathore et al., 2016; Boyle et al., 2013; Ma, Yang, & Wang, 2017). By connecting objects to the internet, devices can communicate and data can be generated, as Rathoreet al. describe. Maet al. emphasise the role of IoT in the ’gradual
improvement of flood control and drainage function’ as it can help prevent waterlogging, provides operational services, increases security and makes monitoring and management easier. Figure 2.3 shows a schematic of a process where IoT is used for monitoring.
Third of all, intelligent sensing or metering is a new way to gather information. Geo-information science (GIS) technology is helpful when selecting and evaluating solutions for urban flooding (Saraswat et al., 2016). (Remote) sensors can be used for both real-time and historic data, and they can be combined in a wireless sensor network (WSN) in order to see patterns, as written by Rathore et al. A bit more specific is the field of intelligent
metering (IM), which concerns sensors used for reading water consumption (Boyle et al., 2013). According to Boyleet al., water service providers use this information to increase their
cost-efficiency. It can, however, also be used by the municipality for their climate mitigation strategies and decision making (Ma et al., 2017). It seems that intelligent sensing has several purposes.
Figure 2.3: Internet of things applied to a monitoring system (Ma et al., 2017).
urban water management. In the city of Chongqing in China, the flood control and waterlog-ging prevention worked better after an IoT-based system was implemented (Ma et al., 2017). In some cases, the data is already available, but not yet utilised in a proper way. However, real-time data generated by sensors and IoT devices together with historic data, form a great tool for decision making.
2.2.4 Barriers in the transition towards water smart cities
The transition towards water smart cities is not without problems. The barriers most fre-quently mentioned by the literature are the regulatory framework, the work and education paradigm and the people’s behaviour. Laws and regulations can make the implementation of a rainwater buffer quite difficult, as this usually requires changes in the built environment (Saraswat et al., 2016; van Hattum, Blauw, Bergen Jensen, & de Bruin, 2016; Carmon & Shamir, 2010). A weak institutional framework can make it hard for a country to sustainably use (storm)water, according to Saraswatet al. Carmon and Shamir support this, noting that
policies need to be revised in order to start using runoff as a resource.
Secondly, disruptive water measures often require changes to society as a whole. The existing paradigms in education, work, policies and social habits need to be altered (Niemczynowicz, 1999). Carmon and Shamir write that changing these paradigms is the most difficult part. They point specifically towards education as a tool for publicity and spreading the message. Niemczynowicz agrees with this, as he regards the use of edu-cation and information as a way to inform the public.
The last barrier is to change the behaviour of the people. Changing one’s lifestyle is never easy, but it is quite necessary (Niemczynowicz, 1999; Boyle et al., 2013). According to Boyleet al., if people do not start saving water then most interventions will be less
barriers and tackle them, in order to make the transition in Enschede somewhat easier.
2.3 State of the Art
A state of the art research was conducted to find systems similar to the proposed rainwater buffering solution. The findings are described in this section. First of all, ways of treating urban rainwater are described in general. Then, more specific solutions are listed. Both smart solutions and traditional solutions lacking intelligence are considered.
2.3.1 Treating urban rainwater
There are four categories of treating urban rainwater: 1) rainwater harvesting, 2) rainwater infiltration, 3) rainwater storage and 4) rainwater drainage (Zeng et al., 2007; Stichting RI-ONED, 2006). The categories are visualised in Figure 2.4. Within each of these categories there are several strategies or measures. However, many strategies fall into multiple cate-gories, such as green roofs, which infiltrate, store and drain water. An extensive table with a list of measures per category can be found in Appendix A.
Figure 2.4:Four ways to treat rainwater (Stichting RIONED, 2006).
2.3.2 Rainwater solutions with intelligence
In this subsection, several products related to rainwater buffering that already contain smart elements will be described.
De Slimme Regenton (Studio Bas Sala, 2017)
of multiple rain barrels can be monitored by water boards. The barrel is constructed for the public area and requires little to no maintenance.
iota OneBoxR (iota Services, 2014)
[image:23.595.245.379.272.499.2]The OneBox is a smart sewerage metering system produced by the Australian company iota Services. The product can be used to monitor and control pressure sewer units in real-time and makes use of the weather forecast. OneBox can be operated remotely, from a computer or smartphone. For this, they iota Services developed an app called ’Tank Talk’ which is available on iTunes. A screenshot showing the interface of the app is shown in Figure 2.5. The system is currently being implemented in Aquarevo, an estate south of Melbourne.
Figure 2.5: Tank Talk app (iota Services, 2016).
Mobile Water Management (Mobile Water Management, 2012)
Mobile Water Management (MWM) is a smartphone app with which one can measure water level and flow. The company is a spinoff from TU Delft, a technical university in the Nether-lands. Users simply take a picture with their phone and receive data on (ground)water level, water quality and gate openings in return. This allows users to monitor their water levels eas-ily, without actually measuring it themselves. The system uses image-processing algorithms and a cloud platform in order to do the job.
Smart retention roof by Optigroen (Optigroen, 2016)
to the weather forecast. The roof will then keep the rainwater, or discharge it through the downspout.
Water level sensors
There are multiple companies that created some sort of (smart) sensor that can measure the water level in a tank. Disdro is a company that created an acoustic disdrometer that serves as a rain gauge, which does not require any maintenance (Disdro, 2014). The sensor produces data on rain intensity and drop-size distributions, which is uploaded to a cloud platform. The company Loxone focuses on smart homes, and as a part of that they produce an ultrasonic sensor that can be used to measure liquid levels in tanks (Loxone, 2014). The sensor sends its data to a smart home platform called Miniserver. Finally, Conservation Technology is an older company (since 1984) manufacturing and distributing technology for energy, water and environmental conservation. They offer two different sen-sors (Conservation Technology, 2008). They produce a Wireless Ultrasonic Level Indicator, which determines the water level in a rainwater tank by using a directed ultrasonic beam, after which the data is wirelessly transmitted to the control system that can be located up to 1000 feet (300 meters) away. Next to that, they sell a Digital Level Indicator that uses a radio frequency cable sensor hanging in an open tank to measure water levels. Both sensors come with a control panel that displays the water level in a tank as a percentage of the total capacity.
2.3.3 Rainwater solutions without intelligence
This subsection covers rainwater management solutions without intelligence. Possibly, the mentioned products could be made ’smart’ in the future.
HydrorockR and HydroblobR (Hydrorock International B.V., 2013)
The Dutch company Hydrorock International B.V. develops Hydrorock infiltration blocks which can be used for drainage and infiltration of rainwater in streets and gardens as well as around houses and buildings. The blocks are made of rock wool, which means that they are envi-ronmentally friendly. The same company offers a smaller version of these blocks, called Hydroblob. They are meant for the consumer market.
Rainwater and fogwater collecting net (Netherlands Water Partnership, 2007)
A very cheap way to collect water from fog and rain is by using large polypropylene mesh nets. The mesh can capture water droplets sized1 to40µm, which are drained into a series
RainwinnerR (Rainwinner, 2013)
The Rainwinner is a rectangle rainwater tank module. Multiple Rainwinners can be stacked to create a garden fence or wall.
Rain garden (Bakker, 2014)
A rain garden makes use of Sustainable Urban Drainage Design (SUDS). It consists of several elements that work together to create a coherent whole. The following elements could be part of a rain garden (an example is shown in Figure 2.6):
• Overflow structure
• Raised beds
• Bioswale
• Ponds and wells
• Wall garden
• Specific plants that take up a lot of water (i.e. royal fern and yellow iris)
• Special soil mixture
Green(-blue) roofs (Stichting RIONED & STOWA, 2015a)
Green(-blue) roofs can take up rainwater and therefore reduce the water runoff to the sew-erage system. There are extensive as well as intensive systems, the difference lies in how shallow and heavy the system is. Extensive green roofs usually only contain grass, mosses or sedum and require little maintenance, while intensive ones need more work and can even carry shrubs and trees. Green roofs consist of several layers, the most important ones be-ing the vegetation layer, substrate layer, filter cloth, drainage layer and the root barrier. The addition of a drainage layer makes a green roof a green-blue roof. Figure 2.7 shows a green roof in the Netherlands.
Stichting RIONED and STOWA created several simulations with green-blue roofs. They concluded that green-blue roofs are interesting because they combine various benefits (such as a cooling effect and increased biodiversity), but that they do not stand out in one of these benefits in particular. When dealing with extreme precipitation, a buffer in the garden or a retention pond are considered more effective by the authors.
Water management in East Almere (Schuetze & Chelleri, 2013)
Figure 2.6:Anatomy of a residential rain garden (City of Vienna, 2013).
the seasonal storage areas, a circulation system was introduced to accommodate both peak precipitation and drought events.
Benthem square (STOWA et al., 2015)
The Benthem square (’Benthemplein’) is a water square in Rotterdam that stores water in basins during peak rainfall. It can store up to 1.7 million liters of water. The place is multifunctional: when there is no rain, the square can be used to play basketball or other games.
Amsterdam Rainproof (Amsterdam Rainproof, 2015)
Figure 2.7:A sloping green roof in Assendelft (Optigroen, n.d.).
2.4 Conclusion and relevance of the research question
In this section, the three background research, literature review and state of the art are concluded separately, after which the relevance of the research question is demonstrated.
2.4.1 Conclusion background research
From the background research can be concluded that the solution developed in this grad-uation project should be low-cost and low-maintenance, both for the municipality and the citizens of Enschede. It should be implemented in an area where the risk of flooding is high. There are a lot of areas where help is needed, but it is out of the scope of this project to treat more than one area. Therefore, together with the water designer of the municipality it was decided to focus on the Oldenzaalsestraat and the area to the east of it. This way, the two goals stated in the ’Gemeentelijk Rioleringsplan 2016-2020’ are reached. Furthermore, the municipality and the citizens should be closely involved during the ideation, specification and realisation phases of the project.
2.4.2 Conclusion literature review
The literature review revealed that there are plenty of resources and approaches to learn from. Several authors agreed on the fact that it is best to take an integrated approach to urban rainwater management. There is currently a transition towards decentralised sys-tems that treat runoff as a resource. An example of this are domestic rainwater harvesting systems, where citizens collect rainwater at their homes and use it for flushing the toilet or for their washing machine. These and other solutions appear in the list of BMPs and LID strategies. Such examples can serve as inspiration for the development of a smart rainwater buffering system in the city of Enschede.
defined that help with assessing the practical value of different rainwater buffering systems. A city should start with conducting fieldwork and gathering historic data that represents the current and historic situation. Additionally, intelligent sensors that provide the municipality with real-time data could be installed. In a later stage, scenarios and simulation tools can be applied in order to test and select the best options. After implementing the system and connecting it to the Internet of Things, cities can monitor the rainwater buffers and evaluate whether everything works as desired. In conclusion, smart technology serves as a great tool for decision making.
A few barriers can be defined in the transition towards a smart city that handles water in a sustainable way, such as policies that hinder change to the built environment, or ignorance of the people. However, the literature did not really define ways to counteract these barriers. The only solutions mentioned were education and subsidisation, in order to inform citizens and give them an incentive to participate. It is recommended to do further research on the ways to tackle the challenges that arise when a city wants to implement sustainable water management.
There were limited sources available on the implementation of smart rainwater buffers. Several authors suggested to incorporate real-time control, use sensors to generate data and simulate potential solutions. However, there is a lack of documentation on real life examples as this is a relatively new research area. This makes it even more interesting for this project.
2.4.3 Conclusion state of the art
The state of the art research showed that there are a lot of ways to treat urban rainwater, but they can all be traced back to four basic categories. There are some interesting rainwater solutions that contain smart elements, such as the Smart retention roof and the OneBox. However, these solutions make use of only one type of rainwater buffer, instead of combining different ones. Water level sensors are a simple way to make traditional rainwater buffers smart. Among the rainwater solutions without intelligence, the rain garden and the system in Almere are both interesting examples that show how integrating different measures can create a strong ecosystem of buffers. Furthermore, green(-blue) roofs are already quite common in the Netherlands and since the technology for making these roofs smart already exists, they are a feasible option to consider.
2.4.4 Relevance of the research question
Chapter 3
Methods and Techniques
This chapter describes the methods and techniques that will be used during this graduation project. These methods help to structure the development process as well as this report.
3.1 Creative Technology Design Process
The bachelor programme Creative Technology (CreaTe) teaches students how they can apply existing technologies in novel ways and create new combinations with tools that are already there (Mader & Eggink, 2014). The design process of Creative Technology starts with a design question and continues in four phases: the ideation phase, the specification phase, the realisation phase and the evaluation phase. The method is a combination of Divergence-Convergence and Spiral models, where the iterative development of prototypes is key. In every iteration, the prototype is improved and refined based on human-centered design and established engineering design principles. The design process is visualised in Figure 3.1.
This report is structured according to the Creative Technology design method. Every phase has its own chapter, describing the methods that were used and the corresponding results. In the next few paragraphs, each of the four phases will be described shortly.
3.1.1 Ideation
The ideation phase uses a design question as starting point, looking into related work and tinkering methods as a source of inspiration. Brainstorming tools such as mindmapping can be used to develop a lot of ideas. These ideas can then be refined and narrowed down by stating the requirements (which are specified by the stakeholders). The most promising concept can be developed further by creating mock-ups and a storyboard.
3.1.2 Specification
ways: either iterations of the whole product, or an exploration of one aspect of the product. Furthermore, a schematic of the overall system and subsystems is created.
3.1.3 Realisation
The realisation (or implementation) phase begins with analysing the components necessary to make a hi-fi prototype, taking into account the conclusions from the specification phase. In CreaTe, the components usually consist of hardware (electronics), software (code) and a casing. All these components are combined to create a final prototype.
3.1.4 Evaluation
During the evaluation phase, the final prototype is tested with potential users. This user evaluation serves as a way to find out whether the prototype fulfills the specified needs and answers the research question. Furthermore, personal reflection takes place to evaluate the graduation project process.
3.2 Stakeholder analysis
In order to find out which parties should be taken into account during the development of the prototype, a stakeholder analysis can be conducted. Stakeholders are individuals or repre-sentatives of a group or organisation who are affected by or may affect a certain decision, outcome or project (Hemmati, 2002; Freeman, 1984). Stakeholders can be categorised ac-cording to their role in the project (Sharp, Finkelstein, & Galal, 1999). Sharp identifies four roles:
1. User
2. Developer
3. Decision-maker
4. Legislator
Furthermore, one can create a stakeholder matrix to display the stakeholders alongside a power-axis and an interest-axis (Moore, 2011). This way, it can be clearly seen which stakeholders should be managed closely and which stakeholders should simply be kept up-to-date.
3.3 Surveys
check whether the participant is in fact part of the target group. To facilitate a quick analysis, multiple-choice questions should be the foundation of the survey, supplemented with a few open questions. For more in-depth analysis, interviews are required.
3.4 Interviews
Interviews can be carried out in order to achieve a better understanding of one’s viewpoint and gain in-depth knowledge on a specific topic. There are three basic kinds of qualitative interviews used in the social sciences: structured, semi-structured and unstructured ones (Edwards & Holland, 2007).
Structured interviewsconsist of a set amount of questions, that will be asked to every participant in the same order. This simplifies the analysis, but is also inflexible as there is no possibility to go beyond the questions that were specified. A survey can be seen as some sort of structured interview. This kind of interview is very suitable when it concerns a high number of participants.
Semi-structured interviews are built around a couple of questions that were prepared beforehand, but allow for further exploration of other topics. They are more flexible than structured interviews, but still offer some guidance for the interview.
Inunstructured interviews, the only thing that is fixed is the subject that the developer wants to discuss. For the rest, the floor is open to the interviewee who is invited to talk about his or her perspective on the topic. This kind of interview is free-form, which can lead to surprising outcomes.
3.5 PACT and FICS scenarios
Scenarios describe the context of use and the activities carried out with a system (David, 2013). PACT and FICS are two tools that can help the developer to align the design of the system with the user’s needs and wishes (Widya, Bults, Huis in ’t Veld, & Vollenbroek-Hutten, 2009). In order to capture both the user’s perspective and the designer’s perspective, it is important to implement both frameworks in a scenario (Benyon & Macaulay, 2002).
3.5.1 PACT
PACT is a framework that can be used to describe the user’s perspective (Benyon & Macaulay, 2002). PACT is an acronym that can be described as follows (Trulock, 2008):
• People: physical and cognitive user characteristics and skills
• Activities: goals, tasks and actions
• Context: the environment of the activity (physical as well as social)
3.5.2 FICS
In the acronym FICS, the F stands for functions and events, the I for interactions and usability issues, the C for content and structure and the S for style and aesthetics (Widya et al., 2009). FICS is used to describe the designer’s perspective.
3.6 MoSCoW
The MoSCoW method can be used to structure and prioritise a list of requirements (Haughey, n.d.). MoSCoW is an acronym where the M stands for must have, the S for should have, the C for could have and the W for won’t have. The technique was developed by Dai Clegg in 1994 and has been used by many projects since then.
3.7 Functional testing
Through functional testing, the designed prototype of a system can be tested on its func-tionalities. This is done by taking a look at the functional requirements, specifically the ’must have’ category. If these requirements are fulfilled, the functional test is considered suc-cessful and the system can be evaluated with users. It is important that a functional test is executed before the user tests take place, because it should be verified that the prototype functions properly.
3.8 User testing
During a user test, a representative of the target user group interacts with the designed prototype. The goals of user testing in this graduation project are to test the usability of the prototype and to find out whether the prototype fulfills the user’s needs (Usability.gov, 2017). This way, problems with the prototype can be identified, if present. Before a user test is conducted, a user testing protocol is created in order to make testing smooth and consistent. The user test protocol defines the purpose of the test, the test setup, the participants, the interaction device, the interaction method and the data collection method. These elements are described in detail below. Furthermore, the heuristics that can be used to test the usability of a system are identified.
3.8.1 User test protocol
usability testing: free interaction and task based interaction. Free interaction means that the participant can interact with the prototype without any predefined tasks. On the other hand, task based interaction provides the participant with tasks which the participant needs to execute. When choosing the task based interaction, it might be necessary to interrupt the testing and give the participant a hint when he or she does not understand how to perform a certain task.
During the user test, the observer will collect data on how the test participants interact with the prototype. The data collection method defines how this is done and specifies which qualitative and quantitative metrics are going to be used. In this graduation project, the methods that will be considered are the thinking-aloud and observation methods. These methods allow to gather the thoughts and experiences of the participants. Qualitative metrics concern the outcome of the thinking-aloud and observation methods, as well as for instance a questionnaire. Quantitative metrics are e.g. successful completion rates, error rates and time spent on a task.
For the thinking-aloud method, the concurrent method will be considered. The concurrent method is meant to make the participants tell about their experiences out loud during the test session (contrary to the retroperspective method, where the participants only reflect on their findings after the test session). It is possible that participants forget the thoughts they had during the test session shortly afterwards. Therefore, the concurrent method is preferred over the retroperspective method.
By observing the participants, additional information can be gathered by taking notes of important discoveries. These discoveries include the emotions that participants show when interacting and if they are interacting enthusiastically with the system. Combining these two methods, the experiences and thoughts of both the developer and the participants can be gathered.
After the user test has been carried out, the results are analysed and a conclusion is drawn.
3.8.2 Usability heuristics
Usability of a system can be tested with ten usability heuristics, developed for user interface design (Nielsen, 1995). These heuristics include:
1. Visibility of system status
The users should be regularly informed about what is going on with the system.
2. Match between system and the real world
The system should make use of familiar icons and concepts, closely resembling what is going on in the real world.
3. User control and freedom
4. Consistency and standards
The design and the terms being used should be consistent, not allowing any confusion.
5. Error prevention
The possibility of encountering errors in the system should be eliminated.
6. Recognition rather than recall
The design should be such that the user does not need to remember too many details in order to use the system.
7. Flexibility and efficiency of use
The system should be tailored to both experienced and inexperienced users.
8. Aesthetic and minimalist design
Only relevant information and data should be shown in the system in order to achieve a minimalist design.
9. Error recognition, diagnosis and recovery.
Clear error messages should be available if necessary.
10. Help and documentation
Chapter 4
Ideation
In this chapter, the idea generation is described. As the stakeholders will be referred to extensively throughout the chapter, the stakeholder analysis will be described first. Secondly, the scope of the project is narrowed down and the brainstorming process is described. Thirdly, an analysis of the research area is given. Fourthly, interviews and surveys were held among several stakeholders to get an idea of their needs and wishes. The fifth section describes the chosen concept in detail, which serves as a foundation for the specification phase. The chapter is concluded with user scenarios, built up by using the PACT and FICS frameworks.
4.1 Stakeholder analysis
In this graduation project, the (groups of) stakeholders that could be identified are 1) the municipality of Enschede, 2) the citizens living in De Bothoven and Velve-Lindenhof, 3) the University of Twente, 4) co-developer Felicia Rindt, 5) the Computer Science Master stu-dents, 6) Water board Vechtstromen and 7) housing corporations. These stakeholders and their contact persons are listed in Table 4.1. Some of these stakeholders are more important than others. A stakeholder matrix was created to visualise the stakeholders and their role, power and interest in the project, see Figure 4.1. All stakeholders have one role, except for the municipality of Enschede, who is both a decision-maker and a user in this project.
4.2 Brainstorming process
4.2.1 Focus
The research questions of this graduation project were the starting point, repeated below for convenience.
Table 4.1:Stakeholder groups and their respective contact persons
Stakeholder (group) Contact
1. Municipality of Enschede Hendrik-Jan Teekens
2. Citizens De Bothoven and Velve-Lindenhof Neighbourhood council De Bothoven, neighbourhood council Velve-Lindenhof
3. University of Twente Richard Bults, Hans Scholten
4. Felicia Rindt
-5. Computer Science Master students Jeroen Klein Brinke, Dennis van der Zwet
6. Water board Vechtstromen Brenda Koopman, Evelien Spoler
7. Housing corporation Domijn Arno Weppel
(a) How can rainwater buffers be made ’smart’, so they adapt their performance and capacity according to the anticipated rainfall?
(b) How can the system’s monitoring data be processed and presented to the municipality of Enschede?
Together with supervisor Richard Bults and co-developer Felicia Rindt, it was decided to make a distinction. This graduation project would be carried out on behalf of the municipality of Enschede, while Felicia would work on the buffer with the citizens as target group. Be-cause of the collaboration with her, it was chosen to only look at buffers that will be placed on private ground. Also, it was decided that a part of the realisation would be done by the two Computer Science Master students, Jeroen Klein Brinke and Dennis van der Zwet. This meant that the project allowed for a more elaborate prototype with several subsystems.
Furthermore, it was discussed with Hendrik-Jan Teekens that the envisioned smart water buffering solution would be able to buffer 1 million litres of water, as an addition to the current plans of the municipality to build a basin underneath the Oldenzaalsestraat that will have a capacity of 7 million litres (Gemeente Enschede & Water board Vechtstromen, 2017). In total, 8 million litres will then be buffered.
In the next two paragraphs, the brainstorming process for the two subquestions (with a focus on the municipality) will be described. The state of the art-research conducted in Chapter 2 served as inspiration for this process.
4.2.2 How can rainwater buffers be made ’smart’, so they adapt their perfor-mance and capacity according to the anticipated rainfall?
Figure 4.1:A power-interest stakeholder matrix, using the categorisation of roles by Sharp and the matrix template by Moore (Sharp et al., 1999; Moore, 2011).
There are four buffers in this category that were found the most suitable for sensing and controlling purposes on private ground:
1. Rainwater barrel
2. Rainwater fence
3. Rainwater roof
4. Rainwater plant box
4.2.3 How can the system’s monitoring data be processed and presented to the municipality of Enschede?
A mindmap was created to explore the kinds of data that could be shown on the interface for the municipality. This mindmap is shown in Figure 4.2.
Figure 4.2:Mindmap for the data that could be shown on the interface for the municipality.
There are different ways to visualise this data. The data can be shown in 1) charts and graphs, 2) on a map of Enschede and 3) in numbers and percentages. Furthermore, the municipality will have some kind of web interface that shows all data visualisations in an overview.
4.3 Neighbourhood research
Several sources were consulted in order to get an overview of the research area and its possibilities. Firstly, a round through the neighbourhoods De Bothoven and Velve-Lindenhof was made together with Felicia Rindt. The goal was to get a feeling for the area and get a quick glance at the kind of buildings to see which possibilities there are. The pictures that were made during this round can be found in Appendix B. Secondly, a look at Google Maps was taken. Thirdly, a map of engineering consultancy Witteveen+Bos was used that shows where the (im)permeable surfaces are located and which roofs are flat or sloped. This map is shown in Figure 4.3. Fourth of all, an online map showing the construction years was used, see Figure 4.4. The results of these sources were combined and the key findings are listed below.
• There is little vegetation throughout the whole area.
Figure 4.3:A section of the map showing paving permeability and roof type in De Bothoven and Velve-Lindenhof, by Witteveen+Bos (Dekker, 2017).
• There are mostly terraced houses, but also a few apartment blocks.
• Most of the houses have a pitched roof (roof with a slope), while the larger buildings (such as the Performance Factory) and apartments have a flat roof.
• The main roads are impermeable, while the smaller streets contain permeable pave-ment.
• Many of the houses do not have a front yard and their downspout is close to the sidewalk. In these cases, it is not possible to install a rainwater barrel.
• There are already a couple of houses that have a green roof in Kremersmaten.
• There is a big patch of unused greenfield land east of the supermarket Emt´e at the Lage Bothofstraat which could serve as a water retention area.
• There are several playgrounds and parks where a water square or wadi could be im-plemented.
• Next to the Performance Factory, there is a paved area that could serve as a water square.
• The buildings in De Bothoven are relatively new: 88.8 % of the houses were built after 1960.
Figure 4.4: The construction years of buildings in De Bothoven and Velve-Lindenhof (Brouwer in Beeld, 2011).
4.4 Interviews and survey with stakeholders
In order to learn the opinion of the different stakeholders, all stakeholders visualised in the stakeholder matrix in Figure 4.1 were contacted. Regular meetings were held with the de-velopers and decision-makers, which were Felicia Rindt, the Computer Science students, the municipality of Enschede and the University of Twente. They were closely involved in the design process. To reach the users, a survey was conducted among the citizens living in De Bothoven and Velve-Lindenhof and interviews were carried out with the municipality. Finally, housing corporation Domijn was interviewed and water board Vechtstromen was contacted via email. The findings of the interviews and the survey are described in the following sub-sections.
4.4.1 Interview with the municipality
In order to decide on the data that would be shown to the municipality, a semi-structured interview was carried out with Hendrik-Jan Teekens. A first design of a potential interface was created to explore different data visualisations. Inspiration was drawn from Google Images, Chapter 2 and the report ’Ervaringen met de aanpak van regenwateroverlast in bebouwd gebied’ (Stichting RIONED, 2014). The design was shown to the municipality and can be found in Appendix C, Figure C.1. The most important findings of the interview are summarised below.
see themselves actively controlling the smart rainwater buffering system, merely monitoring it.
To ’compensate’ the citizens for installing a smart rainwater buffer at home, they are open to subsidisation. However, they want the citizen to prove that they are really part of the system. Hendrik-Jan liked the first design of the interface, it shows the workings of the system in a plain and neat way. He would prefer the interface to be in Dutch, as this is the language used for internal communication as well.
Currently, the municipality simulate their rainwater measures with software called Rain-Tools. This software might be useful for this project as well. Furthermore, Hendrik-Jan suggested to use the ’model rain showers’, which are extreme rain showers that actually took place in the past, to test the workings of the system.
The full interview can be found in Appendix D, section D.1.
4.4.2 Survey with citizens
The neighbourhood councils of both De Bothoven and Velve-Lindenhof were contacted in order to reach the citizens living in these two areas. A survey was created to get an idea of the general opinion among these citizens, as this is a diverse group of people. The survey was shared on social media such as Facebook and Twitter, published on the websites of the two neighbourhoods, as well as promoted on a flyer which was distributed in several public buildings throughout the area (Lumen, ’De Speeltuin’ and the Performance Factory).
Unfortunately, only 13 citizens living in De Bothoven filled in the survey and there were no respondents living in Velve-Lindenhof. However, a few things could be noted regarding the willingness of citizens to acquire a rainwater buffer, the kind of buffer citizens would like to have, and the opinion of citizens on sharing the buffer’s data.
The results were the following. First of all, more than 70% of the respondents know people who have experienced urban flooding, or they experienced it themselves. This shows that they know the relevance of the problem. To the question whether they are interested in obtaining a rainwater buffer, 7.69% answers ’Yes’ and 69.23% answers ’Maybe’. As an explanation for this answer, citizens write that they are not sure whether the benefits are higher than the costs, or whether they have enough space in their garden. Next, the same question is asked, but now it was stated that such a buffer contributes to a solution. In this case, 30.77% answers ’Yes’. If they receive subsidy or other compensation for this, the buffer is more attractive. It is even better when the citizens can re-use the rainwater for their own purposes, such as in the garden or for flushing the toilet. In that case, 69.23% answers ’Yes’.
Participants were asked which buffering solution they preferred (rainwater barrel, rain-water fence, rainrain-water roof and rainrain-water plant box). They were allowed to choose multiple options. 36% choose a rainwater roof, 28% a rainwater fence, 20% a rainwater plant box and 16% a rainwater barrel. It seems that the roof and the fence are the most popular options.
the municipality. They would not mind if this data would be used to improve the system’s performance. Finally, most citizens (53.85%) prefer a plug-and-play product that comes with little to no maintenance.
The full survey can be found in Appendix E.
4.4.3 Interview with housing corporation Domijn
Domijn is a housing corporation in the province of Twente. A semi-structured interview was held with them in order to find out what their role in the project might be. The findings are described below.
Domijn is already working on some measures to combat flooding of buildings, but mostly in relation to ground water. They are involved in a pilot project of sloped green roofs in Trans-burg. which is located in De Bothoven. However, they do not use any (smart) technologies in this.
Tenants are allowed to put a rain barrel in their house, that is not a problem. Domijn is potentially interested in the project, but they do not see many possibilities for implementing a smart rainwater buffering system in existing buildings, especially since many of the houses they own in the neighbourhood are quite old (built before 1960). If the rainwater can be re-used by the inhabitants, it might be interesting, because then it can be re-used to give the house a higher energy label. Still, in their opinion, a smart rainwater buffer is more something to consider for newly built houses and apartments.
As far as Domijn knows, young people in the neighbourhood are fairly enthusiastic about water measures, but older and foreign people are more resistant.
Lastly, Domijn mentions the idea to make a map of the possibilities in the neighbourhood, where water could be buffered in what way (on roofs, in tanks, et cetera). That helps the parties involved to see where a smart rainwater buffering system could be implemented.
The full interview can be found in Appendix F.
4.5 Concept
Based on the brainstorming sessions, the neighbourhood research and the interviews and surveys held among the stakeholders, the concept was narrowed down. This is described in the next paragaph.
Figure 4.5:The smart rainwater buffer concept visualised.
4.5.1 A system of smart rainwater barrels
The concept, which is visualised in Figure 4.5, is a system of smart rainwater barrels, which are placed above ground at citizen’s homes. The system will be called Tonnie, inspired by the Dutch word for rain barrel (regenton). Each barrel contains sensors to measure its water level and actuators to control its valves to the sewerage system and the garden of the citizen. It looks at the rain forecast to decide whether the valves should be opened or closed - if there is a lot of rain predicted, the valves will open in order to release water, so there is enough capacity to capture the expected rainwater.
There are two interfaces that show information about and obtained by the system. The interface for the municipality shows data of the overall system (the combined performance of all buffers), while the interface for the citizen only shows data of his/her own buffer. Both interfaces show the rain forecast.
4.6 PACT analysis
In this section, a PACT analysis for the smart rainwater buffering system is described.
4.6.1 People
There are two types of user groups to be considered:
• The municipality
Both groups have their own characteristics and skills, which will be described in their own section. Even though the developer of this graduation project focuses on the municipality, the information for the citizens will be provided as well in order to give a full picture of the system’s workings.
The citizens
The citizens living in the neighbourhoods where the system will be placed (De Bothoven and Velve-Lindenhof) are a diverse group of people. In other words, the users are quite hetero-geneous. However, it can be expected that mostly adults (<18 years old) are concerned
with the use of the buffer. Their cognitive and physical characteristics can differ a lot, due to age and education differences. If they have mental or physical disabilities, this can inhibit them from using the buffer. The product does not require much physical strength, but it does include an interface that is purely visual. Therefore, people that are blind will not be able to use the buffer system.
Citizens with cultures different from the Dutch culture might not understand the need to engage with the water management in their city. They might not fully master the language. Also, the motivation of the people can differ a lot. If people are individualistic, they might not want to invest in a smart rainwater buffer that helps to prevent flooding in other areas of the city. On the other hand, already established communities form an opportunity for such a product to take off and be used by a large group of people. Personal interests and hobbies play a big role as well in determining whether one wants to use the buffer. If someone is interested in climate change and preventing the effects thereof, then he/she is more likely to adopt the buffer. Furthermore, if a citizen is already familiar with smart home technology or for instance the smart thermostat Toon2, they might have a lower barrier to acquire the
buffer. Finally, the smart buffer might be more attractive to experts and frequent users than to novices and infrequent users.
The municipality
The municipality that will be using the system is the municipality of Enschede. As all these people work in the same place, they are homogeneous rather than heterogeneous. The people working there are adults, in the range of approximately 20-67 years. This means that there can be quite some difference in physical abilities. However, not much physical strength is necessary in order to fully use the product. The buffer is more demanding in the cognitive field, as it requires some attention and perception in order to navigate the interface of the buffer system effectively. But since the role of the municipality is mostly to monitor and not control the system, a limited amount of mental capability is sufficient. There might be people
2Toon is a product from the Dutch energy company Eneco, that comes with an interface that gives users a
with special needs, i.e. mental and physical disabilities. However, these disabilities are not very severe, because in that case they would not be working at the municipality.
Since the smart rainwater buffering system is something directly related to the work of the people that will use the interface, it can be expected that they are interested in using it. Their interests and experiences are already in line with the product. Cultural differences are not too much of a problem, as the people working at the municipality are usually Dutch, or at least proficient in the Dutch language and familiar with the Dutch culture.
Some employees might be more proficient users of technology than others, which means that they will find it easier to learn using the interface. However, since the terminology of the interface is familiar to them as they are working with it on a daily basis in their work (frequent users), it should be easy to navigate the system even for novices.
4.6.2 Activities
The smart rainwater buffering system has several different functions. The main goal of the smart rainwater buffer itself is buffering rainwater and the interface gives the users insight in the buffers’ systems performance. Tasks that can be executed by the users individually depend on the type of users described above, the citizens and the municipality.
The citizens
The smart rainwater buffering system will be able to function completely autonomously. How-ever, if needed the users will be able to operate the system manually by using the interface. The three main tasks that the citizen can execute is getting insights in their own smart rain-water buffer’s performance, manually operating the smart rainrain-water buffer by deciding the amount of water that the buffer should discharge into the sewerage system and re-using the harvested rainwater for private uses. Actions that cover the first task, getting insights in the user’s own smart rainwater buffer, are visiting the web page on a computer or smartphone on which the interface is being displayed. This web page displays several graphs on the pre-cipitation forecast, the system’s performance and history. The user can display the graphs on a specific date range by selecting this date range on the web page. Since the smart rainwater buffering system is able to function completely autonomous, the user can execute this task as frequently as they prefer.
The actions that cover the second task, also include using the interface. The user can set an amount of water that should be discharged into either the garden or the sewerage system by typing the amount in litres into a text input field on the interface and then clicking the discharge button. The discharge request can be cancelled any time by clicking the cancel button.