Faculty of Engineering Technology,
Engineering Fluid Dynamics
Design of an Energy Storage System
for Pacific Islands
Niels Leijtens Internship Research
Aug–Nov 2015
System for Pacific Islands
By Niels Leijtens
Problem
The islands in the South Pacific
Ocean mostly use a diesel
gen-erator to produce electricity. To
replace a generator by solar
pan-els an energy storage system is
needed to keep power and
en-ergy constant during day and
night. This system should
pro-vide energy for at least 10
house-holds.
Storage Systems
Multiple different storage
sys-tems have been reviewed and all
differ in principle and
specifi-cations. The five main
princi-ples are: mechanical, chemical,
electromagnetic, hydrogen and
thermal energy storage. Out of
these storage systems the
fly-wheel is selected for its high
power density
[
KW/m
3]
, good
specific power
[
W/kg
]
, high
ef-ficiency
[%]
, long lifespan, high
cycle life and low environmental
impact. Also the maturity of the
system is high for the flywheel
since it has been used by people
for ages.
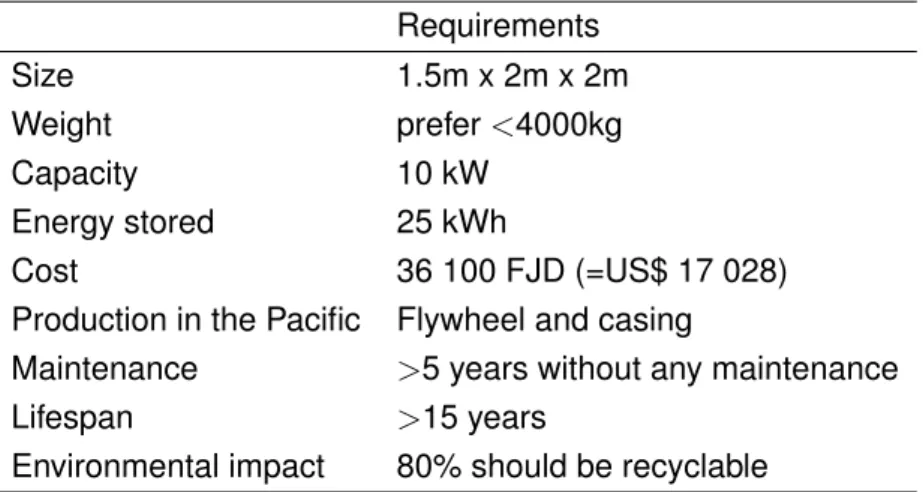
Design Specifications
Size:
1.5m x 2m x 2m
Weight:
<4000 kg
Capacity:
10 kW
Energy stored:
25 kWh
Cost:
36 100 FJD (US$ 17 028)
Production in the Pacific:
Flywheel rotor and casing
Maintenance:
>5 years without maintenance
Lifespan:
>15 years
Environmental impact:
80% should be recyclable
Flywheel Shapes
The flywheel rotor material is commonly made from metals or
com-posites. The shapes of different flywheels can be seen in the picture
below. Here different shapes are combined with different materials
to find the best design. During the design it is important to know
how much energy can be stored per mass. This can be calculated by
equation:
W
M=
K
σuρ
. Here
K
is the shape factor which depends on
the shape of the flywheel. The highest shape factor
K
= 1
is from the
use of an equal stress disk. This shape has been used for the design.
Design
The design focuses on the flywheel rotor, shaft and bearing, since
these are the most critical points of the design. The flywheel will be
an equally stressed disk with a rim at the end. The design:
radius
=
0
.
525
m
,
height
= 0
.
752
m
,
mass
= 2140
kg
,
Energy
stored= 25
kW h
and
ω
max= 10 000
rpm
. The chosen bearing is the SKF QJ 305
N2MA. It is advised to use magnetic support for the bearing and a
low pressure environment to keep the losses acceptable.
Conclusions
1 Introduction 1
2 Pacific islands 2
2.1 The Pacific Island Area . . . 2
2.2 The Pacific Conditions . . . 4
2.2.1 Vunivau Solar Home Systems . . . 4
2.3 The Pacific Villages . . . 5
3 Energy storage 7 3.1 Energy storage systems . . . 7
3.1.1 Mechanical Energy storage . . . 8
3.1.2 Chemical Energy Storage . . . 9
3.1.3 Electromagnetic . . . 10
3.1.4 Thermal Storage . . . 11
3.2 Storage systems analysis . . . 13
3.3 Worldwide used storage projects . . . 14
3.3.1 Diesel generator . . . 14
3.3.2 Energy storage exchange project . . . 14
3.3.3 Tesla Powerwall . . . 16
4 Concepts 17 4.1 Concept Choice . . . 17
4.2 The flywheel . . . 17
4.3 Requirements . . . 18
5 Detailed Design 20 5.1 Flywheel Design . . . 20
5.2 Shaft and Bearing Design . . . 25
5.3 Tolerances . . . 30
5.4 Losses . . . 31
5.5 Safety and Lifetime . . . 33
5.6 Dynamic model . . . 34
6 Conclusions and Recommendations 35
6.1 Conclusions . . . 35 6.2 Recommendations . . . 35
References 37
Appendices
A Data of energy storage systems 39
B Bearing QJ 305 N2MA 42
C Drawings Shaft and Flange 43
Introduction
Global warming and the rise of sea level are world scale problems. Of course this will affect the bigger continents but it will have even more effect on smaller islands, like those in the South Pacific. As some islands have a maximum elevation of less than five meters above sea level [1] a small raise of the sea level can have big consequences.
This is one of the main reasons for the Pacific Island Countries and territories to make targets for the implementing of sustainable energy. These targets cooperate with different government targets to provide the rural areas with electricity in the pacific. Electricity is not always a common good in the South Pacific. The current method of electrification of these islands is to provide these people first with a diesel generator and when electricity is a common good, the villages switch to renewable energy. However it should be from great good when the step of a diesel generator is skipped. Most Pacific Islands have a high level of solar renewable energy resources and a medium level of wind, hydro and geothermal resources [2]. Unfortunately these resources are not constant in their energy delivery. If the energy generated from these resources could be stored it would provide a significant improvement to the users. It will use the production spikes to store energy for less productive times. This would increase the benefits of renewable energy and could provide a 100% renewable solution for smaller electricity grids, like it is the case in Tuvalu. This island utilizes renewable energy only since 2012 [3].
The project is about to designing an energy storage system which can provide a small village from continual electricity. There are many different solutions for the storage of energy but not all suit the pacific conditions. Most islands are small and have rural surroundings which makes it difficult to reach the village and is expensive to connect with an electrical grid [4]. This report will give an overview of the situation on several islands and the possible solutions which will electrify the rural areas in a more renewable way. When the storage system is selected, specifications for a design will be listed and a design matching to these specifications will be made. At the end will be decide if this project should be continued.
In this report the prices are given in US dollars (US$) and in Fijian dollars (FJD). The exchange rate which is kept during the report is 1.00 US$ =2.12 FJD. The original price is given before the brackets and the exchanged price within the brackets. For example 3US$ (=6.36FJD).
Pacific islands
In this chapter an outline will be given on the need of energy in the rural pacific islands. Some of the islands have an electricity connection but a lot of the smaller islands do not have a connection jet. Most islands which have electricity make use of diesel generators. First will be focused on the Pacific islands: which countries are there, what are their political behaviours and what are their needs. Most of the South Pacific countries are developing countries. This project is not the first renewable project in the Pacific, a lot of projects have been executed, some more successful than others.
2.1 The Pacific Island Area
Most people know the Pacific countries from their white beaches and small honeymoon islands. The tourists that look closer know that there are over thousand more islands which are inhabited by people, who sometimes live in very rural conditions. A lot of these islands do not have electricity or only have electricity a few hours per day when the generators are turned on. In figure 2.1 the map of the South Pacific countries is shown with their territorial waters.
Figure 2.1:South Pacific Countries territory with Palau, Micronesia and the Marshall Islands more to the North [source: www.southwestpacific.com]
The differences between the South Pacific countries are big. Not only the population differs from 7 million in Papua New Guinea to 9847 in Tuvalu. Also the GDP per capita shows large differences. The Cook islands have with 13 478US$ (=28 575 FJD) almost nine times the GDP per capita than the GDP of the Solomon Islands 1 517US$ (=3 216 FJD). This results directly into the differences in development of the country and with this the access to power for the inhabitants. The correlation between the Electrification rate and the GDP per capita can be seen in figure 2.2. Here can be seen that the islands with lower GDP per capita also often have a low electrification rate. The same goes for the higher group of GDP per capita. In general three groups can be recognized in electricity development. Low levels of access in Papua New Guinea (10%), Solomon Islands (14%) and Vanuatu (17%). Medium levels of access: Federated States of Micronesia (54%), Kiribati (63%), Republic of Marshal Islands (80%) and Fiji (89%). And the high level of access in Tonga, Cook Islands, Samoa, Palau Tuvalu Nauru and Niue with all an access to power of 95%-100% [2], [5]. The marker shape per country in figure 2.2 indicates the population size, a square() is
for 500.000+ inhabitants, triangle(N) for 10.000-500.000 inhabitants and the circle(•) for a
population smaller than 10.000 inhabitants.
Figure 2.2:The access to power to the GDP per South Pacific country (2011) [2], [5]
for expanding access to electricity in Pacific SIDS is the reform of institutional arrangements. It is also needed in order to ensure that off-grid systems that are installed remain in a work-able condition.”
2.2 The Pacific Conditions
In the Pacific there are specific conditions that influence a project which is done in and by the Pacific. Of course the first is climate and earthquakes. Some of the islands in the South Pa-cific lay close to the fault lines of the Earth combined with the rain season where the change on hurricanes is high. Both of these conditions should be taken serious in a design. Also production and knowledge is something to keep in mind in the design process because in the rural areas, people with the right knowledge are not always close by. The inhabitants live isolated and replenishment of goods does come weekly or even less frequently. So it would be useful if the maintenance could be done by local people which are not schooled in this job. Next to this it must be taken into account that most of the goods which are delivered on the island will never leave the island again. Environmental impact is from great importance because this is also the environment where the people get most of their food from. If there is a defect which cannot be fixed by the local people, schooled employees should come. They should be located in central civilized areas. The transport of the employees would take more time than normal and could take days to weeks.
2.2.1 Vunivau Solar Home Systems
In 2002 a program was funded by the governments of Fiji and Japan to increase the electri-fication of the rural areas. The installed solar systems had the size of 100Wp with five lights and one power point. A total of 250 systems were sold during the project [6]. The program employed RESCO, Rural Electricity Service Company, with the Fijian government as owner. The users in the rural areas paid a fee-for-service for the use of the system. This was a monthly tariff payment to rent the system which costs US$14 (=29.68 FJD) per month from which US$0.5 (=1.06 FJD) goes to the post office and US$13.50 (=28.62FJD) to the ser-vice company. The first survey under local users of the systems was positive. Unfortunately a more recent survey showed that in 2009 about 80% of the systems were out of service due to no availability of monitoring or maintenance services. The amount of defects could have been decreased if users were trained to do simple maintenance. Concluded out of this project can be that the factors to success are [6]:
• Private ownership to reduce the maintenance cost and overuse of the system. • Smart subsidies to improve the affordability of the systems for the low incomes. • Link the system with productive use of the system. This increases the durability and
decreases the maintenance.
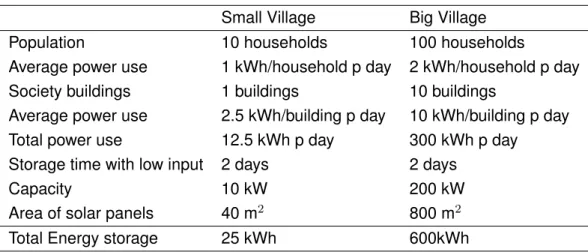
2.3 The Pacific Villages
As been described in the earlier section, villages in the Pacific are located in rural areas. This project does not want to focus on one specific village or island. This report will use two types of villages, a small and a big village. The small village has around 10 households in a very rural area with one society building, for example a chapel, community room or small office. The big village has a population of 100 households with ten society buildings. This village lays in a less rural area and with this it is easier to get an engineer to repair if the source is defect. Both villages already use generators to produce energy but people in the big village are more familiar with electricity. To give an idea of both villages two examples can be seen in figure 2.3 & 2.4.
Figure 2.3:Aloa Bay, Solomon Islands (source: Google maps)
Figure 2.4:Village, Rere area, Solomon Islands (source: Google maps)
When a non-electrified village starts to use electricity the inhabitants do not have many electric products. The only need they have is for a few light sources. When people get used to the usage of energy and trust it, their energy usage will develop. In documents of the United Nations is described that Pacific rural households have an entry energy use level rate of 0.2 kWh/day and an end level rate of 2 kWh/day [7]. In this document is estimated that these households exist out of 5 persons. A level rate of 0.2 kWh/day means a household at the entry level can have 2 saving energy lamps for 8 hours per day, while a household at end level is equivalent to 1 fridge, 1 mobile charger, 1 radio, 1 glow lamp, 2 saving energy lamps and 1 ventilator on average use. The specifications of both villages can be seen in table 2.1. From data of several rural area projects [3], [8] can be concluded that the capacity of the small village is around 10 kW and the big village is 200 kW.
per 10 squared meters. This gives an average daily production of 3.5 kWh. It is estimated that the storage should be at least 2 days without any production. Since the solar panels are always producing a low percentage of the energy the reserve power will be more than 2 days. Since both villages currently have a diesel generator this can be used to load the storage system when a long period of cloudy weather is present. This is likely to happen only a couple of times a year.
Small Village Big Village Population 10 households 100 households
Average power use 1 kWh/household p day 2 kWh/household p day Society buildings 1 buildings 10 buildings
Average power use 2.5 kWh/building p day 10 kWh/building p day Total power use 12.5 kWh p day 300 kWh p day
Storage time with low input 2 days 2 days
Capacity 10 kW 200 kW
Area of solar panels 40 m2 800 m2
Total Energy storage 25 kWh 600kWh
Energy storage
In this chapter an overview will be given of the current situation on the developments of en-ergy storage systems. Which options are there and what are their strong and weak points? After this overview an outline will be given of the current projects that are built in the world. This is done because a lot of the projects in the first overview are only theoretically worked out or in a developing state. These storage options should be kept in mind for later projects but are not of any use for this report. The result gives us more input for the comparison between the options of the energy storage for the Pacific islands. There are two different sizes of islands used for this comparison. A small Pacific island with around 10 households and a bigger pacific community with around 100 households. At the end of the chapter they will be compared and conclusions can be drawn.
3.1 Energy storage systems
The application of energy storage can be roughly divided in three groups based on their storage duration and purpose.
• Power Quality
Duration<1min: Used for smoothing and transient stability.
• Bridging Power
Duration=1min-1h: Used for emergency backup and wind power smoothing.
• Energy Management
Duration>1h: Mostly used during peak shaving and time/seasonal shifting .
Not only the application can be divided, also the field of energy storage can be divided into five areas: Mechanical, Chemical, Electromagnetic, Hydrogen and Thermal energy storage systems. All the areas are fundamentally different and use different techniques. The terms and names of the systems are directly cited from a paper by A. E. K. Siraj Sabihuddin and M. Mueller [9].
3.1.1 Mechanical Energy storage
Pumped Hydroelectric Systems (PHS), Compressed Air Energy Storage (CAES) and Fly-wheel Energy Storage (FES) systems are the best known solutions of mechanical energy storage. They all make use of the storage of potential energy or kinetic energy.
Pumped Hydroelectric Systems
Pumped Hydroelectric Systems (PHS) are currently the most dominant systems when it comes to storing massive quantities for long periods. The method is quite basic: there are two reservoirs, one on high ground and one on low ground. This can be seen in figure 3.1. When energy is needed, the system uses water from the upper reservoir through a turbine to generate electric energy from the potential energy. The water is pumped back up again when there is an overgrowth of electricity. PHS systems have a long life, low operation and low maintenance costs which make them suited for big projects. The disadvantage is that it needs certain geographical terrain and besides the height difference the area also has to be large. When the area is a problem a gravity power module is an option. Here the same principle is used but then on lower scale and not only water is pumped upwards but also a piston. This system is closed and much smaller than the PHS. Both systems can be used for grid stabilization and long-term energy storage [9].
Figure 3.1:A Pumped Hydroelectric System [10] Figure 3.2:Gravity power module [10]
Compressed Air Energy Storage
Flywheel
The last mechanical energy storage is a Flywheel Energy Storage (FES). Energy is stored in a rotating mass. Devices are composed of five main subsystems: flywheel, electrical machine, power converter, bearing and containment chamber. These components can be seen in figure 3.4. FES systems are mostly used for short-term storage because of their very low reaction time. This gives them a high efficiency. They have high specific power and power densities for the energy, fast response time and long life. The two main disadvantages are the high self-discharge rates and safety. The self-discharge rate lays around the 3%-40% capacity per hour. The latest improvements have reduced the losses below the 0.1% of superconducting solutions. But these improvements can not yet been used on large scale.
Overall these mechanical energy storage system is fairly mature and commercially tested. While PHS and CAES store for a long time with high capacity, FES still operates on a rela-tively small scale and for short durations [9], [10].
Figure 3.3: Compressed Air Storage System [10] Figure 3.4:Flywheel system [11]
3.1.2 Chemical Energy Storage
Chemical storage has by far the greatest diversity of commercial energy storage products today. Next to this it is the best researched and developed field. These storage systems can be divided into: typical batteries, molten salt and liquid metal batteries, metal-air batteries, fuel batteries and flow batteries. While fuel and flow batteries produce energy on fuel and gas next to storing and are almost generating instead of storing they are excluded from this report.
Typical batteries
nickel cadmium (NiCd), nickel iron (NiFe) and nickel zinc (NiZn) devices. The working prin-ciple of all these batteries is similar, with a positive (cathode), negative (anode) electrodes, the electrolyte and the separator electrons are stored. The measuring of the state-of-charge is an issue which gives some complications. Differences between these batteries can be mostly found in their energy density and the temperature they produce while storing. De-spite big improvements on recycling most batteries still have a big environmental impact [9].
Liquid Metal, Molten Salt and Metal-Air Batteries
In the last years there has been a rise of higher temperature batteries that utilize molten salts and liquid metals. The molten salt batteries are mostly containing Sodium Sulpher (NaS) and Sodium Nickel Chloride (NaNiCl). These batteries utilize liquid/molten salts as electrolytes which also plays the part of electrodes. The electrodes are separated by a solid membrane separator. The biggest issue is the thermal management and because of their liquid state the process should be continued to prevent the molten salts to become solid. NaS batteries normally operate at 300-350◦C. To maintain the temperature heating systems are needed.
The operation of these systems are mostly the reason for efficiency drop. Next to this also safety and environmental issues are disadvantages of these batteries. There are some working examples in Japan and in the United States. The liquid metal electrodes are in a very early stage of development and have not yet seen any commercialized application. This is why they are left out of this report. Metal-air batteries have replaced the second electrode with an air electrode. The two mainly used are zinc-air (Zn-Air) and iron-air (Fe-Air). They offer one of the highest energy of most storage systems in general but most batteries suffer from an extremely poor cycle and shelf life. Zn-Air variations take care of these points: they are cheaper, environmentally better and have a longer storage life. Like molten salts, metal air batteries are sensitive to temperature changes. The latest improvements applied to iron-air (Fe-Air) batteries. Include cycle life of 5000 cycles and efficiency improvements of up to 80%. Which makes them a really good option for large scale energy storage [9].
3.1.3 Electromagnetic
combina-tion of porous separators and electrolyte in place of a dielectric. While they operate at low voltages but have a high capacity, long cycle life and wide operating temperatures [9], [11].
3.1.4 Thermal Storage
Thermal storage is not new on the energy storage market. They have been used extensively in home temperature stabilization as can be seen in figure 3.5. Also on industrial scale thermal power plants and district heating applications have been developed. The use of thermal storage and heat recovery has allowed power plant efficiencies to increase up-to 60% for natural gas plants. Also for solar energy this type of storage is very useful. There are three types of storage that are in front: Sensible Thermal Energy Storage (STES), Latent Thermal Energy Storage (LTES) and reversible Chemical Thermal Energy Storage (CTES). These systems have always three components: the thermal material, the heat exchanger and the containment system [11].
Figure 3.5:Geothermal Heat pump [11]
Sensible Heat Storage
There are two types of Sensible Thermal Energy Storage (STES) systems, active and pas-sive. In passive systems the storage medium is fixed and heat is transferred through a passive heat transfer mechanism. While in active the storage medium is circulating through the system. This could be compared to most heat exchangers. Active systems are slightly cheaper because there are no different tanks needed for cold and hot substances.
Note that these systems differ from the molten salt batteries. For temperatures between 0 ◦C and 100◦C water is the most used option. STES systems are the cheapest form of
Figure 3.6:Thermal storage by molten salt [11]
Latent Heat Storage
Latent Thermal Energy Storage (LTES) utilizes the heat absorbed during phase transition of energy storage. Mainly there are three types of materials commonly used: Organic, in-organic and eutectic. Organic materials are popular but also more expensive. Inin-organic materials include salt hydrates and metallic compounds. These are mostly cheaper but suffer from chemical decomposition after several cycles. The materials can experience tran-sitions between solid, liquid and gas. The solid-liquid phase trantran-sitions are most commonly used due to storage capacity and ease of containment [9].
Reversible Chemical Reaction Heat Storage
3.2 Storage systems analysis
Section 3.1 gave an outline of the most used energy storage systems. These systems are, as has been said before, not all relevant for this project. The analysis is split into two parts, a small village with around 10 households which need a storage device with a capacity of 10kW and a bigger village with 100 households which need a 200kW storage device. In chapter 2 can be read more about the specifications of both villages. For both villages a schemetic overview of the best suitable storage options can be found in Appendix A. The data in this appendix are from multiple systems [9]. Of these systems the minimum, maximum, average value and quantity of each category are presented.
For the smaller village all the storage systems have been filtered on capacity, lifespan and efficiency. The capacity of all the systems should at least have a minimum of 10kW and a maximum average capacity of 2MW. This is because when the average of all the data is too high it is likely to say that these systems are not optimal for a small size solution. Next to this the average lifespan should be at least ten years and the average efficiency should be higher than 80%. There are four solutions that satisfy all these conditions: the Flywheel, Li-Ion battery, Supercapacitor and a Reaction Heat storage system. These are presented in a schematic view in figure A.1.
It can be concluded that when the village wants a storage system which provides energy during the renewable energy time shift it is advisable that the system should at least have a technical maturity of ’mature’. This is because the production is meant to be taken care by pacific companies and the maintenance by local citizens. This makes a reaction heat storage system and a supercapacitor less attractive. Also the environmental impact is of great importance. Most of the time when devices go to the islands they never leave it again. The last two options, the flywheel and the Lithium Ion battery differ on a few subjects. The Lithium Ion battery has a lower self-discharge rate, lower capital cost and most importantly the application for which it is used is most of the time energy management. The flywheel on the other hand has a higher specific power, power density, higher cycle life, lower power capital cost and the environmental impact is much lower.
more. This makes it not a suitable option for the pacific. When we compare the last two options, the sodium sulpher battery and the flywheel, the impact on the environment and the technical maturity of the flywheel is better. Also it has a higher specific power, higher power density, higher efficiency, higher lifespan, higher cycle life and lower capital cost. While for the sodium sulpher battery the energy capital cost is a factor 40 lower and the used application is energy management. Which of these two options is more suitable for the bigger village it depends on the needs of the village. A combination of both should also be a reasonable option.
3.3 Worldwide used storage projects
3.3.1 Diesel generator
Currently most of the villages use diesel generators to produce electricity. When the Energy storage system is installed it should take over the tasks of the generator. The generator will be used as a backup in case of bad weather conditions. In figure 3.7 two examples are given of used diesel generators. It can be clearly seen that there are big differences in size. While the 10kW generator can be transported on a trailer at the back of a car, the bigger 200kW generator is completely different in size. This is also typical for the storage systems and important to keep in mind during the selection an design process.
Figure 3.7:10kW Perkins diesel generator and 200kW John Deere diesel generator
3.3.2 Energy storage exchange project
Figure 3.8:A screenshot of the website: www.energystorageexchange.com [12]
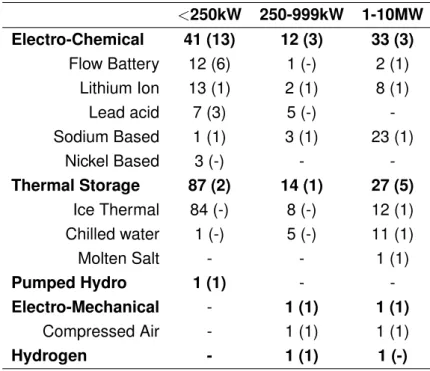
These projects have been filtered on their development status: ”operational” and a minimum length of energy storage of four hours. These projects can be seen in table 3.1. Between brackets can the amount of projects be seen which are already used for renewable energy time shifting. The number in front of the brackets gives the total number of all projects which were filtered. Those projects are not used for renewable time shifting does not mean they cannot be used for it that is why they are included. Unfortunately not all the information on projects is complete so the total does not always match with the specific used method for the storage system.
<250kW 250-999kW 1-10MW Electro-Chemical 41 (13) 12 (3) 33 (3)
Flow Battery 12 (6) 1 (-) 2 (1) Lithium Ion 13 (1) 2 (1) 8 (1)
Lead acid 7 (3) 5 (-) -Sodium Based 1 (1) 3 (1) 23 (1)
Nickel Based 3 (-) -
-Thermal Storage 87 (2) 14 (1) 27 (5)
Ice Thermal 84 (-) 8 (-) 12 (1) Chilled water 1 (-) 5 (-) 11 (1) Molten Salt - - 1 (1)
Pumped Hydro 1 (1) -
-Electro-Mechanical - 1 (1) 1 (1)
Compressed Air - 1 (1) 1 (1)
Hydrogen - 1 (1) 1 (-)
Table 3.1:Used energy storage with: storage capacity >4 hours, operational status and
between brackets used for renewable time shift.
dominate in the lower capacity region, the Sodium based battery, Ice thermal and Chilled water dominate in the high region. This matches the conclusion made in section 3.2 where in the lower region the Lithium Ion battery was found as one of the best options. The high use of Ice Thermal storage could be explained by the projects of Ice EnergyR in California.
They use energy stored in ice which will be used later for their air-conditioning. So there will not be any electricity gained out of the storage again. The same goes for chilled water energy storage system but then stored in water.
When the results in table 3.1 are compared with the results found in the earlier section even here in both the Lithium Ion and Sodium based battery are highly used. The use of thermal storage did not come out the previous section. This is because the Ice Thermal storage and chilled water storage do store energy in water or ice for the use of cooling systems and do not make electricity out of the energy.
3.3.3 Tesla Powerwall
Concepts
4.1 Concept Choice
This project is focusing on the small village of 10 households with an average size of 5 per-sons per household. This village has one community building and needs an energy storage system with a capacity of 10 kW. When all the possible energy storage systems are reviewed it can be concluded that it looks like the Lithium-Ion battery has the best specifications. In figure A.1 can be seen that the Lithium-Ion battery is strong on the specific energy [Wh/kg], energy density [Wh/m3], efficiency, low self-discharge rate [%/day] and low energy capital
cost [US$/KWh]. But a big point of interest is the environmental impact which is higher in the Pacific since most products never leave the Pacific islands after purchase. The production of the battery in the Pacific will be a problem because all components need to be bought over-seas. That is not the case with a flywheel energy storage. Because of its material and the maturity of the system it is possible to produce in the pacific also the environmental impact is much lower then from a battery. This is why in this project the flywheel has been chosen to continue with.
4.2 The flywheel
The flywheel is a mechanical energy storage system that has been used for a long time. Most of the time it is used for a short energy storage to take the fluctuations out of the electrical grid. Because a flywheel is made of simple composites and metals it is considered as an environmental friendly way to store energy. The principle is that energy is stored in a rotating mass that speeds up. This increases the kinetic energy. By reducing the speed the kinetic energy is released and the flywheel can power the grid. A basic layout is given in figure 4.1. The energy that can be stored in a flywheel can be calculated by eq. 4.1.
W = Iω 2
2 (4.1)
Where ω is the angular velocity [rad/sec] and I is the moment of inertia [kgm2] which is
known for a solid cylinder as eq. 4.2. From these equations can be seen that for the energy
Figure 4.1:Basic layout of a flywheel energy storage [13]
three factors are important: the massm, radiusr and angular velocityω.
I = 1 2r
2m (4.2)
When the flywheel rotor is designed it is important to know how much of the stored energy will be lost due to other factors. The biggest losses in most flywheels are in the bearings, air friction from the flywheel rotor and motor efficiency. To make these losses as small as possible or even cancel them. The design need to be improved. Most flywheels use a vacuum to cancel the air friction of the rotor but this requires more cooling. This is why most low speed flywheels use a low vacuum and not a high vacuum so the flywheel benefits from both worlds.
4.3 Requirements
Now that all these facts are known the requirements for the flywheel design can be listed. These can be seen in table 4.1. Also an explanation of each individual requirement is given.
• Size: The size of the load space of a trailer is 1.5m x 2m x 2m which will most likely be
used for transport in rural areas.
• Weight: Most pickups can carry a trailer that has a maximum load of 4000 kg. • Capacity & Energy stored: These specifications are described in section 2.3.
• Cost: The average paid cost in the Pacific are around US$ 0.40/kWh [14].
Requirements Size 1.5m x 2m x 2m Weight prefer<4000kg
Capacity 10 kW Energy stored 25 kWh
Cost 36 100 FJD (=US$ 17 028) Production in the Pacific Flywheel and casing
Maintenance >5 years without any maintenance
Lifespan >15 years
Environmental impact 80% should be recyclable
Table 4.1: Requirements for the flywheel to design
• Production in the Pacific: Flywheel and casing.
• Maintenance & Lifespan: In the rural area it is important that the maintenance period
and lifespan are from a descent period due to the long travel times to the area.
• Environmental impact: ”What comes to the island never leaves the Pacific islands.” Is
Detailed Design
The design of a flywheel can be split in two different groups of components which needs to be designed separately. The first group is the flywheel rotor itself. Because this rotor gives the specifications for the second group, the shaft of the flywheel. The shaft will be designed afterwards. This shaft will support the rotor and makes sure no fluctuation in other planes are possible during the rotation. When all these components are designed losses can be calculated and the designs can be optimized with the newly gathered data.
5.1 Flywheel Design
For the design of the flywheel rotor two important decisions have to be made. These de-cisions concern the material and shape of the rotor. But not all the shapes are possible to make with each material. The four most common shapes and their materials can be seen in figure 5.1. In this figure is also the shape factorK[−]of each flywheel shape listed. This
factor gives combined with the maximum work strengthσu [P a]and the densityρv [kg/m3],
the energy per massWM [J/kg]by equation 5.1.
WM =Kσu
ρ (5.1)
Figure 5.1:Shape factor of common flywheel shapes [15]
It is estimated that a maximum speed drop of 50% is allowed [13]. Since the working strength is related to the square angular speedω2. The active energy in the rotor is 75% of the total
stored energy in the flywheel. From the requirements is known that this ’active energy’ should be equal to 25 kWh. The maximum rotation speed for a low speed flywheel is 10 000 rpm [10]. This results in a minimum rotational speed of 5 000 rpm.
In this report three possible materials are covered: High tensile Steel AISI 4340, S2-glass and Carbon T1000. The two last materials are composites and are only applicable in the design of a thick or thin rim. The high tensile steel has also been tested in a Laval disk. The solid disk has been taken out of consideration since the Laval disk has all the advantages of the solid disk and less disadvantages. The specifications of all the three materials are listed in table 5.1. Where the maximum allowable working stressσu is calculated by dividing the
yield strength by a safety factornof 1.5 for metal material. For the composite materials the
ultimate tensile strength is divided by a safety factornof 2.0.
Densityρ Working Stressσu Poisson ratioν Price
Steel AISI 4340 7830[kg/m3] 486[M P a] 0.29 1.00[$/kg]
S2-glass 1920[kg/m3] 735[M P a] 0.22 24.60[$/kg]
Carbon T1000 1520[kg/m3] 975[M P a] 0.20 101.80[$/kg]
Table 5.1: Material specifications [source: www.matweb.com] & [13]
Thick Rim
There are two stress components that are important in the design of a flywheel rotor. The radial stress presented in eq. 5.2 and the hoop stress expressed by eq. 5.3 [13].
σr(r) = 3 +ν
8 ρω 2r2
0+r21− r2
0r12 r2 −r
2 (5.2)
σθ(r) = 3 +ν
8 ρω 2r2
0+r21+ r2
0r12 r2 −
1 + 3ν 3 +ν r
2 (5.3)
Whereρ is the mass density [kg/m3],ω is the rotational speed[rad/sec],ν is the Poisson
ratio, r0 is the outer radius of the rotor [m], r1 is the inner radius of the rotor [m] and r
represent any radius within the rotor [m]. It can be seen from simulations that the hoop
stress in a thick rim rotor is much higher than the radial stress. Next to this the hoop stress is at its maximum at r1. When designing on the hoop stress of the inner radius the total
stored energy W [J] can be calculated by: W = 1 2Iω
2. Where I is the moment of inertia [kgm2]. The best rotor configurations are calculated per material and are listed in tabel 5.2.
r1[m] r0 [m] h[m] m[kg]
Steel AISI 4340 0.050 0.260 7.645 12 370 S2-glass 0.468 0.617 1.5 1 460 Carbon T1000 0.217 0.594 1.5 2 190
Table 5.2: Configurations of a thick rim flywheel withW = 25kW h
Thin Rim
When designing a thin rim flywheel the procedure is similar to the hollow disk. The simpli-fication which can be done is that due to the small crossing area the hoop stress can be taken as constant. Then eq. 5.3 can be simplified to eq. 5.4. [15]
σθ =ρr21ω2 (5.4)
With this equation the best configurations of a cylindrical flywheel can be calculated and are shown in table 5.3.
r1[m] r0 [m] h[m] m[kg]
Steel AISI 4340 0.135 0.23 13.10 11 920 S2-glass 0.49 0.59 2.29 1 488 Carbon T1000 0.44 0.54 3.85 1 804
Table 5.3:Configurations of a thin rim flywheel withW = 25kW h
Equal stress Design
The equal stressed disk is also known as the Laval disk. As has been shown in figure 5.1 this shape is due to material properties only made from metals. The main reason for the usage of the Laval disk is the high shape factorK which results in a higher energy storage
per mass. The shape of an equally stressed disc can be obtained from the known equations of equilibrium and compatibility written in terms of stresses for linear, isotropic material with constant characteristics [16].
d(σrrh)
dr −σθh+ρω
2r2h= 0 (5.5)
(σθ−σr)(1 +ν) +r
dσθ
dr −νr dσr
dr = 0 (5.6)
Ifσr=σθ =σu =constthen from eq. 5.5 can be the profileh(r) [m]computed. This profile
is given in eq. 5.7. Eq. 5.6 satisfies the conditions.
h(r) =hce−Bχ
2
(5.7)
With dimensionless constantsB = ρω2r02
Figure 5.2:Constant-stress disc with constant-thickness outer rim [16]
The problem with this profile is that the radius goes to infinity. To create a boundary on the infinite profile a rim is needed at the end of the profile [16]. By creating a rim also the shape factor goes down. Withβ = rD/r0 as the ratio between the beginning of the rim and the
outer radial andα =h0/hD as the ratio between the thickness of the rim to the connection
point. Both can be seen in figure 5.2. The radial thicknessβdepends not only onBbut also
onα. [16]. This relation is shown in eq. 5.8 and by this the relation to shape factor can be
determined and is shown in eq. 5.9.
β= v u u
t 1
Bα
h
α−1 + 2 s
α2B(B−1 +ν) (1−ν)2 +
(α−1)2 4
i
− 1 +ν
1−ν (5.8)
K= 1 + [αB
2(1−β4)/2−Bβ2−1]e−Bβ2
1 + [αB(1−β2)−1]e−Bβ2 (5.9)
In table 5.4 are the two best configurations for a steel equal stress disk with a rim and with a small rim been shown. The profile of the flywheel rotor with rim can be seen in figure 5.3.
r0[m] hc[m] m[kg] hD [m] rD [m]
Steel AISI 4340 with a small rim 1.0 0.737 1934 - -Steel AISI 4340 with rim 0.525 0.752 2140 0.195 0.391
Figure 5.3:The profile which results from eq. 5.7 and in red added the rim.
Conclusion
A model of all the designs from this section can be seen in figure 5.4 on scale in comparison to a human. In the requirements is stated that the design should fit in a box of 1,5m x 2m x 2m. Only four of these designs will fit in this box. Since all four designs deliver the same power and work at the same rotation speed. Cost and production are the next criteria. Since the cost per kg differs a lot per material (table 5.1) but the total weight per design does not that significant. It can be concluded that the Steel AISI 4340 equal stress disk is the best option. The bigger rim will add some extra weight but decreases the area by a factor 4 this will make the production more easy. With the Laval disk with rim we will continue in this report.
5.2 Shaft and Bearing Design
The flywheel can be positioned horizontal and vertical. Both configurations have no influence on the efficiency or stored energy of the flywheel. But for safety reasons it can be reasoned to place the flywheel underground. In case of a collapse the freed energy will be lost in the ground and not in flying particles through the air. For this situation a vertical configuration is more save since the swing area is all covered by ground. A vertical shaft has two options it can go through the flywheel or connects the top and bottom by two different shafts. The single shaft is the most common used shaft. It is easy in production and the chances for a misalignment in the flywheel are low. The big disadvantage is that for an equal stressed disk the allowed stress is halved when the shaft goes through the flywheel [16]. Two shafts on both ends do not have this disadvantage and so the flywheel does not have to increase in size.
Bearing Selection
In a flywheel design a lot of different types of bearings can be used. For high speed fly-wheels it is recommended to use magnetic or superconducting bearings to reduce the high frictional losses. Since this design is a low speed there are less frictional losses and me-chanical bearings become also an option. Capital cost and simple production methods are of great importance in this design and both are lower for mechanical bearings. For this reason mechanical bearings are chosen for this project.
Figure 5.5: Angular contact bearing [17]
The most important requirements are the ro-tational speed of 10 000 rpm and the esti-mated axial load of 25 kN from gravity force of the flywheel rotor and connected compo-nents. From the SKF catalogue [17] can be seen that, for a high axial load and high ro-tational speed, angular contact ball bearings are the most recommended bearings. This bearing is shown in figure 5.5. The angu-lar contact bearings are divided in two types: Single row angular contact ball bearings and Four-point contact ball bearings [17].
Both the single row bearing and the four-point bearing types have bearings that fullfill all the recommendations. To compare these bearings the resulting friction is important. This can be calculated by eq. 5.10 [17]. WhereM [N mm]is the frictional moment,µ[−]is the
constant coefficient of friction for the bearing,P [N]is the equivalent dynamic bearing load
andd[mm]is the bearing bore diameter. The coefficient of friction is slightly higher for the
M = 0.5µP d (5.10)
From this equation can be concluded that the best option for the bearing is the four point con-tact ball bearing with a bearing bore diameter of 25mm, QJ 305 N2MA. More specifications can be found in table B.1 in appendix B.
Shaft Design
For the shaft design it is important to know the torque and moment force which are applied on the shaft. Since it is decided to make use of a vertical shaft the moment forces can be assumed as zero. The required torque force applied on the shaft can be calculated by eq. 5.11. WhereP [W]is the power which needs to be delivered to the households and is known
from the requirements of the design andωmin [rad/sec]is the minimal operational angular
rotation speed. This results in a torque forceT = 19N m
Tm =
P ωmin
(5.11)
When the torque is known, stresses can be calculated by the resulting torque and momen-tum on the shaft. These relations are given in eq. 5.12 and eq. 5.13 [18].
σa=
32KfMa
πd3
2 + 3
16Kf sTa
πd3
21/2
(5.12)
σm =
32KfMm
πd3
2 + 3
16Kf sTm
πd3
21/2
(5.13)
WithKf and Kf s [−] as the fatigue stress concentration factors, Mm [N m] the mid-range
applied momentum,Ta [N m]the alternating applied torque andTm [N m]the mid-rage
ap-plied torque. To see if the stresses are not fatigue for the shaft there are different criteria that can be used. This research will focus on the Gerber criteria. The Gerber criteria is a measure of the average behaviour of ductile materials on fatigue resistance. For the shaft design the Gerber failure criteria are being used. The criteria is given in eq. 5.14 [18].
nσa Se + nσm Sut 2
= 1 (5.14)
Withnthe factor of safety,σa [P a]the alternating stress amplitude, Se [P a]the endurance
limit,σmas the midrange stress andSut[P a]as the ultimate Tensile strength. The endurance
rotations are between106 and ∞. With the equations for the alternating stress amplitude
and midrange stress given in eq. 5.12 and eq. 5.13 [18]. The Gerber criteria eq. 5.14 can be rewritten into eq. 5.15.
d= 8nA πSe 1 +
1 + 2BSe ASut
2
1/21/3
(5.15)
With:
A= q
4(KfMa)2+ 3(Kf sTa)2 (5.16)
B= q
4(KfMm)2+ 3(Kf sTm)2 (5.17)
The equation can be simplified by the assumption that the load and torque are constant during the operation of the flywheel. In reality these forces will fluctuate but it will fluctuate so slow that it can be assumed that the shaft behaves as it is under constant worst case conditions. This makes Mm = 0 and Ta = 0. Because of the vertical shaftMa = 0. This
results inA= 0andB =√3Kf sTm. Which will results at last in eq. 5.18.
d=
16n√3Kf sTm
πSut
1/3
(5.18)
Now that the equation is simplified the shaft can be designed. The material which is used for the shaft will be SAE 1020 HR. With a tensile strength Sut = 380M P a. For production
reasons a filling with a radius of 1mm is assumed to be reasonable. From figure 5.6 the value forKts can be found. To find theKf s in figure 5.7qscan be found. qs andKts give in
equation 5.19Kf s. With thisdcan be calculated from 5.18.
qs=
Kf s−1
Kts−1
(5.19)
From these figures and equations can be concluded that the shaft diameter should be at least 19.3mm. These calculations are done with a radius filling of 1mm and a safety factor of 10. Because 19.3 mm is smaller than the inner bearing diameter of 25mm. The shaft design will be based on the bearing. The shaft dimensions are presented in app. C with the same radial, safety factor and factor between d/D. It is safe to use.
Next to stress, buckling can be a problem. The maximum force before the risk of buckling occurs can be calculated by eq. 5.20. HereFmax [N]is the maximum applied force before
the chance of buckling occurs,E[P a]is the youngest modulus,D[m]is the outer diameter, d[m]is the inner diameter andL[m]is the unsupported length. It is assumed that the shaft
is a cylinder since the bottom of the shaft is only supported by the bearing and not on the inner diameter.
Fmax =
π3∗E∗(D4−d4)
32∗(0.5∗L)2 (5.20)
This results in aFmaxthat is a factor thousand higher than the gravity force of the flywheel.
It can be concluded that no buckling occurs.
Flange
To connect the shaft with the flywheel rotor a flange is needed. The flange distributes the torque force from the shaft through the flywheel by four bolts. The requirements of the flange can be seen in app. C. The flange is designed following the usual proportions for a flange [19]. These can be seen in figure 5.8. Here can be seen that the outside diameter of the hubD = 2d, the length of the hub L = 1.5d, the pitch circle diameter of boltsD1 = 3d,
the outside diameter of flangeD2 = 4dand the thickness of flange istf = 0.5d. At last there
is chosen for a four bolt to ensure a good connection.
To check if these usual proportions are adequate it is important to know if this flange can manage the stresses that result out of the given torque. This can be done by five formulas eq. 5.21 - 5.25 [19]. The first formula is based on the torque that is transmitted through a hollow shaft. It is assumed that the hub is a hollow shaft and so this formula can be used. Here τcis the allowable shear stress for the flange material. For commonly used cast iron
τc= 8M P a[19].
T1max=
π 16 τc
D4−d4 D
(5.21)
The second and third equation are based on the key which is inside the shaft. After fixing the length of the key in the shaft the induced shearing and compressive stresses may be checked. Here the maximum torque is calculated based on the maximum of these two stresses. HereL[m]is the length of the key,w[m]is the width of the key,τk[P a]is maximum
allowable shear stress for the key material. For most key materialsτk= 40M P a. [19].
T2max=L w τkd/2 (5.22)
The third equation is based on the compressive stresses. Heretis the thickness of the key
andσcis the allowable compressive stress for the key material. Which can be assumed for
most key materialsσc= 80M P a[19].
T3max=L t/2σc(d/2) (5.23)
The fourth equation is based on the shearing stresses within the flange. The torque is the circumference of hub, times the thickness of the flange, times the shear stress of flange times the radius of the hub.
T4max=π D tf τcD/3 (5.24)
The last equation to check is the maximum torque the bolts can transmit before failure oc-curs. Hered1 is the diameter of the bolt,τb[P a]is the maximum allowed shear stress in the
bolt andnis the number of bolts that is used in the flange.
T5max=
π 4(d1)
2 τ
b n D1/2 (5.25)
Now that we have equations for the maximum torque in the hub, key, flange and bolts the results can be calculated. These are listed in table 5.5. It can be concluded that the standard proportions of the hub are thick enough for this design with a safety factor of at least 3. Which suits perfect for this project.
Tneeded T1max T2max T3max T4max T5max 19 Nm 386 Nm 61.4 Nm 153.6 Nm 2470.6 N m 452.4 Nm
5.3 Tolerances
The tolerances are an important part of the design. When tolerances are not used in the right way it can lead to failure during assembly or parts getting loose during use of the product. The table for the selection of fits and hole basis system [18] is used to find the right tolerances for the project. When assembling the components, the first components to connect are the shaft with the flange. Because this part will transmit all the torque forces from the motor to the flywheel a heavy press fit is needed. A heavy press fit means that the tolerances are so close to each other that the two pieces only fit when a heavy press is used. This results in the tolerances which are listed in table 5.6. For the connection between the flange and the shaft a heavy push fit is chosen. This means the tolerances slightly not fit. But can be connected by an easy tick with a hammer or easy controlled press. The last fit is that of the flywheel with the flange. This fit is not necessary for transmitting the torque. This is done by the bolts which connect the flange with the flywheel. To prevent an over-constrained situation where the fit blocks the bolts from fitting the tolerances of this connection is a course tolerance. All these tolerances can be seen in table 5.6.
Dimension Fit Basic size Min. Tol. Max. Tol.
Flywheel Flange connection Course tolerance 128mm 0µm +250µm Flange Outer diameter Course tolerance 128mm -200µm -450µm
Inner diameter Heavy press 32mm 0µm +43µm Shaft Top diameter Heavy press 32mm +25µm +59µm
Bottom diameter Heavy push 25mm +21µm +28µm Bearing Inner diameter Heavy push 25mm 0µm +15µm
5.4 Losses
In section 4.2 the loss components have already been discussed. Now the flywheel is de-signed these losses can be estimated and when they are out of proportion changes have to be made in the design. First an estimation of the air friction will be made and after this the friction in the bearing will be calculated and conclusions will be made.
Air friction
The friction which is caused by the speed difference between the flywheel rotor and the air can cause high frictional losses. The equation which is known for a rotating circular disk in air is presented in equation 5.27 [20]. The flywheel in this design is not a circular disk but the values give an estimation of the proportion of the losses. This is why only global conclusions can be made later when a more detailed design is made better simulations are needed. In the equation the power loss Pa,l [W] with ρa as density of a gas [kg/m3], βa the dynamic
viscosity of the gas[P a·s],ω the angular speed[rad/s],r radius of the flywheel[m]andh
the height of the flywheel[m].
Pa,l = 0.04·ρa0.8·βa0.2·(ω·r)2.8·(2·r)1.8·(α+ 0.33) (5.26)
With:
α= h
2·r (5.27)
To compare four different gases it is assumed that the temperature in the flywheel stays at 50◦C. The four gases which have been chosen are Air, Ammonia, Helium and Hydrogen.
These gases are chosen for their low density and low viscosity at 50◦C. In figure 5.9 can be
seen that when the pressure is lowered the power loss will decrease. It can also be seen that when the flywheel rotates at atmospheric pressure in air; the power loss will be 261kW. This is over 10 times the storage capacity of the system. An combination of other gases and lower pressure brings a solution to the problem and could bring the losses to a low level. In figure 5.10 shows the air friction depending on the rotational speed. For this example is chosen for a Helium gas at a pressure of 0.001 bar. This is within the range of mechanical pumps which can go to 10−5 bar. It can be concluded from this graph that when the motor
Figure 5.9: Extra torque force due to the air friction.
Figure 5.10:Air friction on flywheel Helium at 10−3bar.
Bearing losses
Since in the previous section is concluded that low pressure conditions are needed around the flywheel rotor. The bearing needs to be sealed to keep the bearing clean and to protect the lubricate from flowing out of the bearing due to pressure differences. For an angular contact ball bearing three sealing options are provided by SKF [17]. The first option is placing a shield between the inner and outer cylinder of the bearing. Shields are made of sheet steel and cover both sides of the bearing. The second option are contact seals. Contact seals have the same position as shields. Seals are made of NBR and are reinforced with a sheet steel insert. The last option is an external sealing which will seal the bearing area around the bearing so no sealing is needed between both rings. Which of these options is more beneficial should be investigated in a later and more detailed design.
The second biggest loss of the flywheel will be the bearing on the bottom shaft. In the section shaft design eq. 5.10 has been used to pick a bearing with the lowest loss. This is a rough estimation of the frictional moment. The exact frictional moment can be calculated by summiting the rolling frictional momentMrr, sliding frictional momentMsl, frictional moment
of seals Mseal and the frictional moment of drag losses Mdrag. The equations for all the
individual losses can be found in the catalogues of SKF [17]. The calculated total frictional moment results in aM = 1.41N m. From this can be calculated that the power loss will be
5.5 Safety and Lifetime
Safety
Safety is a big issue when energy is stored in the flywheel. Since the flywheel rotates with 10 000 rpm, with a radius of 0.525 m the outer particles of the flywheel have a speed of 550 m/s. To ensure flywheel componants would not go flying around in case of a failure, safety measures are needed. A good first safety layer around the flywheel would be the vacuum surrounding. But since a low pressure around the flywheel rotor is an option a second layer of safety is needed. There is chosen to place the flywheel in a concrete case. This case will be placed underground so all the energy that come lose when a failure occurs will be covered. Particles will first hit the concrete wall and second the loose ground behind the wall. This will fully protect the citizens of the village. The situation can be seen in figure 6.1.
Bearing lifetime
The last point of interest is the life time of the bearing. This can be calculated by the SKF rating life [17]. This method is done by equation 5.28 which gives the life time of the bearing under a certain load. Herea1 is the life adjustment factor for reliability which is 0.55 for a
reliability of 96%,askf is the SKF life modification factor which can be found trough tables
in the catalogue of SKF [17],C is the basic dynamic load rating[kN]and P the equivalent
dynamic bearing load[kN]. For a vertical shaft with only a axial load, the equivalent dynamic
load can be calculated byP = 1.07Fa.
Lnm=a1·aSKF
C P
3
(5.28)
From the SKF rating life can be concluded that this bearing under the load of the flywheel rotor will live at least 8.8 million revolutions. For most bearings this would be a good amount but since the flywheel rotates with 5 000-10 000 rpm. The life time is less than a day. Other bearing options discussed in earlier sections were also analysed but did not have a higher life time. In most flywheels with mechanical bearings the bearing is supported by permanent magnets. These magnets support the axial force and by this lowers the equivalent dynamic bearing loadP. A support of 87.5% of the load would give the bearing a lifetime of 418 days.
5.6 Dynamic model
The dynamic model of the flywheel can be used to simulate the behaviour of the flywheel and to design a controller for the rotational movement. One of the important simulations is to look for eigenfrequency’s and eigenmodes. In section Losses are the two most important losses discussed. These where the bearing frictional losses and air frictional losses. For the dynamic model the pressure around the flywheel rotor is taken at 10−3 bar Helium and the
magnetic supported on the bearing will be 22 kN. This makes the resulting axial force from 25kN reduced to 3kN on the bearing. The bearing frictional moment forceMb [N m]can be
seen in eq. 5.29. This formula is estimated by given data from the catalogue of SKF [17] and the function is derived from these data point.
Mb= 5.4·10−6·ω+ 0.106 =αω+β (5.29)
With the equationT = P
ω eq. 5.27 can be rewritten and simplified to eq. 5.30. WhereTair [N m]is the torque force by the air friction on the flywheel rotor.
Tair = 0.1393·ρa0.8·βa0.2·r4.6·(α+ 0.33)·ω1.8=γ·ω1.8 (5.30)
When the summation of moment forces around the ax of the flywheel rotor is made. Eq. 5.32 can be obtained. WhereM(t) [N m]is the resulting moment from the electric motor.
X
M =M(t)−Mb−Tair (5.31)
Jθ¨=M(t)−αω−β−γ·ω1.8 (5.32)
This can be rewritten to the standard form eq. 5.33.
" ˙ x1 ˙ x2 # = " ˙ ω ˙ θ # = " α1
Jω−β
1
J −γ ω J 5 √ ω4 ω #
+M(t) " 1 J 0 # (5.33)
With moment of inertia J = 219.3kg·m2 for the flywheel rotor, found by Solidworks. The
Conclusions and Recommendations
6.1 Conclusions
A rough design of the flywheel has been made. The design has a Laval disk with the height of 0.752 m, radius of 0.525 m and mass of 2140 kg. This flywheel rotor is held in place by two shafts which are connected by flanges to the flywheel. Both can be seen appendix C. The bearing QJ 305 N2MA is chosen and fullfills all the specifications except the lifetime, see recommendations. The losses in the flywheel are high but with the modification of a vacuum and magnetic support on the bearing they can be dealt with. The safety of the flywheel is guaranteed by an underground concrete box so flying particles in case of a failure are captured in the ground. After this research can be concluded that designing a flywheel meeting the specifications is possible. Still, further research is needed to make the flywheel design more complete and more efficient. Compared to the Tesla Powerwall the flywheel will be more expensive, heavier and bigger than the Tesla Powerwall. On the other hand the flywheel storage creates employment in the Pacific, has far less impact on the environment and has potential to a longer life time.
6.2 Recommendations
After this research a few recommendations can be made. These are advised to be the next step to make sure that the flywheel would be beneficial in use.
• Losses: A more detailed research needs to be done to calculate all the losses and to
calculate the efficiency of the flywheel.
• Bearing lifetime: The bearing lifetime is far too low. An option to solve this problem is
by a magnetic support on the bearing.
• Motor design: The motor design needs much more detail to see what is needed and
what are the costs. The dynamic model is a good start. Also a stability analysis is needed.
• Lastly, the interaction between the flywheel and the solar panels should be evaluated.
[1] L. Mofor, M. Isaka, H. Wade, and A. Soakai, “Pacific Lighthouses, Renewable En-ergy Roadmapping for Islands,” Report by The International Renewable EnEn-ergy Agency IRENA, 2013.
[2] Unknown, “Special edition on the occasion of the Renewables and Islands Global Sum-mit,” Report by The International Renewable Energy Agency IRENA, 2012.
[3] “Go 100 percent.” [Online]. Available: http://www.go100percent.org/
[4] M. Dornan, “Solar-based rural electrification policy design: The Renewable Energy Service Company (RESCO) model in Fiji,”Energies, vol. 36, pp. 797–803, 2011.
[5] ——, “Access to electricity in Small Island Developing States of the Pacific: Issues and challenges,”Elsevier, vol. 31, pp. 726–735, 2014.
[6] T. Urmee, D. Harries, and A. Schlapfer, “Issues related to rural electrification using renewable energy in developing countries of Asia and Pacific,” Elsevier, vol. 34, pp.
354–357, 2009.
[7] Unknown, “National Sustainability Development Report part B. Energy,” https://sustainabledevelopment.un.org/ a website of the United Nations, 2006-2007.
[8] ——, “Fiji’s Hydro Potential Report Volume 1,” Report by Fiji Department of Energy, 2009.
[9] S. Sabihuddin, A. E. Kiprakis, and M. Mueller, “A Numerical and Graphical Review of Energy Storage Technologies,”Energies, vol. 8, pp. 176–216, 2015.
[10] D. Joshi, “Energy storage technology application for grid and frequency control an an-cillary service.”
[11] “Opslagtechnieken,” Energiegids.nl, Zonne-energie en opslag, pp. 13–16.
[12] “Website of Sandies Corporation and USA Department of Energy.” [Online]. Available: http://www.energystorageexchange.com/
[13] B. Bolund, H. Bernhoff, and M. Leijon, “Flywheel energy and power storage systems,”
Renewable and Sustainable Energy Reviews, vol. 11, pp. 235–258, 2007.
[14] Unknown, “Clean Energy in Island Settings: IRNEA’s Initiative for promoting the Envi-ronment for Renewable Energy Deployment in Small Island Developing States,” Report by The International Renewable Energy Agency IRENA, March 2015.
[15] R. Ostergard, “Flywheel energy storage a conceptual study,” Ph.D. dissertation, Upp-sala Universitet, 2011.
[16] G. Portnov, I. Cruz, F. Arias, and R. P. Fiffe, “Flywheels for Low-Speed Kinetic Energy Storages Systems,” Dec 2003.
[17] SKF, “Rolling Bearings Catalog 2012,” PUB BU/P1 10000 EN, Oct 2012.
[18] D. R. Aitchison, “Course Material Mechanical engineering design course USP,” Course Code: mm324.
[19] R. Khumi and J. Gupta, A textbook of machine design. Eurasia publishing house,
2005.
[20] X. Zhang and C. Mi,Vehicle Power Management. Springer, 2011.
[21] A. Kumar and T. Weir, “Wind power in Fiji a preliminary analysis of the Butoni wind farm,” Oct 2008.
Appendix A
Data of energy storage systems
Bearing QJ 305 N2MA
Principal dimensions
d 25 mm
D 62 mm
B 17 mm
Basic load ratings
DynamicC 42.5 kN
StaticC0 30.0 kN Fatigue load limit
Pu 1.27 kN
Speed ratings
Ref. Speed 15 000 rpm Limiting speed* 20 000 rpm*
Mass
m 0.29 kg
Dimensions
d1 34 mm
D1 49 mm
r1,2min 1.1mm
a 30 mm
Abutment and fillet dimensions
da−min 32 mm
Da−max 55 mm
ra−max 1 mm
Table B.1: Bearing specifications [17]
Figure B.1: Basic design [17]
Figure B.2: Abutment and fillet dimensions [17]
*The limiting speed should be reduced to 70% when a vertical shaft is used.
Drawings Shaft and Flange
The drawings start on the next page.
128
-
-
0,200
0,450
64
16
48
R5
R5
96
A
10
+
0,023
0
5
+
0,019 0
20,199
+
0,035 0
R16 +
0,043
0
10
10
SECTION A-A
FACULTY OF ENGINEERING
PROJECTION
METHOD UNLESS STATEDOTHERWISE: DATE
TOLERANCES 0,5 MM
MATERIAL SURFACE FINISH TITLE
DRAWING NO.
REV.
DIMENSIONS IN MILLIMETERS SHEET 1 OF 1
A4
DRAWN SCALE CHECKED Niels Leijtens --29-10-2015 1:301
Cast Iron
--Flange
flange--FILE / PART NAME
1
100
25
+ +
0,028 0,021
R1
32
+ +
0,059 0,025
5
+ +
0,027 0,012
10
+
0,018
FACULTY OF ENGINEERING
PROJECTION
METHOD UNLESS STATEDOTHERWISE: DATE
TOLERANCES 0,5 MM
MATERIAL SURFACE FINISH TITLE
DRAWING NO.
REV.
DIMENSIONS IN MILLIMETERS SHEET 1 OF 1
A4
DRAWNSCALE CHECKED
Niels Leijtens
--27-10-2015 1:2
01
Cast Iron
--Shaft
shaft
--FILE / PART NAME

![Figure 2.2: The access to power to the GDP per South Pacific country (2011) [2], [5]](https://thumb-us.123doks.com/thumbv2/123dok_us/9787590.479896/7.892.230.708.538.830/figure-access-power-gdp-south-pacific-country.webp)
![Figure 3.1: A Pumped Hydroelectric System [10] Figure 3.2: Gravity power module [10] Compressed Air Energy Storage](https://thumb-us.123doks.com/thumbv2/123dok_us/9787590.479896/12.892.155.766.620.826/figure-pumped-hydroelectric-figure-gravity-compressed-energy-storage.webp)
![Figure 3.5: Geothermal Heat pump [11]](https://thumb-us.123doks.com/thumbv2/123dok_us/9787590.479896/15.892.211.728.477.751/figure-geothermal-heat-pump.webp)
![Figure 3.6: Thermal storage by molten salt [11] Latent Heat Storage](https://thumb-us.123doks.com/thumbv2/123dok_us/9787590.479896/16.892.207.733.130.460/figure-thermal-storage-molten-salt-latent-heat-storage.webp)

![Figure 4.1: Basic layout of a flywheel energy storage [13]](https://thumb-us.123doks.com/thumbv2/123dok_us/9787590.479896/22.892.237.739.158.416/figure-basic-layout-flywheel-energy-storage.webp)