Abstract-Customer satisfaction and quality management has become a strategic issue for companies in the new millennium. This paper attempts to address the twin issues of the Post-HoQ analysis and its interpretation through SWOT. The development and mechanics of QFD model is presumed to be known to the followers and the paper deals specifically with post-HoQ model through a well-defined and structured approach to comprehensive matrix analysis. The outcome of the study is a comprehensive solution which discusses post-matrix analysis through its underlying concepts, requisite steps and information, and the involved computations.
Index Terms- Quality Function Deployment, House of Quality, SWOT, Prioritization, Effective Decision Making.
I. INTRODUCTION
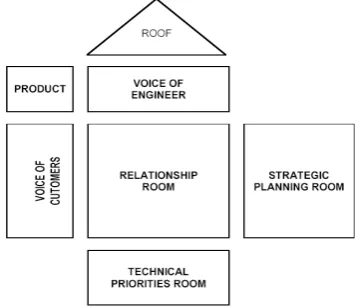
[image:1.595.78.258.523.677.2]Quality Function Deployment is an innovative approach bringing quality - as demanded by the customers - upstream into the product development process [1]. QFD is a systematic process for helping a business to focus on its priorities, investments and its customers. It uses cross-functional teams to identify and resolve issues involved in providing products, processes, services and strategies to meet or exceed customer expectations [2]. QFD is an excellent strategic planning tool because it creates customer focused alignment in the planning process [3]. Basic Building Blocks of House of Quality - QFD are given in Fig. 1.
Figure 1: Basic building blocks of House of Quality
Dr. J. R. Sharma is Associate Professor with the Institute of Management of Technology, Napur, M S, INDIA (Phone: +91-9890692590; e-mail: [email protected]).
Dr. S. Singh is Assistant Professor with the Institute of Management of Technology, Napur, M S, INDIA (Phone: +91-9890692590; e-mail: [email protected]).
II.COMPREHENSIVE MATRIX ANALYSIS
In conventional implementation of QFD, after the collection and compilation of all the customer and technical data in the QFD Matrix i.e. after the preparation of horizontal table and vertical table - further analysis is usually done empirically and ignores the correlation triangle values of customer requirements and engineering characteristics. Limited resources, increased market competition and product complexity however demands more optimal solutions. A new approach is proposed to address the lacunas due to uncertainty and lack of quantitative methods and tools. The paper attempts to provide a ready reckoner and reference to all the followers and enthusiasts of QFD. The development and mechanics of QFD model are however not discussed, and can be referred to from a number of academic and non-academic sources. This is followed by quantification of findings as a basis for comprehensive matrix analysis and concludes with a SWOT analysis. The following set of input list along with the notations is used in the process; the details are given with the help of a hypothetical case example of a medical-care product – Disposable Syringe and Needle. Collected Customer Data:
a. Customers Requirements [CR] - CR1, CR2,
CR3…CRi,…CRm.
CRi - ith Customer Requirement; i = 1 to m; m - Number of
Customer Requirements
CRi = {Cleanliness & Purity; Safe, Reliable & Efficient; Ease
of Handling & Use; Cost of the Product; No Leakages (Air/Fluid); Right Size/Correct Volume; Proper Markings; Precise Movements; Safe & Convenient Packaging; and Tamper Proof (No reuse)}
b. Interrelationship among Customers Requirements [X] - X12, X13, X14,…Xiu,… X(m)(m-1).
Xiu - Interrelationship of ith Customer Requirement with uth
Customer Requirement
i = 1 to m-1 and u = 2 to m, for i ≠ u; i and u - Customer Requirements
For CR1: Y1v = {+, 0, -, 0, 0, 0, 0, +, ++} u = 2 to 10
c. Customers Importance Ratings [I] - I11, I12, I13,…Ici,…Izm.
Ici - Customers Importance Ratings of cth Customer for ith
Customer Requirement
Ii = ( ∑Ici) / z; Ii - Mean Value of Customer Importance
Ratings for ith Customer Requirement
z - Number of Customers considered Ii = {4, 5, 3, 5, 3, 2, 1, 2, 3, 5}
d. Customers Satisfaction Ratings [S] - S111, S112,
S113,…Scik,….Szmf.
Scik - Satisfaction Ratings of cth Customer for ith Customer
Req’t using kth Firm product.
k = 1 to f; f - Number of Competitors (in this case f = 3)
A New Paradigm in Comprehensive Quality
Function Deployment Analysis
Sik = (∑Scik) / z; Sik - Mean of Satisfaction Rating of ith
Customer Req’t for kth Firm’s product.
So = {3, 5, 2, 3, 2, 2, 1, 2, 2, 3} Similarly, for Sa and Sb.
e. Sales Point Ratings [P] - P11, P12, P13,…Piq,…Pmd.
Piq - Sales Point Ratings of ith Customer Requirement by qth
Seller/Dealer
q = 1 to d; d - Number of Sellers / Dealers
Pi = ( ∑ Piq ) / d; Pi - Mean Value of Sales Point Ratings for ith
Customer Requirement Pi = {2, 3, 1, 3, 2, 2, 1, 2, 2, 3}
Collected Technical Data:
a. Engineering Characteristics [EC] - EC1, EC2,
EC3,…ECj,…ECn.
ECj - jth Engineering Characteristics; j = 1 to n; n - Number of
Engineering Characteristics
ECj = {Cleanliness; Sterility; Toxicity; Leakages; Graduation
Scale; Volume Labeling; Self Destructive Packaging; Optimum Lubrication; Syringe Components; and Needle Components}
b. Interrelationship among Eng. Characteristic (Roof) [Y] - Y12, Y23, Y13,…Yjv,… Y(n)(n-1).
Yjv - Interrelationship of jth Engineering Characteristic with
vth Engineering Characteristic
j = 1 to n-1 and v = 2 to n, for j ≠ v; j and v = 1 to n, for j ≠ v; j and v - Engg. Characteristics
For EC1: Y1v = {++, ++, --, 0, 0, +, 0, 0, 0} v = 2 to 10
c. Correlation between Customer Requirements & Engineering Characteristics [C]
Cij - Correlation Value between ith Customer Requirement &
jth Engineering Characteristic
For CR1 & EC1: C11 = {5, 4, 0, 2, 0, 0, 0, 0, 2, 2}
A. Quantifying Customers Expectations
The quantification of customer expectations measures the customer perception of the product relative to the competition. Data collected from customers is used as a basis for comparison. Requirements are not always prioritized strictly based upon the importance which the customers attach to each requirement. Often, through QFD, one wants to adjust the priorities of the requirements to account for the amount of work required to improve the customers' perceptions. A number of factors can be incorporated to indicate where the organization thinks the competition is headed. In order to prioritize the customer requirements, the combined effect of customer importance ratings, the customer satisfaction ratings and the sales points generated through the sellers and the dealers should be considered. The following steps will illustrate these prioritization methods. All of these different methods of prioritization involve defining calculations with respect to collected and derived customer data associated with input list of customer requirements.
a. Expectation Gap: Expectation Gap tells us the difference between the level of performance expected from the product by the customers through Customer Importance Ratings and the actual level of performance denoted by the Satisfaction Rating of the selected product. This parameter helps us in knowing the list of customer requirements with which the customer is less satisfied than they ought to be.
Expectation Gap [EG] - EG1, EG2, EG3,….EGi,…EGm.
EGi - Expectation Gap of ith customer requirement; i = 1 to m
EGi = Ii - Sik
For CR1: EG1 = I1 - S1o = 4 – 3 = 1
Similarly, others are: EGi = {1, 0, 1, 2, 1, 0, 0, 0, 1, 2}
b. Performance Gap: Performance Gap is the numerical difference between the maximum rating in customer satisfaction column and the customer satisfaction rating of the model under consideration. Negative value of this parameter is taken as zero.
Performance Gap=Max.(Satisfaction Rating of All Models) - Satisfaction of Selected Model
Performance Gap [PG] - PG1, PG2, PG3,….PGik,…PGmf
PGik - Performance Gap of ith customer requirement for kth
Firm
PGik = Max (Si1, Si2, Si3,…Sif) - Sik = MSi- Sik
For CR1: PG1o = MS1 - S1o = 4 – 3 = 1
Similarly, others are: PGi = {1, 0, 1, 2, 1, 0, 0, 0, 1, 2}
c. Goal: This indicates as to what level the organization is trying to achieve with regard to each and every need of the customers. The levels are again expressed on a Likert Scale of 1 to 5 were the level strived depends on the factors like Importance Rating or the Satisfaction Rating. In fact the Goal value is greater of the two. Goal denotes our future products.
Goal = Max. [Importance Rating, Max. (Customer Satisfaction Rating of O, A, B, C, & D)]
Goals [G] - G1, G2, G3,….Gi,…Gm.
Gi - Goal of ith customer requirement
MSi – Max. Satisfaction Rating of ith customer requirement
Gi = Max. [Ii, Max (Si1, Si2, Si3,…Sif)] = Max. [Ii, MSi]
For CR1: G1 = Max. [I1, Max (S1o, S1a, S1b)] = Max. [4, Max
(3, 4, 4)] = 4.
Similarly, others are: Gi = {4, 5, 3, 5, 3, 3, 3, 3, 4, 5}
d. Improvement Factor: Improvement Factor is the change from present to future product and is an indication of the amount of work required to change the level of perceived performance. Improvement Factor thus can be said to as the effort level needed to achieve our targeted goals. Higher the improvement factor, greater the needed effort because of the gap between actual and the expected quality level. It is the ratio of the goal value to the customer satisfaction rating for the model under consideration.
Improvement Ratio = Goal / Customers Satisfaction Rating: Rik = Gi / Sik
For CR1: R1o = G1 / S1o = 4 / 3 = 1.33
Similarly, others are: Ri = {1.33, 1.00, 1.50, 1.67, 1.50, 1.50,
3.00, 1.50, 2.00, 1.67}
e. Preliminary Raw Weights: Preliminary Raw Weight value signifies the overall importance of the customer requirements as regard the development of the product. Preliminary Raw Weight sums up the priority level for the design and the development personnel. The more the preliminary raw weight the higher the priority. This value indicates where the design team should focus attention in order to address what is important to the customers and where they have to do a lot of work.
Preliminary Raw Weight = Importance Rating * Sales Points * Improvement Ratio
Preliminary Raw Weight [PRW] = PRW1, PRW2,
PRW3,…….PRWi,………PRWm.
PRWik - Preliminary Raw Weight of ith Customer
Requirement for kth Firm
For CR1: PRW1o = I1 * P1 * R1o = I1 * P1 * R1o = 4 * 2 * 1.33 =
10.67
Similarly, others are: PRWi = {10.67, 15.00, 4.50, 25.00,
9.00, 6.00, 3.00, 6.00, 12.00. 25.00}
f. Factoring in the Interrelationship Values of Customer Requirements Triangle: In QFD studies various customer requirements are always stated and included, but interrelationship with one another is hardly ever incorporated and even if depicted then is never ever brought into the tabulations of the final importance ratings of the customer requirements. Interrelationships among the customer requirements require the QFD personnel to make a lot of pair-wise comparisons about the degree of association and also the direction to which these customer requirements are interrelated [4-5]. Also there are few, if any, acceptable methods to incorporate the interrelationship into the calculation of the final importance ratings of the customer requirements [6-8]. However, most of these methods adopt calculation procedures using weighted product of the relationship measures in the importance rating column, sales point column and improvement factor column, without considering the magnitude, direction and degree of association amongst all customer requirements [9-10]. In order to overcome the above problem, a new method for prioritizing customer requirements in QFD was proposed by the authors, which integrates the customer requirement correlation triangle values with preliminary raw weights [11]. The proposed method weighs the customer requirements more efficiently, as not only the relative importance ratings, sales points and improvement ratios of customer requirements are considered but the values and their degree of association in the correlation triangle are also factored-in. Through the method proposed in this study, the CR correlation triangle symbols are translated into numerical values, with this a discrete but exact solution is obtained and then the prioritization weights are computed by utilizing the preliminary value of raw weights.
Final Raw Weight [FRW] = FRW1, FRW2,
FRW3,……FRWi,…… FRWm
NICR = [m (m - 1)] / 2
NPRWi = PRWi / SPRW, i = 1 to m
IRWi = NPRWi + ∑{NPRWi * (1 + NPRWu) * Xiu} for i ≠ u
NIRWi = IRWi / SIRW
FRWi = NIRWi * SPRW
NICR- Number of Interrelationship among Customer Requirements
Xiu - Interrelationship Value between ith Customer
Requirement & uth Customer Req’t
SPRW - Sum of all Preliminary Raw Weight of Customer Requirements
NPRW - Normalized Preliminary Raw Weight of Customer Requirements
IRW - Intermediate Raw Weight of Customer Requirements SIRW - Sum of all Intermediate Raw Weight of Customer Requirements
NIRW - Normalized Intermediate Raw Weight of Customer Requirements
For CR1: NICR = [m (m - 1)] / 2 = 10(10-1)/2 = 45
SPRW = ∑ PRWi = 116.17
X1u = {0, 1.25, 0, 0.50, 0, 0, 0, 0, 1.25, 1.50}
NPRW1 = PRW1 / SPRW = 10.67 / 116.17 = 0.09
IRW1 = NPRW1 + ∑{NPRW1* (1 + NPRWu) * X1u} for i ≠ u
= 0.09 + {[0.09*(1+ 0.13)*1.25] + 0 + [0.09*(1+0.22)*0.50] + 0 + 0 + 0 + 0 + 0 + [0.09*(1+ 0.10)*1.25] + [0.09* (1+ 0.22)*1.50]} = 0.57
NIRW1= IRW1 / SIRW = 0.57 / 6.11 = 0.09
FRW1= NIRW1 * SPRW = 0.09 * 116.17 = 10.86
Similarly, others are: FRWi = {10.86, 24.77, 2.65, 18.51,
8.32, 5.80, 2.89, 3.88, 12.74, 25.74}
g. Final Raw Weights & Percent Importance: The critical few identified customer requirements are very high on the priority list of the users. These customer requirement areas and the engineering characteristics which govern and facilitate these requirements needs extra management attention, thus enabling successful development of a product package. Percent Importance simply contains the value of final raw weights translated into percentage term.
Percent Importance = %AGE = FRW / SPRW
For CR1: Percent Importance1 = %AGE1 = FRW1 / SPRW *
100 = 10.86 / 116.17 = 9.35 %
Similarly, others are: %AGEi = {9.35, 21.32, 2.28, 15.94,
7.16, 4.99, 2.49, 3.34, 10.97, 22.16} B. Quantifying Engineering Expectations
One of the prime reasons for using QFD is to develop a product which will excite the customer and get him/her to purchase the brand model. When the customer's perceptions are captured as to how well different products perform in the marketplace, it leads to better understanding of what is driving the purchase decision. This helps in determining what the market likes and dislikes. However, it’s still dealing with customer perceptions and not actual performance. It’s not necessarily learned as to what one should do to create the desired level of perceived performance. The quantification of engineering characteristics is similar to the external assessment but involves technical details of the product rather than customer requirements. In this step, competition products were compared in the light of customer requirements. Engineers and technical personnel provide the data for the technical benchmarking. Studying the competition gives valuable insight into market opportunities and aids in setting reasonable targets.
a. Relationship Score Matrix: Cell score is the integration of the correlation values between requirements and characteristics with final raw weights of customer requirements.
Cell Score [CS]: CSij - Cell Score of ith Customer
Requirement & jth Engineering Characteristic
CSij = Cij * FRWi
Cij - Correlation Value between ith Customer Requirement &
jth Engineering Characteristic
For CR1 & EC1: Cleanliness and Purity & Cleanliness
CS11 = C11 * FRW1 = 5 * 10.86 = 54.30
b. Preliminary Priority Score: In this step, we prioritize the values for the designed features and is done by using the following formula:
Preliminary Priority Score [PPS] - PPS1, PPS2,
PPS3,…….PPSj,………PPSn.
PPSj - Preliminary Priority Score of jth Engineering
Characteristic
For EC1: PPS1 = CS11 + CS21+ CS31 + CS41 + CS51 + CS61 +
CS71 + CS81+ CS91+ CS101
= (5 * 10.86) + (4 * 24.77) + 0 + (2 * 18.55) + 0 + 0 + 0 + 0 + (2 * 12.74) + (2 * 25.74)
= 267.38
Similarly, others are: PPSi = {267.38, 281.29, 270.43,
267.17, 40.93, 111.52, 392.86, 124.80, 247.90, 205.33} c. Factoring in the Interrelationship Values of Engineering Characteristics Correlation Triangle: The study of the available literature on various models and framework for QFD - suggests that most of the methodologies suffer from one of the major weaknesses - the relative lack of concrete and clear guidelines as to how one could adequately conceptualize, integrate and implement its roof phase. Several methodologies have been worked out, but their validity and applicability to prioritize engineering characteristics remains inconclusive and also the implementation results and findings are scarce [12-14]. Most of these methods adopt calculation procedures using weighted sum of the relationship measures in the relationship matrix with relative weights of customer requirements in aggregation of the importance of engineering characteristics, without considering the magnitude and direction of relationship amongst all engineering characteristics [15-17]. More often than not QFD users simply use direct methods to obtain these final priority scores, ignoring the correlations among the customer requirements and among the engineering characteristics even if they are available [18-19]. In order to weigh in the interrelationships, the roof symbols are translated into mathematical values for each combination of engineering characteristic, a discrete but exact solution is obtained and then the prioritization values are computed by utilizing the preliminary priority scores [20]. For a target engineering characteristic, the approach determines its importance rating as linear combination of its correlations with other engineering characteristics weighted by the engineering characteristics’ preliminary priority scores. Final Priority Score [FPS] - FPS1, FPS2, FPS3,…FPSj,…
FPSn
NIEC = [ n ( n - 1 ) ] / 2
NPPSi = PPSi / SPPS for j = 1 to n
IPSj = NPPSj + ∑ { NPPSj * (1 + NPPSv) * Yjv } for j ≠ v
NIPSj = IPSj / SIPS
FPSj = NIPSj * SPPS
NIEC- Number of Interrelationship among Engineering Characteristics
Yjv - Interrelationship Value between jth Engineering
Characteristic & vth Engg Characteristic
PPS - Preliminary Priority Score of Engineering Characteristics
SPPS - Sum of all Preliminary Priority Score of Engineering Characteristics
NPPS - Normalized Preliminary Priority Score of Engineering Characteristics
IPS - Intermediate Priority Score of Engineering Characteristics
SIPS - Sum of all Intermediate Priority Score of Engineering Characteristics
NIPS - Normalized Intermediate Priority Score of Engineering Characteristics
For EC1: NIEC = [ n ( n - 1 ) ] / 2 = 10 (10 - 1) / 2 = 45
SPPS = ∑ FPSj = 2209.62
Y1v= {0, 1.50, 1.50, 0.25, 0, 0, 1.25, 0, 0, 0}
NPPS1 = PPS1 / SPPS = 267.38 / 2209.62 = 0.12
IPS1 = NPPS1 + ∑ { NPPS1 * (1 + NPPSv) * Y1v }
= 0.12 + {[0.12 * (1+ 0.13) * 1.50] + [0.12 * (1+ 0.12) * 1.50] + [0.12* (1+ 0.12) * 0.25] + 0 + 0 + [0.12 * (1+ 0.18) * 1.25] + 0 + 0 + 0} = 0.709
NIPS1 = IPS1 / SIPS = 0.74 / 5.36 = 0.14
FPS1 = NIPS1 * SPPS = 0.14 * 2209.62 = 305.60
Other FPSj = {305.60, 348.61, 335.52, 308.79, 30.27, 81.48,
381.94, 82.06, 243.52, 91.94}
d. Final Priority Scores & Percent Importance: The final priority score when sorted on their numeric values highlights the area on which the manufacturer should focus their attention. For carrying out these improvements the company needs to focus on the engineering characteristics with greater values of final priority scores. This will not only lead to better level of performance, per se but also give them an edge over their competitors as far as the customer satisfaction is concerned. A little improvement in the performance of the organization in these respect, would overcome a number of weaknesses which will not only help the organization in competing better but also stand them in good stead as far as the expectations of customers are concerned. Thus, improving the product with respect to these engineering characteristics will be solving most of their problems. Because these considered engineering characteristics has a direct bearing on the disadvantages the manufacturer has vis-à-vis its competitors.
Percent Importance = %AGE = FPS / SPPS
For EC1: %AGE1 = FPS1 / SFPS * 100 = 305.60 / 2209.62 *
100 = 13.83 %
Other %AGEJ = {13.83, 15.78, 15.18, 13.97, 1.37, 3.69,
17.29, 3.71, 11.02, 4.16}
All these elicited data; collected data; derived data - in qualitative and quantitative form - and the associated mathematical analysis of this data gives the results in the form of Final Quality Deployment Function Matrix also known as House of Quality. (Not shown in the Paper.)
C. SWOT Analysis
The information used to prioritize the customer requirements is some of the most interesting and important information collected during the QFD process. The results of the QFD project start to become apparent once the team begins to utilize SWOT Analysis [21] and sorts the data to look at it from many different perspectives. When implementing a SWOT analysis to devise a set of strategies, the following guidelines should be utilized.
be difficult for an organization to acknowledge its weaknesses, it is best to handle the bitter reality without procrastination. The weaknesses of the organization can be deciphered by sorting the following value columns in ascending order: Customer Importance Rating, Customer Satisfaction Rating and Improvement Factor, while sorting the following columns in descending order of their Final Raw Weight and Expectation Gap.
c. Opportunities: Another major factor is to determine how your organization can continue to grow within the marketplace. After all, opportunities are everywhere, such as changes in technology, government policy, social patterns, and so on. The opportunities of the organization can be garnered by sorting the following value columns in ascending order: Goal and Sales Points, while sorting the following columns in descending order of Final Priority Scores.
d. Threats: No one likes to think about threats, but we still have to face them, despite the fact that they are external factors that are out of our control. It is vital to be prepared and face threats even during turbulent situations. The threats faced by the organization can be understood by sorting the values column of Final Priority Score in descending order, while sorting the value columns of Customer Satisfaction Rating and Performance Gap in ascending order.
The benefits of SWOT lie in matching of specific internal and external factors, which creates a strategic matrix, which makes sense. The internal factors are within the control of the organization, such as operations, finance, marketing, and in other areas. The external factors are out of your organization's control, such as political and economic factors, technology, competition, and in other areas.
Having understood the QFD & SWOT philosophies, it is essential to identify how and in what ways these philosophies could be applied in business strategies. People in the organization have to face all kinds of competition. Competitors may come within the organizational constituents as well as individual constituents. Winning or losing in battle is very much based on how effectively they manipulate the perceptions and opinions of constituents. Those who have the most accurate and up-to-date information will win. Information will help in the analysis process and decision making. The wisdom for the traditional competition can equally be applied in information competition.
III. RESULTSAND ANALYSIS
In order to carry out a full fledged comparative analysis of the outcome given by the QFD model, first step is to segregate the necessary and crucial information pertaining to the ‘critical-success-parameters’ from the customer as well as technical point of view. Critical-success-parameters here refer to the customer requirements and engineering characteristics which are very vital and crucial for the success of the product. The Final QFD Matrix provides us with the final raw weights of each customer requirement and also final priority scores of each engineering characteristic. Carrying out a comparative analysis on the results provided by the Final QFD with SWOT on the final raw weights (customer
data) and final priority scores (technical data); the following inferences can be drawn. Table 1 and Table 2 show the weights and scores in sorted rank order form.
[image:5.595.308.544.307.446.2]Since it is beyond the scope of the paper to carry out the above discussed SWOT analysis on the obtained QFD results, only the final results of the analysis are given in Table 3. The strengths and weaknesses pertains to the technical data influenced by internal assessment and market competitors; while the opportunity and threats pertains to the customer data influenced by the external assessment and performance factors in the market. As per the Final Matrix of QFD which tries to factor-in the correlation triangle values amongst customer requirements; the sorted values of customer requirement on final raw weights list out the critical-success-parameters presenting opportunity are as - ‘tamper proof (no reuse)’, ‘safe, reliable and efficient’ and ‘cost of the product’. Refer Table 1. However the apparent threats are from ‘ease of handling and use’, ‘proper markings’ and ‘precise movements’.
Table 1: Sorted Rank Order Final List of Customer Req’ts
RANK CUSTOMER REQUIREMENTS S.NO. FRW %AGE CUM %
1 TAMPER PROOF (NO REUSE) 10 25.74 22.16 22.16
2 SAFE, RELIABLE & EFFICIENT 2 24.77 21.32 43.48
3 COST OF THE PRODUCT 4 18.51 15.94 59.42
4 SAFE & CONVENIENT PACKAGING 9 12.74 10.97 70.39
5 CLEANLINESS & PURITY 1 10.86 9.35 79.74
6 NO LEAKAGES (AIR/FLUID) 5 8.32 7.16 86.90
7 RIGHT SIZE/CORRECT VOLUME 6 5.80 4.99 91.89
8 PRECISE MOVEMENTS 8 3.88 3.34 95.23
9 PROPER MARKINGS 7 2.89 2.49 97.72
10 EASE OF HANDLING & USE 3 2.65 2.28 100.00
- COLUMN TOTAL - 116.17 100.00 -
On the similar lines, the critical success-parameters with regard to the technical design aspect of the syringe and needle can be interpreted from the absolute priority scores below the central relationship matrix in each of the column. When investigated column wise as per the value of Final Priority Scores, the significance and contribution of each engineering characteristic in satisfying overall customer needs can be seen. As can be seen in Table 2, which depicts the magnitude of Final Priority Scores - calculated with the relationship cell values and final raw weights. The final output of the case has shown that, the engineering characteristics like ‘self destructive packaging’, ‘sterility factor’ and ‘toxicity factor’ are the highest contributors in the overall success of the product and also represent strengths of the organization. On the other hand, the technical weaknesses of the organization get exposed in the form of ‘graduation scale’, ‘volume labeling’, and ‘optimum lubrication’. Refer Table 2.
Table 2:Sorted Rank Order Final List of Engg. Characteristics
RANK ENGINEERING
CHARACTERISTICS
S.
NO. FPS %AGE CUM%
1 SELF DESTRUCTIVE PACKAGING 7 381.94 17.29 17.29
2 STERILITY FACTOR 2 348.61 15.78 33.06
3 TOXICITY FACTOR 3 335.52 15.18 48.25
4 LEAKAGE FACTOR 4 308.79 13.97 62.22
5 CLEANLINESS FACTOR 1 305.50 13.83 76.05
6 SYRINGE COMPONENTS 9 243.52 11.02 87.07
7 NEEDLE COMPONENTS 10 91.94 4.16 91.23
8 OPTIMUM LUBRICATION 8 82.06 3.71 94.94
9 VOLUME LABELING 6 81.48 3.69 98.63
10 GRADUATION SCALE 5 30.27 1.37 100.00
- COLUMN TOTAL - 2209.62 100.00 -
The top half of the ranked order customer requirements pertains to safety (no reuse and safe packaging), reliability (reliable and efficient), and cleanliness aspect of the syringe and needle representing opportunity, and interestingly the top half of ranked order engineering characteristics are also direct representative of these customer requirements and justifiably pertains to the same demanded quality functions catered viz. safety (self destructing), reliability (sterility and leakage factor) and cleanliness (cleanliness and toxicity factor) aspect of the product representing strength. On the other hand, the bottom half of customer requirements pertain to performance (ease of handling and precise movements) and conformance (proper markings) aspects representing threats, and correspondingly the bottom half of the engineering characteristics directly relates with these requirements viz. performance (optimum lubrication) and conformance (correct scale and volume labeling) aspects representing the weaknesses. The engineering characteristic with higher importance weights in the form of final priority scores are governing the customer requirements with greater importance weights represented through the final raw weights. Thus the outcome manifests itself into a true representative of the all the important factors affecting and leading to the revision of importance weights of the customer needs. These SWOT influenced values of importance, their rankings and order are much more precise and accurate - leading to better and informative decision making.
IV. CONCLUSIONS
QFD is a subjective, primarily a qualitative structured and systematic approach to document customer needs. It is a complex and time-consuming process; implementing QFD does not run smoothly and moreover, incorrect application of QFD results in increased work without accompanying benefits. The paper attempts to provide a ready reckoner and reference to all the followers and enthusiasts of QFD. The proposed methodology employs a new quantitative procedure to incorporate and factor-in the usually mentioned and computationally ignored correlation triangle values. All the underlying theories and concepts; information needed with data gathering techniques; computations involved; customer table; technical table; post-matrix analysis are clearly indicated to present a working framework for the users and practitioners to carry out QFD analysis. The model also suggests the use of more rationale post-matrix analysis to perform internal and external assessment and carried out
SWOT analysis for better interpretation of available information for effective decision making. The authors welcome any constructive suggestions and criticism with regard to the reader’s on-field expertise and experiences to enrich this model thus making the QFD analysis even more complete and comprehensive.
Table 3: Strength - Weakness - Opportunity - Threats Matrix
STRENGTHS OPPORTUNITIES
ST
RENGT
H
S SELF DESTRUCTIVE TAMPER PROOF (NO REUSE) OPPORT
UNIT
IS
STERILITY FACTOR SAFE, RELIABLE & EFFICIENT
TOXICITY FACTOR COST OF THE PRODUCT
WEAKNESSES
OPTIMUM LUBRICATION PRECISE MOVEMENTS
THREAT
S
VOLUME LABELLING PROPER MARKINGS
GRADUATION SCALE EASE OF HANDLING & USE
WEAKNESSES THREATS
REFERENCES
1. Akao Yoji, 1990, Quality Function Deployment: Integrating Customer Requirements into Product Design. Cambridge, Massachusetts, USA.
2. Cohen L., 1995, Quality Function Deployment: How to make QFD work for you, MA: Addison-Wesley Publishing Company.
3. Hauser, J. & Clausing, D., 1988, The House of Quality. Harvard Business Review, pp
63-73.
4. Armacost R.L., Componation P.J., Mullens M.A., and Swart W.W., 1994, An AHP framework for prioritizing customer requirement in QFD: an industrialized housing application. IIE Transactions,26 (4), 72-79.
5. Fung R.Y.K., Popplewell K. and Xie J., 1998, An intelligent hybrid system for customer requirements analysis and product attribute targets determination Int. Journal of Production Research, 36 (1), pp 13-34.
6. Karsak, E., Sozer, S. and Alptekin, E., 2002, Product planning in quality function deployment using a combined analytic network process and goal programming approach.
Computers and Industrial Engineering, 44, pp 171-190.
7. Shen X. X., Tan K. C., and Xie M., 2001, The implementation of quality function deployment based on linguistic data, Journal of Intelligent Manufacturing, 12, pp 65-75. 8. Liu B. and Liu K.L., 2002, Expected value of fuzzy variable and fuzzy expected value
models. IEEE Transactions on Fuzzy Systems, 10(4), pp 445-450.
9. Vangeas L. V. and Labib A. W., 2001, A fuzzy quality function deployment (FQFD) model for deriving optimum targets. Int. Journal of Prod. Research, 39 (1), pp 99-120.
10. Lyman D., 1990, Deployment normalization, Transactions from the Second
Symposium on QFD, pp 307-315.
11. Sharma J. R., Pimplapure S. R. & Rawani A. M., 2007, Prioritizing Customers Requirements in QFD by Integrating their Interrelationship with the Raw Weights.
Institute of Engineers, India, 88 (9), pp 7 – 11.
12. Chan L. K. and Wu M. L., 1998, Prioritizing the Technical Measures in Quality Function Deployment, Quality Engineering, 10 (3): pp 467-79.
13. Chang Hee Han, Jae Kyeong Kim and Sang Hyun Choi, 2004, Prioritizing engineering characteristics in QFD with incomplete information: A linear partial ordering approach.
Int. J. Production Economics, 91, pp 235-249.
14. Franceschini, F. and Rossetto S., 1995, QFD: The problem of comparing technical/engineering design requirements, Research in Engineering Design, pp 270-278. 15. Karsak E., 2004, Fuzzy multiple objective programming framework to prioritize design
requirements in QFD, Computers & Industrial Engg., Vol. 47, pp 149-163.
16. Wang J., 1999, Fuzzy outranking approach to prioritize design requirements in quality function deployment. International Journal of Production Research, 37 (4), pp 899-916.
17. Yizeng Chen, Richard Y.K. and Jiafu Tang, 2005, Rating technical attributes in fuzzy QFD by integrating fuzzy weighted average method and fuzzy expected value operator,
European Journal of Operational Research
18. Khoo L. P. and Ho N. C., 1996, Framework of a Fuzzy Quality Function Deployment System, International Journal of Production Research; 34 (2), pp 299-311.
19. Kao C., and Liu S. T., 2001, Fractional programming approach to fuzzy weighted average. Fuzzy Sets and Systems, pp 435-444.
20. Sharma J. R. & Rawani A. M., 2008, Prioritizing Engineering Characteristics in QFD by Integrating the Values in the Correlation Matrix. Int. Journal of Productivity and Quality Management, 3 (2), pp 223 – 240.