Proceedings of the 2011 Conference on Empirical Methods in Natural Language Processing, pages 1342–1351,
Summarize What You Are Interested In:
An Optimization Framework for Interactive Personalized Summarization
Rui Yan
Department of Computer Science and Technology,
Peking University, Beijing 100871, China
Jian-Yun Nie
D´epartement d´informatique et de recherche op´erationnelle,
Universit´e de Montr´eal, Montr´eal, H3C 3J7 Qu´ebec, Canada
Xiaoming Li Department of Computer Science and Technology,
Peking University, Beijing 100871, China
Abstract
Most traditional summarization methods treat their outputs as static and plain texts, which fail to capture user interests during summa-rization because the generated summaries are the same for different users. However, users have individual preferences on a particular source document collection and obviously a universal summary for all users might not al-ways be satisfactory. Hence we investigate an important and challenging problem in sum-mary generation, i.e., Interactive Personalized Summarization (IPS), which generates sum-maries in an interactive and personalized man-ner. Given the source documents, IPS captures user interests by enabling interactive clicks and incorporates personalization by model-ing captured reader preference. We develop experimental systems to compare 5 rival al-gorithms on 4 instinctively different datasets which amount to 5197 documents. Evalua-tion results in ROUGE metrics indicate the comparable performance between IPS and the best competing system but IPS produces sum-maries with much more user satisfaction ac-cording to evaluator ratings. Besides, low ROUGE consistency among these user pre-ferred summaries indicates the existence of personalization.
1 Introduction
In the era of information explosion, people need new information to update their knowledge whilst infor-mation on Web is updating extremely fast. Multi-document summarization has been proposed to ad-dress such dilemma by producing a summary
de-livering the majority of information content from a document set, and hence is a necessity.
Traditional summarization methods play an im-portant role with the exponential document growth on the Web. However, for the readers, the impact of human interests has seldom been considered. Tra-ditional summarization utilizes the same methodol-ogy to generate the same summary no matter who is reading. However, users may have bias on what they prefer to read due to their potential interests: they needpersonalization. Therefore, traditional summa-rization methods are to some extent insufficient.
Topic biased summarization tries for personaliza-tion by pre-defining human interests as several gen-eral categories, such ashealth orscience. Readers are required to select their possible interests before summary generation so that the chosen topic has priority during summarization. Unfortunately, such topic biased summarization is not sufficient for two reasons: (1) interests cannot usually be accurately pre-defined by ambiguous topic categories and (2) user interests cannot always be foreknown. Often users do not really know what general ideas or detail information they are interested in until they read the summaries. Therefore, more flexible interactions are required to establish personalization.
build an experimental system on 4 real datasets to verify the effectiveness of our methods compared with 4 rivals. The contribution of IPS is manifold by addressing following challenges:
• The 1st challenge for IPS is to integrate user interests into traditional summary components. We measure the utilities of these components and com-bine them. We formulate the task into a balanced optimization framework via iterative substitution to generate summaries with maximum overall utilities. • The 2nd challenge is to capture user inter-ests through interaction. We develop an interactive mechanism of “click” and “examine” between read-ers and summaries and address sparse data by “click smoothing” under the scenario of few user clicks.
We start by reviewing previous works. In Section 3 we provide IPS overview, describe user interac-tion and optimize component combinainterac-tion with per-sonalization. We conduct empirical evaluation and demonstrate the experimental system in Section 4. Finally we draw conclusions in Section 5.
2 Related Work
Multi-Document Summarization (MDS) has drawn much attention in recent years and gained emphasis in conferences such as ACL, EMNLP and SIGIR, etc. General MDS can either be extractive or ab-stractive. The former assigns salient scores to se-mantic units (e.g. sentences, paragraphs) of the doc-uments indicating their importance and then extracts top ranked ones, while the latter demands informa-tion fusion(e.g. sentence compression and reformu-lation). Here we focus on extractive summarization. Centroid-based method is one of the most popular extractive summarization method. MEAD (Radev et al., 2004) and NeATS (Lin and Hovy, 2002) are such implementations, using position and term fre-quency, etc. MMR (Goldstein et al., 1999) algorithm is used to remove redundancy. Most recently, the graph-based ranking methods have been proposed to rank sentences or passages based on the “votes” or “recommendations” between each other. The graph-based methods first construct a graph representing the sentence relationships at different granularities and then evaluate the saliency score of the sentences based on the graph. TextRank (Mihalcea and Tarau, 2005) and LexPageRank (Erkan and Radev, 2004)
use algorithms similar to PageRank and HITS to compute sentence importance. Wan et al. improve the graph-ranking algorithm by differentiating intra-document and inter-intra-document links between sen-tences (2007b) and incorporate cluster information in the graph model to evaluate sentences (2008).
To date, topics (or themes, clusters) in documents have been discovered and used for sentence selec-tion for topic biased summarizaselec-tion (Wan and Yang, 2008; Gong and Liu, 2001). Wan et al. have proposed a manifold-ranking method to make uni-form use of sentence and sentence-to-topic relationships to generate sentence-to-topic biased sum-maries (2007a). Leuski et al. in (2003) pre-define several topic concepts, assuming users will foresee their interested topics and then generate the topic biased summary. However, such assumption is not quite reasonable because user interests may not be forecasted, or pre-defined accurately as we have ex-plained in last section.
The above algorithms are usually traditional ex-tensions of generic summarizers. They do not volve interactive mechanisms to capture reader in-terests, nor do they utilize user preference for per-sonalization in summarization. Wan et al. in (2008) have proposed a summarization biased to neighbor-ing readneighbor-ing context through anchor texts. How-ever, such scenario does not apply to contexts with-out human-edited anchor texts like Wikipedia they have used. Our approach can naturally and simulta-neously take into account traditional summary ele-ments and user interests and combine both in opti-mization under a wider practical scenario.
3 Interactive Personalized Summarization
Personalization based on user preference can be captured via various alternative ways, such as eye-trackingormouse-trackinginstruments used in (Guo and Agichtein, 2010). In this study, we utilize inter-active user clicks/examinations for personalization.
clicked sentenceqand the examined contextsc. As q has close semantic coherence with
neigh-boring contexts due to consistency in human natural language, we consider a window of sentences cen-tered at the clicked sentenceqasc, which is a bag of
sentences. The window sizekis a parameter to set.
However, click data is often sparse: users are not likely to click more than 1/10 of total summary sen-tences within a single generation. We amplify these tiny hints of user interest byclick smoothing.
We change the flat summary structure into a hi-erarchical organization by extracting important se-mantic units (denoted as u) and establishing link-age between them. If the clicked sentence q
con-tainsu, we diffuse the click impact to the correlated
units, which makes a single click perform as multi-ple clicks and the sparse data is smoothed.
Problem Formulation
Input: Given the sentence collection D
decom-posed by documents, D = {s1, s2, . . . , s|D|} and the clicked sentence recordQ = {q1, q2, . . .}, we
generate summaries in sentences. A user click is associated with a tuple<q,(u), c> where the
exis-tence of u depends on whether q contains u. The
collection of semantic units is denoted as M =
{u1, u2, . . . , u|M|}.
Output: A summary S as a set of sentences
{s1, s2, . . . , s|S|}andS ⊂ Daccording to the pre-specified compression rateφ(0< φ <1).
After the overview and formulation of IPS prob-lem, we move on to the major components ofUser InteractionandPersonalized Summarization.
3.1 User Interaction
Hypertexify Summaries. We hypertexify the sum-mary structure by establishing linkage between se-mantic units. There are several possible formats for semantic units, such as words or n-grams, etc. As single words are proved to be not illustrative of se-mantic meanings (Zhao et al., 2011) and n-grams are rigid in length, we choose to extract semantic units at a phrase granularity. Among all phrases from source texts, some are of higher importance to at-tract user interests, such as hot concepts or popu-lar event names. We utilize the toolkit provided by (Zhao et al., 2011) based on graph proximity LDA (Blei et al., 2003) to extract key phrases and their corresponding topic. A topic T is represented by
{(u1, π(u1, T)),(u2, π(u2, T)), . . .}whereπ(u, T)
is the probability ofubelonging to topicT. We in-vert the topic-unit representation in Table 1, where eachu is represented as a topic vector. The
corre-lationcorr(.)betweenui,ujis measured by cosine
similaritysim(.)on topic distribution vector~ui,~uj.
corr(ui, uj) =simtopic(~ui, ~uj) (1)
Table 1: Inverted representation of topic-unit vector. ~u1 π(u1,T1) π(u1,T2) . . . π(u1,Tn)
~u2 π(u2,T1) π(u2,T2) . . . π(u2,Tn)
... ... ... ... ...
~u|M| π(u|M|,T1) π(u|M|,T2) . . . π(u|M|,Tn)
When the summary ishypertexifiedby established linkage, users click into the generated summary to examine what they are interested in. A single click on one sentence become multiple clicks via click smoothing when the indicative functionI(u|q) = 1.
I(u|q) =
(
1 qcontainsu;
0 otherwise. (2)
The click smoothing brings pseudo clicksq0
asso-ciated withu0 and contextsc0. The entire user
feed-back textsAfromqcan be written as:
A(q) =I(u|q)
|M| X
j=1
corr(u0, u)(u0+γ·c0)+γ·c (3)
whereγ is the weight tradeoff betweenuand
asso-ciated contextsc. IfI(u|q) = 0, only the examined
context cis feedbacked for user preference;
other-wise, correlative contexts withuare taken into
con-sideration, which is a process of impact diffusion.
3.2 Personalized Summarization
investigation, we observe that a well generated sum-mary should properly consider a key component of (3)user interests, which captures user preference to summarize what they are interested in.
All above requirements involve a measurement of similarity between two word distributions Θ1
andΘ2. Cosine, Kullback-Leibler divergenceDKL
and Jensen Shannon divergence DJS are all able
to measure the similarity, but (Louis and Nenkova, 2009) indicate the superiority of DJS in
summa-rization task. We also introduce a pair of decreas-ing/increasing logistic functions, L1(x) = 1/(1 + ex) and L2(x) = ex/(1 +ex), to map the
diver-gence into interval [0,1]. V is the vocabulary set andtf denotes the term frequency for wordw.
DJS(Θ1||Θ2) =
1
2[DKL(Θ1||Θ2)+DKL(Θ2||Θ1)]
where
DKL(Θ1||Θ2) =
X
k∈V
p(w|Θ1)logp(w|Θ1) p(w|Θ2)
where
p(w|Θ) = Ptf(w,Θ) w0tf(w0,Θ)
.
Modeling Interest for User Utility. Given a gener-ated summaryS, users tend to scrutinize texts
rele-vant to their interests. Texts related to user implicit feedback are collected asA = P|iQ=1| A(qi).
Intu-itively, the smaller distance between the word distri-bution of final summary (ΘS) and the word
distri-bution of user preference (ΘA), the higher utility of user interestsUuser(S)will be, i.e.,
Uuser(S) =L1(DJS(ΘS||ΘA)). (4)
We model the utility of traditional summarization Utrad(S) using a linear interpolation controlled by
parameter δ between utility from coverage Uc(S)
and utilityUd(S)fromdiversity:
Utrad(S) =Uc(S) +δ· Ud(S). (5)
Coverage Utility. The summary should share a closer word distribution with the source collection (Allan et al., 2001; Li et al., 2009). A good summary focuses on minimizing the loss of main information from the whole collectionD. Utility from coverage
Uc(S)is defined as follows and for coverage utility,
smaller divergence is desired.
Uc(S) =L1(DJS(ΘS||ΘD)). (6) Diversity Utility. Diversity measures the novelty degree of any sentence s compared with all other
sentences within S, i.e., the distances between all other sentences and itself. Diversity utilityUd(S)is
an average novelty score for all sentences inS. For
diversity utility, larger distance is desired, and hence we use the increasing functionL2as follows:
Ud(S) =
1
|S|
X
s∈S
L2(DJS(Θs||Θ(S−s))). (7)
3.3 Balanced Optimization Framework
A well generated summarySshould be sufficiently
aligned with the original source corpus, and also be optimized given the user interests. The utility of an individual summaryU(S)is evaluated by the
weighted combination of these components, con-trolled by parameterλfor balanced weights.
U(S) =Utrad(S) +λ· Uuser(S) (8)
Given the sentence setDand the compression rate φ, there areφ·|D|out of|D|possibilities to generate
S. The IPS task is to predict the optimized sentence
subset ofS∗from the space of all combinations. The
objective function is as follows:
S∗ = argmax
S U
(S). (9)
AsU(S)is measured based on preferred interests
from user interaction within a generation in our sys-tem, we extractSiteratively to approximateS∗, i.e,
maximizeU(S) based on the user feedbacks from
the interaction sessions. Each session is an iteration. We use a similar framework as we have proposed in (Yan et al., 2011).
During every session, the top ranked sentences are strong candidates for the summary to generate and the rank methodology is based on the metricsU(.).
The algorithm tends to highly rank sentences which are with both coverage utility and interest utility, and are diversified in balance: we rank each sentences
according toU(s)under such metrics.
ConsiderS(n−1)generated in the (n-1)-th session
as the topφ|D|ranked sentences in then-th iteration
(denoted byO(n)), they have an intersection set of
Z(n)=Sn−1∩On. There is a substitutable sentence
setX(n)=S(n−1)− Z(n)and a new candidate
sen-tence setY(n) = O(n)− Z(n). We substitutex(n)
sentences with y(n), where x(n) ⊆ X(n) and y(n)
⊆ Y(n). During every iteration, our goal is to find a substitutive pair<x,y>forS:
<x,y>:X × Y → R.
To measure the performance of such a substitu-tion, a discriminant utility gain function∆Ux,y
∆Ux(n(n)),y(n) =U(S
(n))− U(S(n−1))
=U((S(n−1)−x(n))∪y(n))− U(S(n−1))
(10) is employed to quantify the penalty. Therefore, we predict the substitutive pair by maximizing the gain function∆Ux,y over the state setR, with a size of
PY
k=0AkXCYk, where<x,y>∈ R. Finally the ob-jective function of Equation (9) changes into maxi-mization of utility gain by substitutexˆwithyˆduring each iteration:
<x,ˆ yˆ >= argmax
x⊆X,y⊆Y
∆Ux,y. (11)
Note that the objectives of interest utility opti-mization and traditional utility optiopti-mization are not always the same because the word distributions in these texts are usually different. The substitutive pair <x,y> may perform well based on the user preference component while not on the traditional summary part and vice versa. There is a tradeoff between both user optimization and traditional opti-mization and hence we need to balance them byλ.
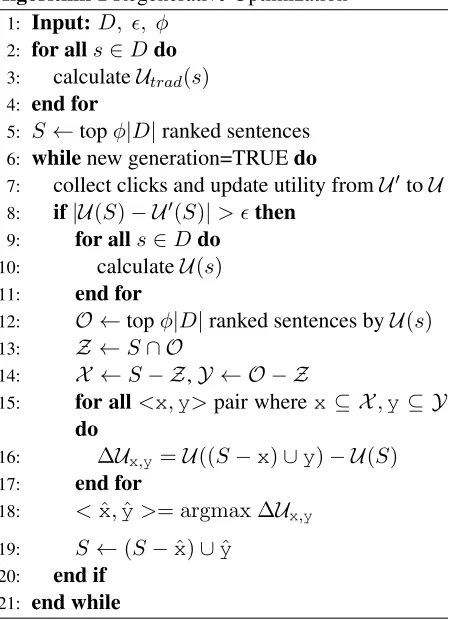
The objective Equation (11) is actually to maxi-mize∆U(S)from all possible substitutive pairs
be-tween two iteration sessions to generateS. The
al-gorithm is shown in Alal-gorithm 1. The thresholdis
set at 0.001 in this study.
4 Experiments and Evaluation
4.1 Datasets
IPS can be tested on any document set but a tiny corpus to summarize may not cover abundant effec-tive interests to attract user clicks indicating their
Algorithm 1Regenerative Optimization 1: Input:D, , φ
2: for alls∈Ddo
3: calculateUtrad(s) 4: end for
5: S←topφ|D|ranked sentences
6: whilenew generation=TRUEdo
7: collect clicks and update utility fromU0 toU 8: if|U(S)− U0(S)|> then
9: for alls∈Ddo
10: calculateU(s)
11: end for
12: O ←topφ|D|ranked sentences byU(s)
13: Z ←S∩ O
14: X ←S− Z,Y ← O − Z
15: for all<x,y>pair wherex⊆ X,y⊆ Y do
16: ∆Ux,y =U((S−x)∪y)− U(S)
17: end for
18: <ˆx,yˆ>= argmax ∆Ux,y
19: S ←(S−xˆ)∪yˆ
20: end if 21: end while
[image:5.612.316.543.82.392.2]preference. Besides, the scenario of small corpus is not quite practical for the exponential growing web. Therefore, we test IPS on large real world datasets. We build 4 news story sets which consist of docu-ments and reference summaries to evaluate our pro-posed framework empirically. We downloaded 5197 news articles from 10 selected sources. As shown in Table 2, three of the sources are in UK, one of them is in China and the rest are in US. We choose them because many of these websites provide handcrafted summaries for their special reports, which serve as reference summaries. These events belong to differ-ent categories of Rule of Interpretation (ROI) (Ku-maran and Allan, 2004). Statistics are in Table 3.
4.2 Experimental System Setups
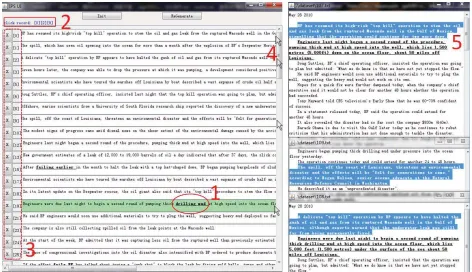
Figure 1: A demonstration system for Interactive Personalized Summarization when compression rateφis specified (e.g. 5%). For convenience of browsing, we number the selected sentences (see in part 3). Extracted semantic units, such as “drilling mud”, are in bold and underlined format (see in part 1). When the user clicks a sentence (part 4), the clicked sentenceIDis kept in theclick record (part 2). Mis-clicked records revocation can be operated by clicking the deletion icon “X” (see in part 3). Once a sentence is clicked, user can track the sentence into the popup source document to examine the contexts. The selected sentences are highlighted in the source documents (see in part 5).
Table 2: News sources of 4 datasets
News Sources Nation News Sources Nation
BBC UK Fox News US
Xinhua China MSNBC US
CNN US Guardian UK
ABC US New York Times US
Reuters UK Washington Post US
Table 3: Detailed basic information of 4 datasets. News Subjects #size #docs #RS Avg.L
1.Influenza A 115026 2557 5 83 2.BP Oil Spill 63021 1468 6 76 3.Haiti Earthquake 12073 247 2 32 4.Jackson Death 37819 925 3 64
#size: total sentence counts; #RS: the number of reference summaries; Avg.L: average length of reference summary measured in sentences.
and traditional utility. User utility is obtained from interaction. The system keeps the clicked sentence records and calculates the user feedback by Equa-tion (3) during every session. Consider sometimes
users click into the summary due to confusion or mis-operations, but not their real interests. The sys-tem supports click records revocation. More details of the user interface is demonstrated in Figure 1.
4.3 Evaluation Metrics
We include both subjective evaluation from 3 evalu-ators based on their personalized interests and pref-erence, and the objective evaluation based on the widely used ROUGE metrics (Lin and Hovy, 2003).
Evaluator Judgments
appropriate but with preference towards “3”.
ROUGE Evaluation
The DUC usually officially employs ROUGE measures for summarization evaluation, which mea-sures summarization quality by counting overlap-ping units such as the N-gram, word sequences, and word pairs between the candidate summary and the reference summary. We use ROUGE-N as follows:
ROUGE-N= P
S∈{RefSum}
P
N-gram∈SCountmatch(N-gram)
P
S∈{RefSum}
P
N-gram∈SCount (N-gram)
whereN stands for the length of the gram and
N-gram∈RefSum denotes the N-grams in the reference summaries while N-gram∈CandSum denotes the N-grams in the candidate summaries. Countmatch (N-gram) is the maximum number of N-gram in the candidate summary and in the set of reference sum-maries. Count(N-gram) is the number of N-grams in the reference summaries or candidate summary.
According to (Lin and Hovy, 2003), among all sub-metrics in ROUGE, ROUGE-N (N=1, 2) is rela-tively simple and works well. In this paper, we eval-uate our experiments using all methods provided by the ROUGE package (version 1.55) and only report ROUGE-1, since the conclusions drawn from differ-ent methods are quite similar. Intuitively, the higher the ROUGE scores, the similar two summaries are.
4.4 Algorithms for Comparison
We implement the following widely used multi-document summarization algorithms as the baseline systems, which are all designed for traditional sum-marization without user interaction. For fairness we conduct the same preprocessing for all algorithms.
Random: The method selects sentences ran-domly for each document collection.
Centroid: The method applies MEAD algorithm (Radev et al., 2004) to extract sentences according to the following parameters: centroid value, positional value, and first-sentence overlap.
GMDS: The Graph-based MDS proposed by
(Wan and Yang, 2008) first constructs a sentence connectivity graph based on cosine similarity and then selects important sentences based on the con-cept of eigenvector centrality.
IPSini: The initial generated summary from IPS
merely modelscoverageanddiversityutility, which
is similar to the previous work described in (Allan et al., 2001) with different goals and frameworks.
IPS: Our proposed algorithms with personaliza-tion component to capture interest by user feed-backs. IPS generates summaries via iterative sen-tence substitutions within user interactive sessions.
RefSum: As we have used multiple reference summaries from websites, we not only provide ROUGE evaluations of the competing systems but also of the reference summaries against each other, which provides a good indicator of not only the upper bound ROUGE score that any system could achieve, but also human inconsistency among refer-ence summaries, indicating personalization.
4.5 Overall Performance Comparison
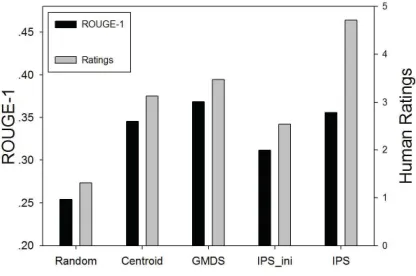
[image:7.612.323.531.344.482.2]We take the average ROUGE-1 performance and hu-man ratings on all sets. The overall results are shown in Figure 2 and details are listed in Tables 4∼6.
Figure 2: Overall performance on 6 datasets.
From the results, we have following observations: •Random has the worst performance as expected, both in ROUGE-1 scores and human judgements.
• The ROUGE-1 and human ratings of Centroid and GMDS are better than those of Random. This is mainly because the Centroid based algorithm takes into account positional value and first-sentence over-lap, which facilitates main aspects summarization and PageRank-based GMDS ranks the sentence us-ing eigenvector centrality which implicitly accounts for information subsumption among all sentences.
Table 4: Overall performance comparison onInfluenza A. ROI∗category: Science.
Systems R-1 95%-conf. H-1 H-2 H-3 RefSum 0.491 0.44958 3.5 3.0 3.9 Random 0.257 0.75694 1.2 1.0 1.0 Centroid 0.331 0.45073 2.5 3.0 3.5 GMDS 0.364 0.33269 3.0 2.7 3.5 IPSini 0.302 0.21213 2.0 2.5 2.5
IPS 0.337 0.46757 4.8 4.5 4.5
Table 5: Overall performance comparison on BP Oil Leak. ROI category: Accidents.
Systems R-1 95%-conf. H-1 H-2 H-3 RefSum 0.517 0.48618 4.0 3.3 3.9 Random 0.262 0.64406 1.5 1.0 1.5 Centroid 0.369 0.34743 3.2 3.0 3.5 GMDS 0.389 0.43877 3.5 3.0 3.9 IPSini 0.327 0.53722 3.0 2.5 3.0
[image:8.612.312.548.103.355.2]IPS 0.372 0.35681 4.8 4.5 4.5
Table 6: Overall performance comparison onHaiti Earth-quake. ROI category: Disasters.
Systems R-1 95%-conf. H-1 H-2 H-3 RefSum 0.528 0.30450 3.8 4.0 4.0 Random 0.266 0.75694 1.5 1.5 1.8 Centroid 0.362 0.43045 3.6 3.0 4.0 GMDS 0.380 0.33694 3.9 3.5 4.0 IPSini 0.331 0.34120 2.8 2.5 3.0
IPS 0.391 0.40069 5.0 4.7 5.0
Table 7: Overall performance comparison on Michael
Jackson Death. ROI category: Legal Cases.
Systems R-1 95%-conf. H-1 H-2 H-3 RefSum 0.482 0.47052 3.5 3.5 4.0 Random 0.232 0.52426 1.2 1.0 1.5 Centroid 0.320 0.21045 3.0 2.5 2.7 GMDS 0.341 0.30070 3.5 3.3 3.9 IPSini 0.287 0.48526 2.5 2.0 2.2
IPS 0.324 0.36897 5.0 4.5 4.8
∗ROI: news categorization defined by Linguistic Data Consortium.
Available at http://www.ldc.upenn.edu/projects/tdt4/annotation
of human judgements on comparable summaries. • The results of ROUGE-1 and ratings for IPSini are better than Random but worse than Centroid and GMDS. The reason in this case may be that IPSini does not capture sufficient attributes: coverage and diversity are merely fundamental requirements.
• Traditional summarization considers sentence selection based on corpus only, and hence neglects
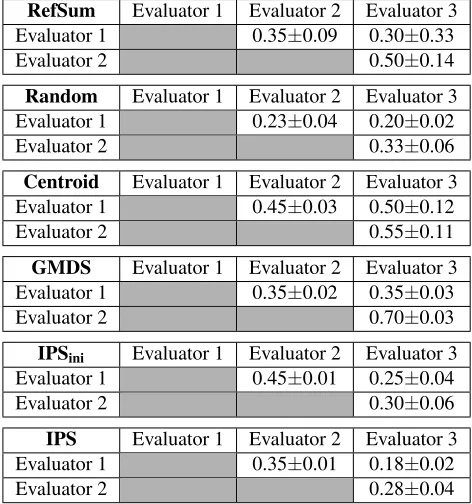
Table 8: Ratings consistency between evaluators: mean
±standard deviation over the 4 datasets.
RefSum Evaluator 1 Evaluator 2 Evaluator 3 Evaluator 1 0.35±0.09 0.30±0.33
Evaluator 2 0.50±0.14
Random Evaluator 1 Evaluator 2 Evaluator 3 Evaluator 1 0.23±0.04 0.20±0.02
Evaluator 2 0.33±0.06
Centroid Evaluator 1 Evaluator 2 Evaluator 3 Evaluator 1 0.45±0.03 0.50±0.12
Evaluator 2 0.55±0.11
GMDS Evaluator 1 Evaluator 2 Evaluator 3 Evaluator 1 0.35±0.02 0.35±0.03
Evaluator 2 0.70±0.03
IPSini Evaluator 1 Evaluator 2 Evaluator 3
Evaluator 1 0.45±0.01 0.25±0.04
Evaluator 2 0.30±0.06
IPS Evaluator 1 Evaluator 2 Evaluator 3 Evaluator 1 0.35±0.01 0.18±0.02
Evaluator 2 0.28±0.04
user interests. Many sentences are extracted due to arbitrary assumption of reader preference, which re-sults in a low user satisfaction. Human judgements under our proposed IPS framework greatly outper-form baselines, indicating that the appropriate use of human interests for summarization are beneficial. The ROUGE-1 performance for IPS is not as ideal as that of GMDS. This situation may result from the divergence between user interests and general infor-mation provided by mass media propaganda, which again motivates the need for personalization.
Although the high disparities between different human evaluators have been observed in (Gong and Liu, 2001), we still examine the consistency among 3 evaluators and their preferred summaries to prove the motivation of personalization in our work.
4.6 Consistency Analysis for Personalization
The low ROUGE-1 scores of RefSum indicate the inconsistency among reference summaries. We con-duct personalization analysis from two perspectives: (1) human rating consistency and (2) content consis-tency among human supervised summaries.
[image:8.612.71.299.353.447.2]Table 9: Content consistency among evaluators super-vised summaries.
Evaluator 1 Evaluator 2 Evaluator 3
Evaluator 1 0.273 0.398
Evaluator 2 0.289 0.257
Evaluator 3 0.407 0.235
RefSum 0.365 0.302 0.394
8. We see that for Random the average rating vari-ation is 0.25, for IPS is 0.27, for IPSini is 0.33, for RefSum is 0.38, for GMDS is 0.47 and for Centroid is the highest, 0.50. Such phenomenon indicates for poor generated summaries, such as Random or IPSini, humans have consensus, but for normal sum-maries without personalized interests, they are likely to have disparities, surprisingly, even for RefSum. General summaries provided by mass media satisfy part of audiences, but obviously not all of them.
The high rating consistency of IPS indicates peo-ple tend to favor summaries generated according to their interests. We next examine content consistency of these summaries with high rating consistency.
As shown in Table 9, although highly scored, these human supervised summaries still have low content consistency (especially Evaluator 2). The low content consistency between RefSum and su-pervised summaries shows reader have individual personalization. Note that the inconsistency among evaluators is larger than that between RefSum and supervised summaries, indicating interests take a high proportion in evaluator supervised summaries.
4.7 Parameter Settings
δcontrols coverage/diversity tradeoff. We tuneδon
IPSini and apply the optimalδ directly in IPS. Ac-cording to the statistics in (Yan et al., 2010), the se-mantic coherent context is about 7 sentences. There-fore, we empirically choose k=3 for the examined
context window. The number of topics is set at
n=50. We assign an equal weight (γ = 1) to
seman-tic units and examined contexts according to analog-ical research of summarization from implicit feed-backs via clickthrough data (Sun et al., 2005).
λis the key parameter in IPS approach, control-ling the weight of user utility during the process of interactive personalized summarization.
Through Figure 3, we see that when λ is small
Figure 3:λv.s. human ratings and ROUGE scores.
(λ ∈ [0.01,0.1]), both human judgements and
ROUGE evaluation scores have little difference. Whenλ∈[0.1,1], ROUGE scores increase
signifi-cantly but human satisfaction shows little response.
λ∈[1,10]brings large user utility enhancement
be-cause user may find what they are interested in but ROUGE scores start to decay. Whenλ∈ [10,100],
ROUGE scores drop much because the emphasized user interests may guide the generated summaries divergent away from the original corpus.
In Figure 4 we examine howλattracts user clicks
and regeneration counts until satisfaction. As the re-sult indicates, both counts increase as λincreases.
When λ is small (from 0.01 to 0.1), readers find
[image:9.612.73.305.100.167.2]no more interesting aspects through clicks and re-generations and stop due to the bad user experience. Asλincreases, the system mines more relevant sen-tences according to personalized interests and hence attracts user clicks and intention to regenerate.
[image:9.612.323.530.539.677.2]5 Conclusion
We present an important and novel summariza-tion problem, Interactive Personalized Summariza-tion (IPS), which generates summaries based on human−system interaction for “interests” and per-sonalization. We formally formulate IPS as a combi-nation of user utility and traditional summary utility, such as coverage and diversity. We implement a sys-tem under such framework for experiments on real web datasets to compare all approaches. Through our experiments we notice that user personalization of interests plays an important role in summary gen-eration, which largely increase human ratings due to user satisfaction. Besides, our experiments indicate the inconsistency between user preferred summaries and reference summaries measured by ROUGE, and hence prove the effectiveness of personalization.
Acknowledgments
This work was partially supported by HGJ 2010 Grant 2011ZX01042-001-001 and NSFC with Grant No.61073082, 60933004. Rui Yan was supported by the MediaTek Fellowship.
References
James Allan, Rahul Gupta, and Vikas Khandelwal. 2001. Temporal summaries of new topics. InProceedings of the 24th annual international SIGIR’01, pages 10–18. D.M. Blei, A.Y. Ng, and M.I. Jordan. 2003. Latent dirichlet allocation. The Journal of Machine Learning
Research, 3:993–1022.
G. Erkan and D.R. Radev. 2004. Lexpagerank: Prestige in multi-document text summarization. In
Proceed-ings of EMNLP’04, volume 4.
Jade Goldstein, Mark Kantrowitz, Vibhu Mittal, and Jaime Carbonell. 1999. Summarizing text documents: sentence selection and evaluation metrics. In Proceed-ings of SIGIR’99, pages 121–128.
Yihong Gong and Xin Liu. 2001. Generic text sum-marization using relevance measure and latent seman-tic analysis. InProceedings of the 24th international
ACM SIGIR conference, SIGIR ’01, pages 19–25.
Q. Guo and E. Agichtein. 2010. Ready to buy or just browsing?: detecting web searcher goals from inter-action data. In Proceeding of the 33rd international
ACM SIGIR conference, SIGIR’10, pages 130–137.
Giridhar Kumaran and James Allan. 2004. Text clas-sification and named entities for new event detection.
InProceedings of the 27th annual international ACM
SIGIR’04, pages 297–304.
Anton Leuski, Chin-Yew Lin, and Eduard Hovy. 2003. ineats: interactive multi-document summarization. In
Proceedings of ACL’03, pages 125–128.
Liangda Li, Ke Zhou, Gui-Rong Xue, Hongyuan Zha, and Yong Yu. 2009. Enhancing diversity, cover-age and balance for summarization through structure learning. InProceedings of WWW’09, pages 71–80. Chin-Yew Lin and Eduard Hovy. 2002. From single
to multi-document summarization: a prototype system and its evaluation. In Proceedings of ACL’02, pages 457–464.
Chin-Yew Lin and Eduard Hovy. 2003. Automatic evalu-ation of summaries using n-gram co-occurrence statis-tics. InProceedings of NAACL’03, pages 71–78. Annie Louis and Ani Nenkova. 2009. Automatically
evaluating content selection in summarization without human models. InEMNLP’09, pages 306–314. R. Mihalcea and P. Tarau. 2005. A language
indepen-dent algorithm for single and multiple document sum-marization. InProceedings of IJCNLP, volume 5. D.R. Radev, H. Jing, and M. Sty. 2004. Centroid-based
summarization of multiple documents. Information
Processing and Management, 40(6):919–938.
Jian-Tao Sun, Dou Shen, Hua-Jun Zeng, Qiang Yang, Yuchang Lu, and Zheng Chen. 2005. Web-page sum-marization using clickthrough data. InProceedings of
SIGIR’05, pages 194–201.
Stephen Wan and C´ecile Paris. 2008. In-browser sum-marisation: generating elaborative summaries biased towards the reading context. In ACL-HLT’08, pages 129–132.
Xiaojun Wan and Jianwu Yang. 2008. Multi-document summarization using cluster-based link analysis. In
Proceedings of SIGIR’08, pages 299–306.
X. Wan, J. Yang, and J. Xiao. 2007a. Manifold-ranking based topic-focused multi-document summarization.
InProceedings of IJCAI, volume 7, pages 2903–2908.
X. Wan, J. Yang, and J. Xiao. 2007b. Single document summarization with document expansion. In Proceed-ings of the 22nd AAAI’07, pages 931–936.
Rui Yan, Yu Li, Yan Zhang, and Xiaoming Li. 2010. Event recognition from news webpages through latent ingredients extraction. InAIRS’10, pages 490–501. Rui Yan, Xiaojun Wan, Jahna Otterbacher, Liang Kong,
Xiaoming Li, and Yan Zhang. 2011. Evolution-ary timeline summarization: a balanced optimization framework via iterative substitution. In Proceedings of the 34th annual international ACM SIGIR’11. Xin Zhao, Jing Jiang, Jing He, Yang Song, Palakorn
Achanauparp, Ee-Peng Lim, and Xiaoming Li. 2011. Topical Keyphrase Extraction from Twitter. In