Effect of Wind Load on Tall Structure in
Different Terrain Category
Pratik P. Ajgar
1, Vishal Gajghate
21Post Graduate Student, 2Assistant Professor, Department Of Civil Engineering, Ghrce Nagpur, Maharashtra, India
Abstract: Construction of tall building is becoming style and need of today’s world. As population is being increasing and space to work and live is contracting. When it comes to tall building tall structure wind does play important role. Wind and Tall Structure are same side of a coin. More the structure is tall more will be wind load acting over it, This paper deals with effect of wind load over a structure in different terrain category. In this paper we shall also study displacement occurred at different level of building. Along with this it also shows displacement of same level of building in different terrain category. The Models were made and analyzed in ETABS-2015 package. G+10, G+15, G+20 models were taken into consideration and are studied. Terrain category consider are TC-1, TC-2, TC-3 and TC-4 according to IS 875 (Part-3):2015. This paper gives good package of information about variation of displacements occurred at different terrains and levels.
Keywords: ETABS 2015, Displacement, Wind Load, TC-1, TC-2, TC-3, TC-4.
I. INTRODUCTION
India is Drastically Growing Country, Its ranks amongst fastest growing country economically and in Infrastructural facility. As it is growing fast and rapidly the horizontal space is being reduced. To overcome such flaws use of high rise building is been preferred over the conventional building so that Vertical Space can be brought into use. When it comes to use of horizontal space tall building
comes into lead role, Tall building are those which are highly susceptible to wind pressure and force. Tall structures can be
constructed in four different wind category i.e. terrain category 1, terrain category 2, terrain category 3 and terrain category 4. Terrain Category can be explained according to IS Code as follows:
[image:1.595.219.378.463.604.2]1) Category 1: Exposed open terrain with few or no obstructions and in which the average height of any object surrounding the structure is less than 1.5m.
Fig 1: Terrain Category 01
2) Category 2: Open terrain with well scattered obstruction having heights generally between 1.5 to 10m
[image:1.595.219.379.627.736.2]3) Category 3: Terrain with numerous closely spaced obstruction having the size of building structure up to 10m in height with or without a few isolated tall structures.
Fig 3: Terrain Category 03
[image:2.595.218.373.268.394.2]4) Category 4: Terrain with numerous large high closely spaced obstructions.
Fig 4: Terrain Category 04
II. MODEL AND LOADING
As said above three models were made i.e. G+10, G+15, G+20.
A. Model 1
Table 1: G+10 Specification
No. Of Storey G+10
Structure RCC Frame.
Floor Height 3.5m
Grade of Concrete M20 for Beam and Slab.
M25 for Column.
Grade of Steel Fe500
Slab Thickness 125 mm
Beam 380x450 mm
Column 750x530 mm
[image:2.595.57.529.442.746.2]B. Model 2
Table 2: G+15 Specification
No. Of Storey G+15
Structure RCC Frame.
Floor Height 3.5m
Grade of Concrete M20 for Beam and Slab.
M25 for Column.
Grade of Steel Fe500
Slab Thickness 125 mm
Beam 380x450 mm
Column 750x530 mm
Fig 6: G+15 Model
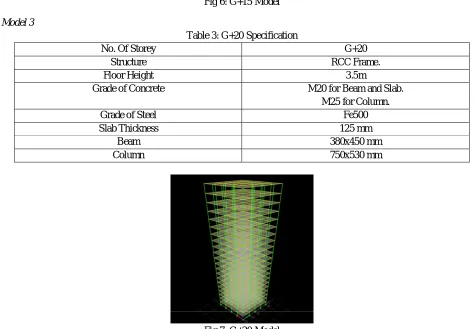
C. Model 3
Table 3: G+20 Specification
No. Of Storey G+20
Structure RCC Frame.
Floor Height 3.5m
Grade of Concrete M20 for Beam and Slab.
M25 for Column.
Grade of Steel Fe500
Slab Thickness 125 mm
Beam 380x450 mm
Column 750x530 mm
[image:3.595.59.528.127.717.2] [image:3.595.56.531.413.742.2]D. Loading
1) Dead Load: (IS 875 (Part 1) 1987): A. Self Load Of Structural Member such as Column, Beams, Slab.
2) Wall Load (200mm AAC Blocks) 0.2x1x3.5x6 = 4.2 kN/m
3) Floor Finish: Load Of Floor Finish: = 1x1x0.05x20x1.5
= 1.5 kN/m2
4) Live Load: (IS 875 (Part 2)-1987)
a) Live Load On Floor for Residential = 2 kN/m2 Factored Load = 1.5x2= 3kN/m2
b) Live Load On Roof = 1.5kN/m2
5) Wind Load: (IS 875 (Part 3)-1987)
A. Wind Speed = 44m/s (Vb) Vz= VbxK1xK2xK3xK4 K1= Risk Coefficient.
K2= Terrain roughness and Height Factor. K3= Topography Factor.
K4= Importance Factor.
Pz= 0.6 Vz2
III. RESULTS
[image:4.595.104.492.365.736.2]Following tables and plots which gives the outcomes of the Study:
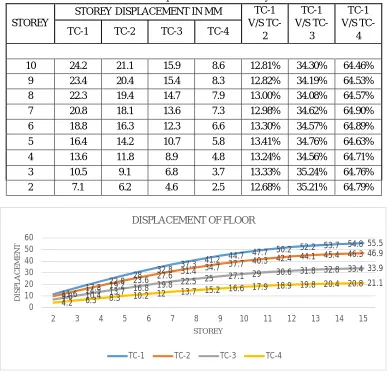
Table 4: Displacement of G+10 Storey
STOREY
STOREY DISPLACEMENT IN MM TC-1
V/S TC-2 TC-1 V/S TC-3 TC-1 V/S TC-4
TC-1 TC-2 TC-3 TC-4
10 24.2 21.1 15.9 8.6 12.81% 34.30% 64.46%
9 23.4 20.4 15.4 8.3 12.82% 34.19% 64.53%
8 22.3 19.4 14.7 7.9 13.00% 34.08% 64.57%
7 20.8 18.1 13.6 7.3 12.98% 34.62% 64.90%
6 18.8 16.3 12.3 6.6 13.30% 34.57% 64.89%
5 16.4 14.2 10.7 5.8 13.41% 34.76% 64.63%
4 13.6 11.8 8.9 4.8 13.24% 34.56% 64.71%
3 10.5 9.1 6.8 3.7 13.33% 35.24% 64.76%
2 7.1 6.2 4.6 2.5 12.68% 35.21% 64.79%
Fig 8: Displacement of G+10 Storey
11.6 17.3
22.8 28
32.8 37.3
41.2 44.7 47.7 50.2
52.2 53.7 54.8 55.5
9.8 14.5
19.2 23.6
27.6 31.4 34.7
37.7 40.3 42.4 44.1 45.4 46.3
46.9
7 10.4 13.7
16.8 19.8 22.5 25
27.1 29 30.6 31.8 32.8 33.4 33.9
4.2 6.3 8.3 10.2 12
13.7 15.2 16.6 17.9 18.9 19.8 20.4 20.8 21.1
0 10 20 30 40 50 60
2 3 4 5 6 7 8 9 10 11 12 13 14 15
D IS P L A C E M E N T STOREY
DISPLACEMENT OF FLOOR
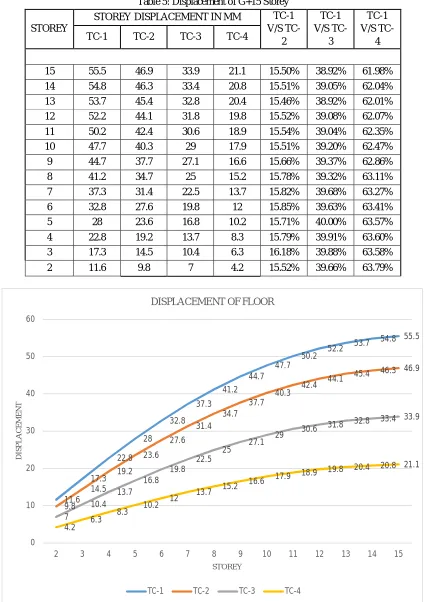
Table 5: Displacement of G+15 Storey
STOREY
STOREY DISPLACEMENT IN MM TC-1
V/S TC-2 TC-1 V/S TC-3 TC-1 V/S TC-4
TC-1 TC-2 TC-3 TC-4
15 55.5 46.9 33.9 21.1 15.50% 38.92% 61.98%
14 54.8 46.3 33.4 20.8 15.51% 39.05% 62.04%
13 53.7 45.4 32.8 20.4 15.46% 38.92% 62.01%
12 52.2 44.1 31.8 19.8 15.52% 39.08% 62.07%
11 50.2 42.4 30.6 18.9 15.54% 39.04% 62.35%
10 47.7 40.3 29 17.9 15.51% 39.20% 62.47%
9 44.7 37.7 27.1 16.6 15.66% 39.37% 62.86%
8 41.2 34.7 25 15.2 15.78% 39.32% 63.11%
7 37.3 31.4 22.5 13.7 15.82% 39.68% 63.27%
6 32.8 27.6 19.8 12 15.85% 39.63% 63.41%
5 28 23.6 16.8 10.2 15.71% 40.00% 63.57%
4 22.8 19.2 13.7 8.3 15.79% 39.91% 63.60%
3 17.3 14.5 10.4 6.3 16.18% 39.88% 63.58%
[image:5.595.95.502.121.638.2]2 11.6 9.8 7 4.2 15.52% 39.66% 63.79%
Fig 9: Displacement of G+15 Storey
11.6 17.3 22.8 28 32.8 37.3 41.2 44.7 47.7 50.2 52.2
53.7 54.8 55.5
9.8 14.5 19.2 23.6 27.6 31.4 34.7 37.7 40.3 42.4
44.1 45.4 46.3 46.9
7 10.4 13.7 16.8 19.8 22.5 25 27.1 29 30.6
31.8 32.8 33.4 33.9
4.2 6.3
8.3 10.2
12 13.7
15.2 16.6
17.9 18.9 19.8
20.4 20.8 21.1
0 10 20 30 40 50 60
2 3 4 5 6 7 8 9 10 11 12 13 14 15
D IS P L A C E M E N T STOREY
DISPLACEMENT OF FLOOR
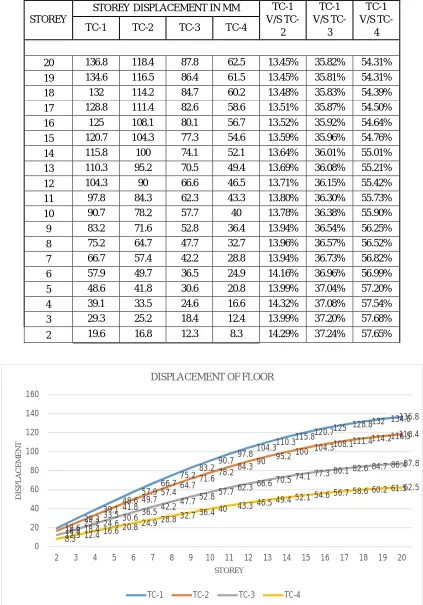
Table 6: Displacement of G+20 Storey
STOREY
STOREY DISPLACEMENT IN MM TC-1
V/S TC-2 TC-1 V/S TC-3 TC-1 V/S TC-4
TC-1 TC-2 TC-3 TC-4
20 136.8 118.4 87.8 62.5 13.45% 35.82% 54.31%
19 134.6 116.5 86.4 61.5 13.45% 35.81% 54.31%
18 132 114.2 84.7 60.2 13.48% 35.83% 54.39%
17 128.8 111.4 82.6 58.6 13.51% 35.87% 54.50%
16 125 108.1 80.1 56.7 13.52% 35.92% 54.64%
15 120.7 104.3 77.3 54.6 13.59% 35.96% 54.76%
14 115.8 100 74.1 52.1 13.64% 36.01% 55.01%
13 110.3 95.2 70.5 49.4 13.69% 36.08% 55.21%
12 104.3 90 66.6 46.5 13.71% 36.15% 55.42%
11 97.8 84.3 62.3 43.3 13.80% 36.30% 55.73%
10 90.7 78.2 57.7 40 13.78% 36.38% 55.90%
9 83.2 71.6 52.8 36.4 13.94% 36.54% 56.25%
8 75.2 64.7 47.7 32.7 13.96% 36.57% 56.52%
7 66.7 57.4 42.2 28.8 13.94% 36.73% 56.82%
6 57.9 49.7 36.5 24.9 14.16% 36.96% 56.99%
5 48.6 41.8 30.6 20.8 13.99% 37.04% 57.20%
4 39.1 33.5 24.6 16.6 14.32% 37.08% 57.54%
3 29.3 25.2 18.4 12.4 13.99% 37.20% 57.68%
2 19.6 16.8 12.3 8.3 14.29% 37.24% 57.65%
Fig 10: Displacement of G+20 Storey
19.6 29.3 39.148.6 57.966.7 75.283.2 90.797.8 104.3110.3 115.8120.7125
128.8132 134.6136.8
16.8 25.2 33.541.8 49.757.4 64.771.6 78.284.3 90 95.2
100 104.3108.1111.4
114.2116.5118.4
12.3 18.4
24.630.6
36.542.2
47.752.8
57.7 62.3 66.6 70.5
74.1 77.3 80.1 82.6 84.7 86.487.8
8.3 12.4 16.6 20.8
24.9 28.8 32.7 36.4
40 43.3 46.5
49.4 52.154.6 56.7 58.6
60.2 61.562.5 0 20 40 60 80 100 120 140 160
2 3 4 5 6 7 8 9 10 11 12 13 14 15 16 17 18 19 20
D IS P L A C E M E N T STOREY
DISPLACEMENT OF FLOOR
[image:6.595.86.509.124.729.2]IV. CONCLUSION
A. Height of Structure or Building is directly proportional to Displacement of that structure i.e. more the height more will be
displacement.
B. Displacement of Model 1 is less than Model 2, displacement of Model 2 is less that Model 3 in every terrain category.
C. Displacement of Building decreases with increase in terrain category.
D. In model 1 displacement of top storey in TC-1 is 12.81%, 34.30% and 64.46% more than TC-2, TC-3, and TC-4.
E. In model 2 displacement of top storey in TC-1 is 15.50%, 38.92% and 61.98% more than TC-2, TC-3, and TC-4.
F. In model 3 displacement of top storey in TC-1 is 13.45%, 35.82% and 54.31% more than TC-2, TC-3, and TC-4.
G. Displacement of every storey in every model is at least 50% more in TC-1 compared to TC-4
REFRENCES
[1] IS: 875:2015 (Part 1) “Indian Standard code of practice for design loads”. Bureau of Indian Standards, New Delhi.
[2] IS: 875:2015 (Part 1) “Indian Standard code of practice for design loads”. Bureau of Indian Standards, New Delhi.
[3] Mohammed Asim Ahmed, Moid Amir, Savita Komur, Vaijainath Halhalli."EFFECT OF WIND LOAD ON TALL BUILDINGS IN DIFFERENT TERRAIN
CATEGORY". IJRET: International Journal of Research in Engineering and Technology eISSN: 2319-1163 | pISSN: 2321-7308
[4] K. Vishnu Haritha, I. Yamini Srivalli. "Effect of Wind on Tall Building Frames - Influence of Aspect Ratio". International Journal of Research in Civil Engineering, Architecture & Design Volume 1, Issue 1, July-September, 2013, pp. 01-06, © IASTER 2013www.iaster.com, ISSN Online: 2347-2855, Print: 2347-8284
[5] Gitadevi B. Bhaskar, Homeshwari V.Gedam. "Effect of Wind Load on High Rise Buildings Considering Aspect Ratio – A Review". International Journal for
Research in Applied Science & Engineering Technology (IJRASET) ISSN: 2321-9653; IC Value: 45.98; SJ Impact Factor:6.887 Volume 5 Issue XI November
2017- Available at www.ijraset.com