MASTER THESIS
The effect of colour and
density on the store perception
M. Stappenbeld
S1236547
Graduation committee:
Dr. A. Fenko
Prof. Dr. A. T. H. Pruyn
1
The effect of colour and density on the store perception
M. Stappenbeld, BA.
Master Marketing Communication, Communication Studies
Department of Behavioural Sciences, University of Twente, Enschede, the Netherlands
Date:
19-06-2012
Place:
Nijmegen, the Netherlands
Advisor:
Dr. A. Fenko, University of Twente
Co-Advisor:
Prof. Dr. A. T. H. Pruyn, University of Twente
Abstract
Very little research is done about the exterior store atmospherics and to what extent itcan influence
consumer behaviour. In the shopping environment the consumer is surrounded by colours. Changing or
adapting these can influence the perceptual, emotional reactions and actual behaviour (Kotler, 1973).
The exterior of a store is occupied largely by the shopping window. By changing the colour of the lights
in the shopping window it is possible that the emotions of potential consumers can be influenced and
that it can interact with human density. An experimental study was conducted using an online 2x2
between-subjects design with 205 participants. Results showed main effects for density and gender and
a three-way interaction effect between density, colour and gender. The attitude towards the shopping
environment was more positive in the high density condition compared to the low density condition,
but the perceived quality of the store was lower. Females scored more positively on attitude towards
the store, pleasure and approach behaviour than males. For males, the attitudes towards the store and
pleasure were more positive with the combination of cold light and high density and warm light and
low density, but the perceived quality of the store was more positive with the combination of cold light
and low density and warm light and high density. Females were less affected by colour than men, for
them density was overwhelming. The attitudes towards the environment, - the store and pleasure were
more positive in the high density condition, but the perceived quality was more positive in the low
density condition. Due to this research, new exterior designs that react to density and match the type
of sex, to positively influence the attitude and pleasure of the shopper, can be applied and some
1.1 Introduction
A considerable amount of research focuses on the interior of the retail environment. However, little
research has been conducted on the effect of the exterior on customer attitudes and/or behaviour.
Research on exterior building shape and characteristics, such as colours and architectural style and
the effects of exterior landscaping and signage are particularly called for since so little is known
about these variables at present. The exterior variables are particularly important since the exterior
of a marketing facility must be considered acceptable before the interior of the building is ever
experienced (Turley & Milliman, 2000).
In this study the focus will be for one thing on the effects of coloured light, because these elements
are relevant to environmental experience (Valdez & Mehrabian, 1994) and colours strongly
determine how we feel (Kotler, 1973). Moreover this element is relatively easy to change and yet,
there are just a few stores that have lights other than white in the shopping window. Furthermore
the study will focus on the effects of human density, because this element is a fundamental
determinant of the shopping experience (Eroglu, Machleit & Chebat, 2005) and is undeniable in a
real retail environment. Consumers do not process environmental elements piecemeal. Rather, it is
the combination that affect how consumers behave. Because density is dynamic, it can provide
useful information for implication in combination with coloured light.
1.2 Theoretical framework
According to the classification of Baker (1986) the environmental elements can be divided into three
components: 1) Design elements, which are present visually and/or tangibly, 2) ambient elements,
which are also tangible, but often in the background and only noticed when they exceed an
acceptable range and 3) social elements, the people who are present in the environment (Baker &
Cameron, 1996). The exterior of a store consists of design- and ambient elements, but the
environment of the store consists of social factors also. It is possible that social factors can influence
the effects of design - and ambient elements. For example a red, arousing exterior of a store in a very
crowded street is likely to evoke different emotions than a red, arousing exterior of a store in a very
quiet street.
The environment influences a person’s wellbeing. According to Mehrabian and Russell (1974)
physical stimuli have a direct influence on emotions and affect behaviour. They assume that the
environmental perception is influenced by three constructs of experience: Pleasure, arousal and
3
Whereby pleasure is the primary assessment and refers to the extent to which a person feels good in
the environment, arousal relates to the extent to which a person feels excited or stimulated and
dominance to the extent to which a person feels in control. Baker and Cameron (1996) state there is
a standard level of environmental elements, which most people feel comfortable. This corresponds
to the arousal theory of Berlyne (1967). Too much environmental elements cause too much arousal
and too little environmental elements cause too little arousal and both situations may evoke
discomfort: Too much may cause anxiety or anger and a lack of it may cause boredom.
As discussed above the environmental stimuli affect the emotional states (pleasure, arousal and
dominance) which in turn affect approach or avoidance behaviours (Mehrabian & Russell, 1974). The
stimuli are the physical features of the environment (e.g. colour, density). Approach behaviour is a
willingness or desire to move towards and explore the environment. Avoidance behaviour is a
willingness or desire to withdraw from an environment. The model of Mehrabian and Russell (1974)
suggests that the effects of store environment factors on approach or avoidance behaviour is
mediated by the affective response (pleasure, arousal and dominance).
1.2.1 Shopping motivations
There are two types of shopping motivations/goals: utilitarian and hedonic. Utilitarian shoppers seek
to acquire products through the use of heuristics, goal-oriented behaviour, risk reduction strategies
and achievement of information search goals. Alternatively hedonic shoppers focus on fun,
entertainment and the more enjoyable aspects of shopping, whether or not a purchase occurs
(Babin, Darden & Griffin, 1994). However, the distinction is often not very sharp. When a consumer is
pressed in time he/she often becomes a run shopper and becomes less favourable towards a store
with a high level of human density.
A study by Van Rompay, Krooshoop, Verhoeven and Pruyn (2011) proposes shoppers have different
social needs. The need for affiliation is a fundamental human motivation involving the urge to seek
and enjoy relationships with other people (Hill, 1987). Consumers vary in the extent to which they
value the presence of others. There are four reasons for consumers to affiliate for others: Some find
social contact stimulating or exciting, it may generate attention, emotional support and opportunities
for social comparison. A shopping trip is thus for some people not only a goal-directed activity, but
also a social experience (Van Rompay et al., 2011).
According to Buttle (1992) there are sex role orientations in shopping. Women do most of the
4
It could be said that men buy and women shop. Women see shopping as a fun experience and think
of the hedonic aspects of shopping as more important than men (Dholakia, 1999). Most men who
shop see themselves as fulfilling an instrumental need, rather than engaging in shopping for
shopping’s sake (Campbell, 1997), which is fairly common among women. Women proved to be
more involved with the purchasing activity and associate shopping with their role in the family
(Slama & Tashchian, 1985).
Yet men are becoming increasingly visible in retail venues. Dholakia, Pedersen and Hikmet (1995)
observed that 10% of men claim to be primary grocery shoppers in their families, with over half
buying their own clothes. They also found that the more men report being responsible for a
particular type of shopping, the more they enjoy the activity.
Several researchers (Roberts and Wortzel, 1979; Schaninger &Allen, 1980) have suggested
that as gender-neutral roles continue to develop (as more women enter the workforce), male/female
differences with respect to consumer behaviour will diminish.
1.2.2 Colour
Colours are often categorized as warm (red, orange, and yellow) or cold (blue and green). Red
colours are arousing, while cold colours are relaxing (Jacobs & Suess, 1975; Adam & Osgood, 1973).
There are three perceptual dimensions of colour: Hue, brightness and saturation. High saturation can
stimulate agitation, whereas a low saturation can stimulate calmness (Baker & Cameron, 1996). The
hue is determined by its wavelength. Short wavelength is associated with cool colours and long
wavelength with warm colours with orange and violet as extremes (Crowley, 1993). Thus colours
with short wavelenghts evoke generally better feelings (Valdez & Mehrabian, 1994), however colours
with long wavelenghts are generally more arousing.
The effect of and preference for a colour also varies by location, culture and gender. The colour red
for example will have another effect in a hospital than in a restaurant. Colours can have different
symbolic meanings and associations across cultures, resulting in different preferences and effects. A
study by Hurlbert, Ling and Robinson (2006) about colour preference and gender shows that women
prefer red-purple colour dimensions and that man prefer blue-green colour dimensions.
Research into the use of colour within a retail environment shows that it can influence shopping
behaviour. In laboratory experiments conducted by Belizzi & Hite (1992) retail environments were
simulated using red and blue colours. More positive retail outcomes occurred in blue rather than red
5
More simulated purchases, fewer purchase postponements, and stronger inclinations to shop and
browse were found in blue retail environments. This is in line with the findings of Jacob and Suess
(1975) who state that blue and green (cold colours) are perceived to be the most pleasant in a retail
environment and are also evaluated more positively than shops with a warm (orange) interior.
Babin, Hardesty and Suter (2003) investigated with a scenario study the importance of colour
(and lighting) in the interior of a fashion store. Results shows that shoppers react more favorably to
cool colours and rated the blue environments as more likable than the orange environment. The
purchase intentions were also influenced more positively in the blue environment.
Van Rompay, Tanja-Dijkstra, Verhoeven and van Es (2011) investigated the effect of colour and
shopping intentions. Results show that the effect is dependent on the goals of the shopper:
task-oriënted or recreational (fun/run shoppers). The fun shoppers responded positively towards the
colour in the store: They were more invigorated and indulgent in a red than a blue store. But the
same red environment was too distracting or arousing for goal pursuit and in accordance run
shoppers rated the blue store as more relaxing and pleasant than the red store. Van Rompay et al.
(2011) suggest that when people are browsing and crowding is low, the arousal levels should be
increased by selecting warm colours such as yellow and red. At peak hours or before closing time
(when task-oriented shoppers are often large in number and/or crowding is high), cool colours such
as blue and green are advisable to reduce levels of arousal.
Belizzi, Crowley and Hasty (1983) did a laboratory experiment to test whether colour affects
approach orientation and attraction. It showed that persons are physically drawn to warm colours,
but that warm coloured environments are generally unpleasant. In the study the subjects actually sat
closer to yellow and red walls than to blue and green walls. Subjects indicated that while warm
environments were bright and colourful, they also considered them to be less attractive and less
pleasant than cooler environments. The warm colours were rated higher on an activity factor, but
lower or unfavourable on an evaluative factor. Customers may consider shortening their shopping
time in a negative, tense environment. Also, warm colours were associated with unplanned, impulse
purchases. These results indicate that if a retail display is designed to draw customers physically by
using warm colours, it runs the distinct risk of creating a less-than-attractive or less-than-pleasant
environment. While red and other warm colours may be good physical attraction colours, they were
rated colourful yet negative, bright yet tense. Bellizzi et al. (1983) recommend not to use warm
colours for bulk usage, as it can become irritating and distracting on larger scale. Note that in this
research the examined colour effects were in the context of a furniture store and that fully saturated
6
Based on these results it can be suggested to use cooler colours within the store, because consumers
feel more pleasant and will stay longer . Warmer colours are probably more suitable for a store’s
exterior or display window to draw customers into the store.
1.2.3 Colour and light
Light and colour combined have seldom been investigated (Hardesty and Suter, 2003). Baker and
Cameron state that light has influence on human behaviour. Light has a strong effect on the degree
of arousal (Gifford, 1988; Miwa & Hanyu, 2006). In a study of non chromatic colours by Valdez et al.
(1994) it was found that the brightness strongly determines the degree of stimulation and
dominance.
Light can also influence a shop’s image and the stimulus to look at and scrutinize the
merchandise (Baker, 1994). The literature suggests that bright fluorescent lights and warm colours
are more consistent with a discount store concept and that soft lights and cool colours are more
consistent with a prestige store concept (Baker et al., 1992; Belizzi & Hite, 1992; Schlosser, 1998).
Areni and Kim (1994) did a field experiment on the impact of in-store lighting in a centrally located
retail establishment (wine cellar of a restaurant). They found that customers examined and handled
more items under bright lighting conditions than under soft lighting conditions. Also they handled
more eye level merchandise when the lighting was bright rather than soft. They point out that
attention must be given to the impact of lighting on functional aspects. A restaurant for example,
typically employs soft lighting to create a romantic atmosphere, but this is at the expense of the
readability of the menu (Areni & Kim, 1994). In an extending study Summers and Herbert (2001)
tested the effect of light in two types of stores: A hardware store and a western apparel/feed store.
The results confirm the findings of Areni and Kim (1994) that consumers examined and handled more
items under bright lighting than soft lighting. In addition results showed that consumers touched
more items and picked up more belts with additional display lighting. These results supports that
light affects arousal and can increase approach behaviours.
According to Baker et al. (1994) lights may moderate the effect of colour. These findings are
confirmed by a scenario study of Babin et al. (2003) who compared an orange and blue shop with
different levels of lighting and found that it affected consumers’ cognitive representation and
affective reaction. The blue shop was preferred the most, but when the orange shop was combined
7
1.2.4 Density
Retail density is defined by Eroglu, Machleit and Chebat (2005) as the number of people (human
density) and objects (spatial density) in a limited space. Shoppers perceive retail crowding when
density restricts or interferes with their activities and shopping goals. Retail crowding affects
consumer behaviour. It is a fundamental determinant of the shopping experience.
In a typical shopping street there are normally no or almost no spatial elements, which restrict or
interfere with the shoppers’ activities and goals. Therefore this study will focus only on human
density.
Crowding can create psychological stress and increased arousal (Michon, Chebat & Turley, 2004).
When human density is low, people can get bored, resulting in avoidance behaviour. The effect of
human density on consumer perceptions and behaviour varies depending on the motivation and
goals of the shopper (Eroglu & Harrell, 1986) and types of stores (discount versus upscale) (Machleit,
Eroglu & Mantel, 2000). Density negatively influences perceived control (Hui & Bateson, 1991) by
restricting movement, lengthening of shopping time, presenting social interactions etc. However by
a study by Van Rompay, Galetzka, Pruyn and Moreno-Garcia (2008) density also negatively
influenced perceived control, but only for those high in need for control. Furthermore a study by Van
Rompay, Krooshoop, Verhoeven and Pruyn (2011) showed that the effect of density on shopping
pleasure and approach behaviour vary with shoppers’ affiliation needs: Negative effects were only
apparent for shoppers with low affiliation needs.
1.2.5 Colour, light and density
Little research is done about the interaction of colour (and/or light) and density in a retail
environment. Colour and density can both have influence on the dimensions pleasure, arousal and
dominance, which in turn influence behaviour. It is known that space is experienced as less busy
when the colours have short wavelength (Mehrabian & Russell, 1974),
In an experiment of Baker, Levy and Grewal (1992) a group of subjects was exposed to one of four
videotapes manipulated with low/high ambient levels ( background classical music with soft lighting/
foreground top 40 music and bright lighting) and low/high social levels (one employee ignoring
customers/ three friendly employees) in a laboratory setting. Pleasure, arousal and willingness to buy
were measured by a self-administered questionnaire. The results show that the high social store
environment initiated greater feelings of arousal in respondents than did the low social store
environment. Furthermore they found that the ambient cues interact with social cues to influence
8
Thus when the ambient environment is low, the social factor becomes important and similarly when
the social environment is low, the ambient factor becomes more important. Because the ambient
cues consisted of music and lighting, the results from lighting alone are impossible to interpret.
It still remains uncertain how density interacts with colour and vice versa. Presumably colour and
human density will strengthen or weaken each other. For example a red, arousing colour of the
exterior may increase the perceived human density and evoke even higher levels of arousal.
1.2.6 Main problem setting
In the shopping environment the consumer is surrounded by colours. Changing or adapting these can
influence the perceptual, emotional reactions and actual behaviour (Kotler, 1973). The exterior of a
store is occupied largely by the shopping window. By changing the colour of the lights in the
shopping window it is possible that the emotions of potential consumers can be influenced and that
it can interact with human density. A fashion store was chosen deliberately. The shopping window
can be determinative for these type of stores, because there are many stores with similar products.
Fashion stores always have big shopping windows where mannequins demonstrate the clothing.
Even outside opening hours it is important that the exterior attracts potential clients to come back
and visit.
Therefore the key question of this research will be: How can colour of the lights in the shopping
window of a fashion store be strategically deployed in low vs. high human density shopping
environments to positively influence emotions, the attitude towards the store and shopping
environment?
1.2.7 Hypotheses
It is expected that in a quiet shopping environment (low human density) warm coloured lighting in
the shopping window in comparison to cool coloured lighting will lead to a more positive attitude
towards the store and shopping environment and that in a crowded shopping environment (high
human density) cool coloured lighting in the shopping window in comparison to warm coloured
lighting will lead to a more positive attitude towards the store and shopping environment.
These expectations are in line with the arousal theory of Berlyne (1967) which states that too
much arousal caused by too many environmental elements and too little arousal caused by too little
environmental elements evoke emotion of discomfort and that there is an optimum level of arousal
9
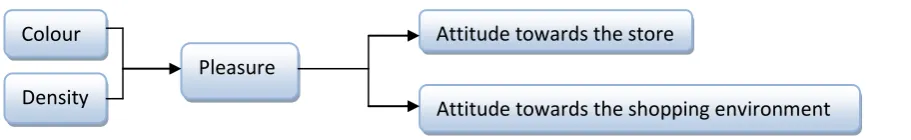
H1. In a quiet shopping environment (low human density) warm coloured lighting in the shopping window in comparison to cool coloured lighting will lead to more pleasure and subsequently a more positive attitude towards the store and shopping environment.
[image:10.595.66.522.256.326.2]H2. In a crowded shopping environment (high human density) cold coloured lighting in the shopping window in comparison to warm coloured lighting will lead to more pleasure and subsequently a more positive attitude towards the store and shopping environment.
Figure 1. Conceptual Research Model
2. Materials and methods
2.1 Participants and design
A total of 205 valid online questionnaires were completed. 84 (41%) were male and 121 (59%)
female. Age varied between 13 and 77 years (M=28.65, SD=11.96). In total 153 participants (74.6%)
liked to shop against 51 participants (24.9%) who did not like to shop, of which the major part were
men. Most participants indicated they went shopping at least once a month.
The questionnaire was distributed in English as well as in Dutch (see appendix A for the English
version and appendix B for the Dutch version).
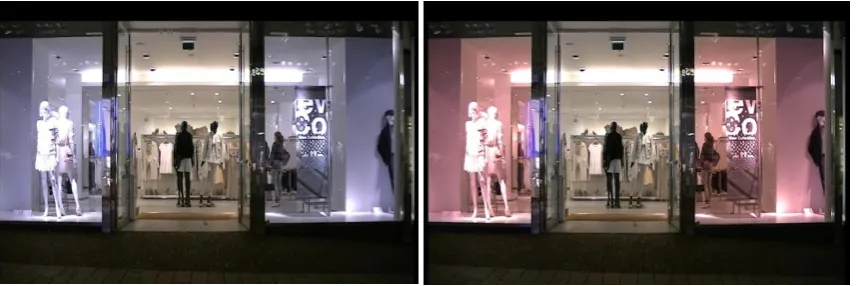
To test the hypotheses an experimental 2 x (density: high vs. Low) x2 (colour of the lights in
the shopping windows: warm vs. cold) between participants design was employed. Density was
manipulated by showing one of two video’s shot at a different time: crowded and non-crowded (see
figure 2).
The colour of the lights in the shopping windows were manipulated by showing one of two different
video’s, in which the colour was manipulated with Adobe after effects. The colour used in the main
study was selected based on the results of a pre-test. 21 participants rated 13 possible colour
scheme’s of the lights in the shopping window on a 9 points semantic differential scale (1: Cold,
9:Warm). The two colours chosen for the main study were blue and red, these were rated the most
cold and most warm (see figure 2). Colour
Density
Pleasure
Attitude towards the store
10
Figure 2a. High density condition with cold (left) vs. warm (right) coloured lights
Figure 2b. Low density condition with cold (left) vs. warm (right) coloured lights
Attitude towards the store, Attitude towards the shopping environment, Pleasure, Arousal,
Dominance and Approach behaviour were the dependent variables. To control that the stimuli
worked as they were supposed to work, seven control variables were added that measured the
attitude towards shopping, how frequently participants went shopping and to what extent they
showed compulsive shopping behaviour, whether they thought the shopping environment was
crowded, the lights of the shopping windows had colour, whether they recognized the store and
what their favourite colour was.
2.2. Procedure
An online questionnaire was created in Thesis Tools and available online for 17 days, from March 23
to April 2, from April 24 to 26 and from May 15 to 17. Participants were recruited by sending email
[image:11.595.75.505.307.450.2]11
Then by posting on online social networks (LinkedIn, Twitter, Facebook) and by asking people in the
public library of Arnhem, library of the Radboud University in Nijmegen and the auditorium of the
HAN in Arnhem to participate. Attempts have been made to reach a group as large and diverse as
possible to ensure the generalizability. Participants who reported to shop daily or never and
participants who recognized the store in the video were deleted. Participants were randomly
assigned to one of the four conditions.
2.3 Stimuli
For the high and low human density condition a video was made in a shopping street focusing on the
exterior of a shop on a very crowded and a quiet moment. The crowded condition was shot at
19.30pm and the quiet condition was shot at 20.50pm, just before closing time of the shop.
Both video’s were shot from exactly the same angle, by using a tripod. In the low density condition
there was never more than one person in the street and in the high density condition there were all
the time at least three persons in the video. The video lasted twenty seconds.
For the warm and cold coloured condition the two video’s taken were edited with Adobe After
Effects. With this programme it was possible to display the same exterior of the same store with
warm versus cold coloured lights in the shopping window. The manipulated colours were based on
the pre-test described in section 2.1. To ensure that the manipulation of the colours were clear
enough it was decided to film at late night shopping. The brand name of the store was erased from
the video and it was chosen to film a shop which had a relatively neutral exterior design.
The stimuli were initiated with the following instruction: “Now you are going to watch a video of a
shopping environment. Imagine that you are there. It is late-night shopping and you want to buy yourself a new outfit. The store you can see in the video sells fashionable clothing for both men and women.” Then the video representing the manipulations of one of the four conditions was showed.
2.4 Measures
All items are included in appendix A and B.
Attitude towards shopping was measured with one item “Do you like shopping?” (Yes, No).
Frequency of shopping was measured with one single item “How frequently do you go shopping?” on
a five point Likert scale (1: Never, 2:Anually, 3:Monthly, 4: Weekly, 5: Daily). Then the variable
compulsive shopping behaviour was measured by the scale of O’Guinn and Faber (1989;1992), but
12
The scale consisted of three items on a five points Likert scale (1: Very infrequent, 5: Very frequent),
for example: “How frequently have you experienced the following? Bought something and when I
got home wasn’t sure why I had bought it” and “My closets are full of unworn clothing”. The scale
was reliable (α=.73).
Attitude towards the store was measured with two scales. First by adjusting the scale of
Chattopadhyay and Basu (1990) with one item on a five points Likert scale (1: Strongly disagree, 5:
Totally agree): “I like the shop” and second by using the scale of Pan & Siemens (2010) with five
items on a five points semantic differential scale, such as: “The store in the video is …”
“unfavorable-favorable” and “bad-good”. This scale was very reliable (α=.90). Originally this scale consisted of six
items included “The store in the video is…” “low quality-bad quality”, however this item reduced the
reliability of the total scale and is therefore considered separately as a single item variable called
Perceived quality of the store.
Attitude towards the shopping environment was measured in the same manner as Attitude towards
the store (1) adjusting the scale of Chattopadhyay and Basu (1990) with one item: “I think this is a
nice shopping environment”.
The dimensions arousal, pleasure and dominance were measured based on the scale of Mehrabian
and Russell (1974). Each dimension was measured with six statements on a five point Likert scale (1:
Not at all, 5: Very much so). Pleasure was measured for example by: “I feel happy in this shopping
environment” and “I feel relaxed in this shopping environment”. The scale was reliable (α=.89).
Arousal was measured for example by: “I feel stimulated when I see this store” and “I feel dull when I
see this store”. The reliability was also reliable (α=.78). Dominance was measured by for example: “I
feel autonomous in this shopping environment” and “I feel controlled in this shopping
environment”. This reliability was acceptable (α=.72).
Finally approach behaviour was measured by adjusting the scales of Van Rompay et al. (2008) and
Matilla & Wirtz (2001) with 6 items on a five point Likert scale (1:Not at all, 5: Very much so), for
example: “This store would attract my attention”, and “I would consider to enter this store”, on a
seven point Likert scale (1: Not at all, 5: Very much so). Three items were negatively formulated to
13
3. Results
3.1 Manipulation checks
As regards the manipulation of density, 46.1% participants rated the high density condition as
crowded, 43.1% as non-crowded and 9.8% could not recall whether the environment was crowded or
not. For the low density condition, 91.3% rated it as non-crowded, 1% as crowded and 6.8% could
not recall it. This was measured with a control question at the end of the questionnaire: "Did you
think the shopping area was crowded?"
What concerns the manipulation of colour, in the cold condition 47.1% of the participants
noticed the lights were coloured, 32.4% did not notice that the lights were coloured and 20.6% could
not recall whether the lights were coloured. For the warm condition, 16.5% noticed the lights were
coloured, 69.9% did not notice that the lights were coloured and 13,6% could not recall it. Despite
the fact that in the cold condition more participants noticed that the lights were coloured, in the
warm condition they could better recall which colour it actually was. This was measured with a
control question at the end of the questionnaire: "Did the lights of the shopping windows have
colour?" and "If you answered yes, what colour did the lights have?".
3.2 Multivariate analysis of covariance
To detect differences between the four experimental groups, to reduce type 1 errors and to
incorporate the correlations a two way between subjects MANCOVA was conducted with Attitude
towards the store (1), Attitude of the environment, Attitude towards the store (2), Perceived quality
of the store, Arousal, Pleasure, Dominance, Approach behaviour as dependent variables, colour of
the lights in the shopping window and human density as fixed factors. The model controlled for age
and gender by using age as a covariate and gender as a fixed factor, because these variables had
quite some consequences for the analysis. Only the variable compulsive shopping was removed from
the model, because it did not have consequences for the results. Preliminary assumption testing was
conducted to check for normality, linearity, univariate and multivariate outliers, homogeneity of
variance-covariance matrices, multicollinearity, homogeneity of regression slopes and reliable
measurement of the covariate with no serious violations noted.
3.2.1 Density
There was a significant main effect for density on the combined dependent variables: F(8,188)=4.28,
p<=.000; Wilks’ Lambda=.85; partial eta squared=.15. When the results for the dependent variables
were considered separately, three variables reached statistical significance, using a Bonferroni alpha
14
Attitude towards the shopping environment: F (1, 195)=20.00,p=.000, partial eta squared=.09. An
inspection of the mean scores indicated that the attitude towards the shopping environment in the
high density conditions (M=3.41, SD=.97) reported higher levels than in the low density conditions
(M=2.71, SD=1.04), see table 1. Perceived quality of the store: F(1,195)=4,63,p=.033, partial eta
squared=.02. The perceived quality of the store was higher in the low density conditions (M=3.50,
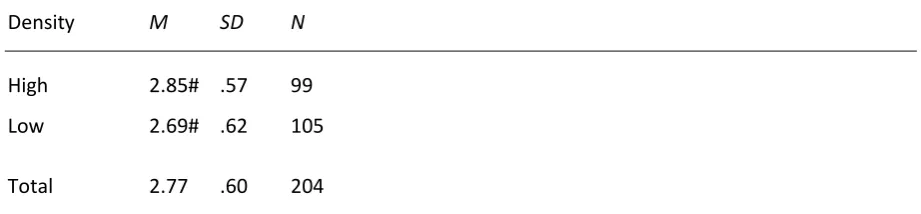
SD=1.05) compared to the high density conditions (M=3.15, SD=1.20), see table 2. Arousal:
F(1,195)=3.74,p=.055, partial eta squared=.02. It appeared that participants were slightly more
aroused in the high density conditions (M=2.84, SD=.57) than in the low density conditions (M=2.68,
[image:15.595.69.282.350.457.2]SD=.62), see table 3.
Table 1. Mean scores of Attitude towards the shopping environment as a function of density (High vs. Low)
Density M SD N
High 3.37** .97 99
Low 2.71** 1.04 105
Total 3.03 1.05 204
Note: means with * differ significantly in the
[image:15.595.316.526.351.456.2]row:*p<.001
Table 2. Mean scores of Perceived quality of the store as a function of density (High vs. Low)
Density M SD N
High 3.13* 1.20 99
Low 3.50* 1.05 105
Total 3.32 1.14 204
Note: means with * differ significantly in the row:*p<.05
Table 3. Mean scores of Arousal as a function of density (High vs. Low)
Density M SD N
High 2.85# .57 99
Low 2.69# .62 105
Total 2.77 .60 204
[image:15.595.67.528.594.701.2]3.2.2 Colour
No significant main effect was found for the manipulation colour, F (8,188)=1.71,p=.098, partial eta
squared=.07, ns.
3.2.3 Gender
There was a significant main effect for gender on the combined dependent variables:
F(8,188)=2.51,p=.013; Wilks’ Lambda=.90; partial eta squared=.10. When the results for the
dependent variables were considered separately, the five differences to reach statistical significance,
using a Bonferroni alpha level of .01, were Pleasure, Attitude towards the store(1), Attitude towards
the store(2), Arousal and Approach behaviour.
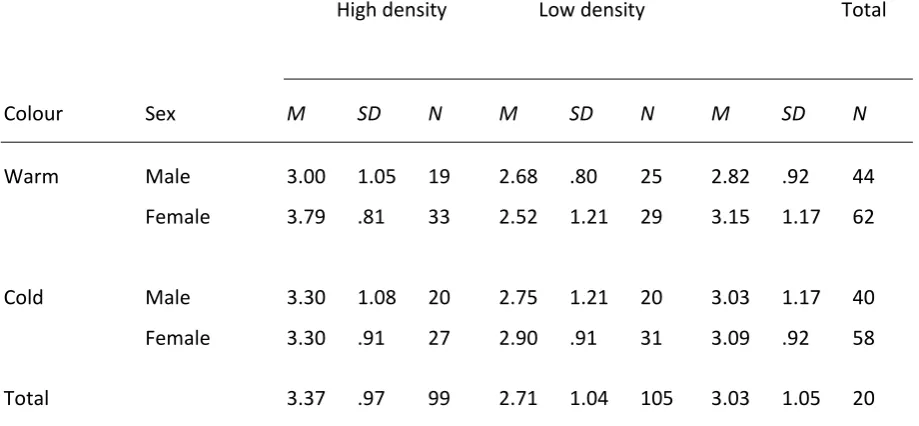
Pleasure: F(1,195)=10.89,p=.001, partial eta squared=.05. The means indicate higher levels of
pleasure in the shopping environment for females (M=3.11, SD=.73) in comparison to males (M=2.66,
SD=.66), see table 4. Attitude towards the store(1): F(1,195)=10.01, p=.002, partial eta squared=.05.
An inspection of the mean scores indicated that females reported higher levels of attitude towards
the store (M=2.96, SD=1.04) than males (M=2.42, SD=.99), see table 6. Attitude towards the store (2):
F(1,195)=3.55,p=.061, partial eta squared=.02. In line with the previous variable females reported
higher levels of attitude towards the store (2) (M=3.15, SD=.87) than males (M=2.91, SD=.89), see
table 5. Arousal: F(1,195)=4.23, p=.041, partial eta squared=.02. Females felt more aroused
(M=2.85,SD=.60) than males (M=2.67,SD=.58) in the shopping environment, see table 7. Approach
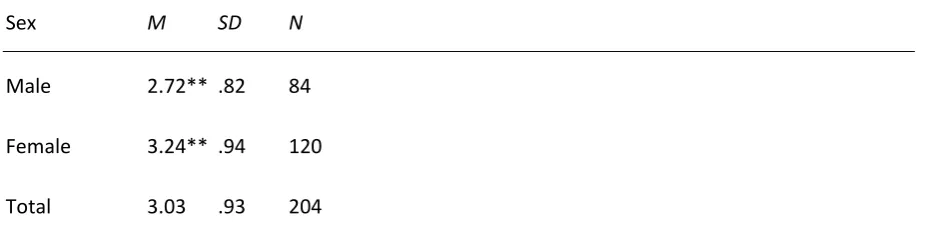
behaviour: F(1,195)=13.52,p=.000, partial eta squared=.07. Females (M=3.19, SD=.94) showed higher
levels in approach behaviour than males (M=2.54, SD=.82), see table 8.
Table 4. Mean scores of Pleasure as a function of gender (Male vs. Female)
Sex M SD N
Male 2.77** .66 84
Female 3.15** .73 120
Total 3.00 .73 204
Note: means with ** differ significantly in the row: **p<.001
Table 5. Mean scores of Attitude towards the store (2) as a function of gender (Male vs. Female)
Sex M SD N
Male 2.87# .89 84
Female 3.18# .87 120
Total 3.05 .89 204
Table 6. Mean scores of Attitude towards the store (1) as a function of gender (Male vs. Female)
Sex M SD N
Male 2.49* .99 84
Female 3.00* 1.04 120
Total 2.79 1.05 204
Note: means with * differ significantly in the row: *p<.05
Table 7. Mean scores of Arousal as a function of gender (Male vs. Female)
Sex M SD N
Male 2.66* .60 84
Female 2.82* .67 120
Total 2.80 .64 204
[image:17.595.68.540.341.457.2]Note: means with * differ significantly in the row: *p<.05
Table 8. Mean scores of Approach behaviour as a function of gender (Male vs. Female)
Sex M SD N
Male 2.72** .82 84
Female 3.24** .94 120
Total 3.03 .93 204
Note: means with ** differ significantly in the row: *p<.001
3.2.4 Interaction density (gender) and colour
No statistical significant two-way interaction was reached for the manipulations density and colour,
F(8,188)=.67,p=.71, partial eta squared=.03 , ns. Neither for the manipulation colour and gender,
F(8,188)=.76 ,p=.64, partial eta squared=.03, ns.
3.2.5 Interaction density and gender
There was no statistical significant two-way interaction for density and gender: F(8,188).95,p=.4;
partial eta squared=.04, ns.
3.1.6 Interaction density, colour and gender
The main effects of density and gender were qualified by a significant three-way interaction between
density, colour and gender on the combined dependent variables: F(8,188)=2.40,p=.017; Wilks’
17
Considered separately using a Bonferroni alpha level of .01, four differences reached statistical
significance: Pleasure, Attitude towards the store(1), Attitude towards the shopping environment
and Perceived quality of the store.
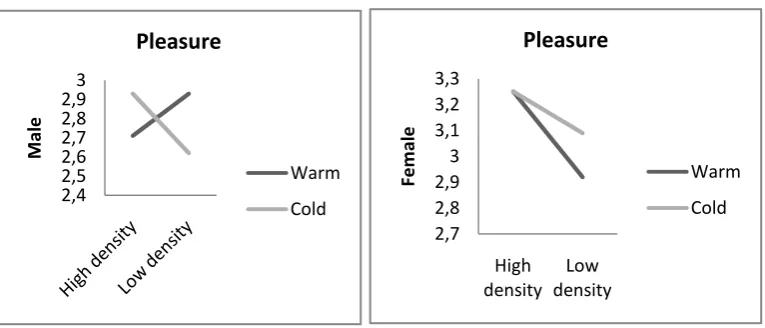
Pleasure: F(1,195)=3.17, p=.077, partial eta squared=.02. ns. For males, pleasure in the shopping
environment was higher in the low density condition combined with warm light than cold light and in
the high density condition combined with cold light than warm light. For females, pleasure was
higher in the high density conditions than in the low density conditions. In the high density
conditions colour did not have consequences for their pleasure, but in the low density condition
[image:18.595.71.528.323.539.2]pleasure was higher with cold coloured lights in the shopping windows than warm coloured lights.
Table 9. Mean scores of Pleasure as a function of density (High vs. Low), colour (Warm vs. Cold) and gender (Male vs. Female)
High density Low density Total
Colour Sex M SD N M SD N M SD N
Warm Male 2.65 .80 19 2.93 .59 25 2.81 .70 44
Female 3.30 .57 33 2.93 .79 29 3.13 .80 62
Cold Male 2.81 .68 20 2.67 .60 20 2.74 .63 40
Female 3.29 .63 27 3.09 .67 31 3.18 .66 58
Total 3.07 .71 99 2.93 .74 105 3.00 .73 204
[image:18.595.74.457.604.768.2]18
Attitude towards the store (1): F(1,195)=4.67, p=.032, partial eta squared=.02. It appeared that for
men, in the high density conditions, the attitude is higher when the lights in the shopping window
are cold coloured than warm coloured and in the low density condition slightly higher when the
lights are warm coloured than cold coloured. For females the attitude is higher in the high density
condition than in the low density condition, regardless which colour. In the low density condition the
[image:19.595.71.527.253.469.2]attitude is higher with warm coloured lights than cold coloured lights.
Table 10. Mean scores of Attitude towards the store as a function of density (High vs. Low), colour (Warm vs. Cold) and gender (Male vs. Female)
High density Low density Total
Colour Sex M SD N M SD N M SD N
Warm Male 2.11 .88 19 2.56 .72 25 2.36 .81 44
Female 3.15 .87 33 2.62 1.05 29 2.90 1.04 62
Cold Male 2.80 1.06 20 2.45 1.23 20 2.63 1.15 40
Female 3.22 1.05 27 3.00 1.03 31 3.10 1.04 58
[image:19.595.71.441.540.699.2]Total 2.90 1.06 99 2.69 1.02 105 2.79 1.05 204
Figure 4. Three-way interaction between density, colour and gender on the attitude towards the store (1) 0 1 2 3 4 High density Low density M al e
Attitude towards the store
(1)
Warm Cold 0 1 2 3 4 High density Low density Fem al eAttitude towards the store
(1)
19
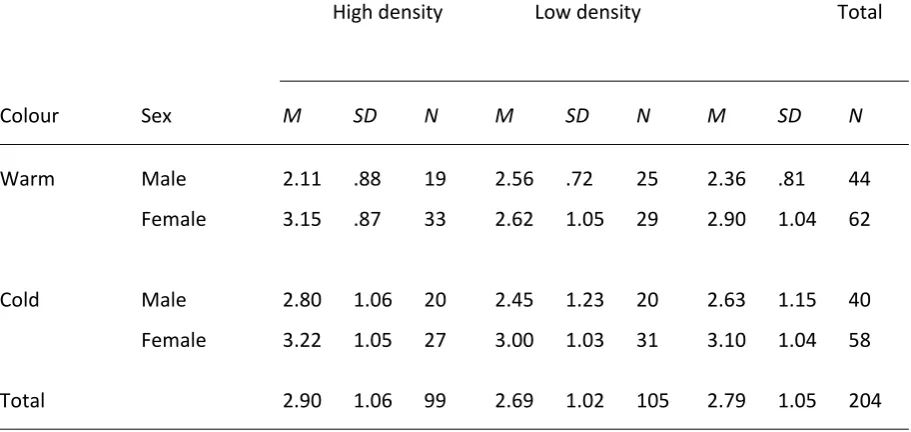
Attitude towards the shopping environment: F(1,195)=3.79, p=.053, partial eta squared=.02. The
attitude towards the shopping environment is for both men and women higher in the high density
condition. The attitude for men is higher for both low and high density conditions in combination
with cold coloured light. For women, the attitude is in the high density condition higher in
[image:20.595.69.529.234.447.2]combination with warm coloured light, but in the low density condition with cold coloured light.
Table 11. Mean scores of Attitude towards the shopping environment as a function of density (High vs. Low), colour (Warm vs. Cold) and gender (Male vs. Female)
High density Low density Total
Colour Sex M SD N M SD N M SD N
Warm Male 3.00 1.05 19 2.68 .80 25 2.82 .92 44
Female 3.79 .81 33 2.52 1.21 29 3.15 1.17 62
Cold Male 3.30 1.08 20 2.75 1.21 20 3.03 1.17 40
Female 3.30 .91 27 2.90 .91 31 3.09 .92 58
Total 3.37 .97 99 2.71 1.04 105 3.03 1.05 20
Figure 5. Three-way interaction between density, colour and gender on the attitude towards the shopping environment 0 1 2 3 4 High density Low density M al e
Attitude towards the
shopping environment
Warm Cold 0 1 2 3 4 High density Low density Fem al eAttitude towards the
shopping environment
[image:20.595.73.466.517.688.2]20
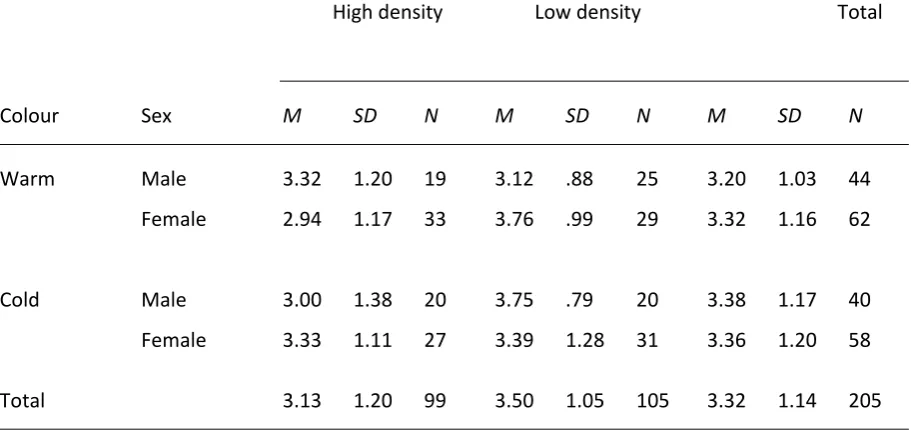
Perceived quality of the store: F(1,195)=6.79, p=.01, partial eta squared=.03. The perceived quality of
the store by men was in the high density condition higher with warm coloured lighting, but in the low
density conditions higher with cold coloured lighting. By women, the quality of the store was
perceived higher in the low density condition than in the high density condition. For the high density
condition cold light had a positive effect on the perceived quality and for the low density condition
[image:21.595.71.527.253.468.2]warm light had a positive effect on the perceived quality.
Table 12. Mean scores of Perceived quality towards the store as a function of density (High vs. Low), colour (Warm vs. Cold) and gender (Male vs. Female)
High density Low density Total
Colour Sex M SD N M SD N M SD N
Warm Male 3.32 1.20 19 3.12 .88 25 3.20 1.03 44
Female 2.94 1.17 33 3.76 .99 29 3.32 1.16 62
Cold Male 3.00 1.38 20 3.75 .79 20 3.38 1.17 40
Female 3.33 1.11 27 3.39 1.28 31 3.36 1.20 58
Total 3.13 1.20 99 3.50 1.05 105 3.32 1.14 205
Figure 6. Three-way interaction between density, colour and gender on the perceived quality of the store 0 1 2 3 4 High density Low density M al e
Perceived quality of the
store
Warm Cold 0 1 2 3 4 High density Low density Fem al ePerceived quality of the
store
[image:21.595.73.453.556.722.2]21
4. Discussion
This research attempts to give more insight into how colour and density interact and how they
influence the attitude towards the store, the shopping environment, pleasure, arousal, dominance
and approach behaviour.These two atmospheric variables have not been investigated together in
exterior store design previously.By means of this study some suggestions can be made regarding the
use of colour in crowded versus non-crowded environments in relation to gender.
Results showed that density had influence on the attitude towards the shopping environment, the
perceived quality of the store and arousal.
More people in the shopping street led to a higher evaluation of the shopping environment.
This is in line with the statement of Eroglu, Machleit and Chebat (2005) that density is a fundamental
determinant of the shopping experience. Density negatively influences perceived control (Hui &
Bateson, 1991) by restricting movement, lengthening of shopping time, presenting social
interactions etc. Because the participants had to imagine that they were in the environment of the
video, they were not actually in person limited by the density. Therefore the negative effects of the
high density were probably less prominent than the positive effects (feeling of cosiness).
The level of arousal was also higher in the crowded shopping environment. Arousal relates to
the extent to which a person feels excited or stimulated (Mehrabian & Russell, 1974). The people in
the environment (social element) are part of the environmental elements, which can increase
arousal and therefore influence the perception the shopping environment.
Moreover it was found that density affected the perceived quality of the store. The perceived
quality was higher for the low density conditions in comparison with the high density conditions. A
logical interpretation would be that a quiet environment may evoke feelings of a prestige
atmosphere, thus a higher quality and a crowded environment may evoke feelings of a discount
atmosphere, thus lower quality.
Furthermore there was a main effect for gender. Women had a more positive attitude towards the
store, felt more pleased and aroused in the shopping environment and showed a higher willingness
or desire to move towards and explore the environment than men, regardless of what condition.
These results are easily explained by the fact that, in general, women do like shopping more than
men.
However, these main effects for density and gender were qualified by the interaction between
gender, density and colour. This three-way interaction affected the attitude towards the shopping
22
For males a quiet environment (low density) along with warm coloured lighting in the shopping
window in comparison to cold coloured lighting led to more pleasure (figure 3) and a slightly higher
attitude towards the store (1) (figure 4), which partially confirms hypothesis 1. This is in contrast to
females, for whom a quiet shopping environment (low density) along with cold coloured lighting in
the shopping window in comparison to warm coloured lighting led to more pleasure (figure 3), a
higher attitude towards the store(1) (figure 4) and the environment (figure 5). For females
hypothesis 1 is thus not confirmed.
For males a crowded shopping environment (high density) with cold coloured lighting in the
shopping window in comparison to warm coloured lighting led to more pleasure (figure 3), a higher
attitude towards the store (1) (figure 4) and the shopping environment (figure 5), which partially
confirms hypothesis 2. Again this is different for females, who evaluate a crowded shopping
environment more positively than a quiet shopping environment, regardless of which colour (figure 4
and 5). Pleasure is slightly higher in the crowded shopping environment (high density) with warm
coloured lighting in the shopping window in comparison to cold coloured lighting (figure 3).
The influence of gender is probably caused by the fact that in general women like shopping more
than men. Most men indicated that they did not like shopping and most women indicated they like
shopping. It is possible that men are more utilitarian oriented and women more hedonically
oriented. Hedonic shoppers like shopping more and even see it as a social activity, while utilitarian
shoppers mainly see it as a goal oriented activity, that may last as short as possible (Babin, Darden &
Griffin, 1994). Because utilitarian shoppers see shopping as a goal oriented activity, they probably
want less arousal, while hedonic shoppers want more arousal, because they shop for fun and want to
be entertained. This could explain the fact that women evaluate the crowded shopping environment
higher (regardless of which colour), because a non-crowded environment causes too little arousal
and thus may evokes discomfort by boredome. It could also explain the fact that man evaluate the
shopping environment with moderate arousal levels higher, because the crowded environment with
warm lights probably causes too much arousal and may evoke discomfort by districting the shoppers'
goal, while the non-crowded environment with cold lights causes too less arousal, which also may
evoke discomfort, but in this situation by boredome.
What concerns the quality of the store (figure 6), by men in the crowded shopping environment the
quality is perceived higher with warm lights and by women with cold lights. In the quiet shopping
environment the quality is by men perceived more positive with cold lights and by women with warm
lights. For men, quality is perceived higher when the stimuli are congruent, while for women the
23
Maybe when women are too bored or too excited it reduces the perceived quality, while for men the
congruency of the stimuli determines the perceived quality.
Overall the three-way interaction shows that colour in combination with density has different effects
on women and men. Though it cannot be confirmed that women prefer red-purple colour
dimensions and that man prefer blue-green colour dimensions (Hulbert et al., 2006). Against the
expectation results showed no main effect for colour and no two-way interaction between density
and colour. Perhaps colour was too unconsciously processed and people focused instead more on
the mannequins in the shopping windows, the entrance of the store and/or the people in the
environment.
4.2 Limitations and implications for research
This research contributes to the field of consumer behaviour and in particular exterior store design.
Because so little is known about these variables at present this study is a first attempt to give more
insight on especially the interaction between colour and density. Though only two colours were used:
Red (warm) and blue (cold). In a next research colours between cold and warm like yellow and green
could be included. Besides there are more atmospheric variables of the exterior to investigate. For
example the shape, cleanliness of the shopping window, with or without mannequins in the shopping
window, the material of the exterior and the congruency between two or more of these atmospheric
variables. Previous research about exterior store design was limited to colour and a furniture store.
This current study focused on a fashion store, but the same type of research could be done in various
types of stores.
During the study some participants told that they experienced some questions as difficult to answer,
because they had trouble with imagining to be in the environment of the video. A longer video with
more intense sounds could help, but probably with research about exterior store design people will
always express the tendency to see the interior of the shop to form an opinion and attitude. It is
possible that in a real shopping environment this tendency will be less. However then the brand
image must be taken into account and a comparison should be made between the real shopping
environment and store with manipulations and without. This is recommended in a subsequent study.
The question in the online survey about the frequency of shopping in general could have
been better by making it more relevant to focus on clothing only.
In this research a distinction was made based on gender. A distinction between utilitarian and
hedonic shoppers might have been better, because there will always be men who do like shopping
24
Furthermore the results of this study partially support the arousal theory of Berlyne (1976) and it is
expected that the results would have supported the theory even more when the model took into
account the various orientations.
4.3 Practical Implications
On basis of the results the following can be advised: In fashion stores for men the lights can be
strategically deployed , to positively influence the attitude towards the store and pleasure, when it is
quiet by switching the lights in the shopping window into warm colours and when it is crowded into
cold colours. But if the store wants to position and distinguish itself on high quality, it is better to
have colours that are congruent with the density in the environment: Cold coloured lighting when it
is quiet and warm coloured lighting when it is crowded. In fashion stores for women the lights should
be deployed the opposite. When it is quiet the lights should be cold to positively influence the
attitude towards the environment, the attitude towards the store and pleasure and when it is
crowded the lights should be warm coloured. But when the store wants to position and distinguish
itself on high quality, it is better to have colours that are incongruent with the density in the
environment: Warm coloured lighting when it is quiet and cold coloured lighting when it is crowded.
Important to consider for implication is how many women buy clothes for their men and what is best
for fashion stores that sell both clothing for men and women. It is known that about 80% of the
people in a shopping environment are female. Therefore when a store sells clothing for both women
and men it could be smarter to focus mainly at women on the exterior of the shop.
Despite the limitations this study can definitely contribute to marketing practice. It is the first study
that actually combined density and colour on exterior store design, while density cannot be ignored
in a real environment. It is also one of the little studies in exterior store design, while, how Turley et
al. (2000) point out, it is so important since the exterior first must be considered acceptable before
25
References
Adams, F. M., & Osgood, C. E. (1973). A Cross-Cultural Study of the Affective Meanings of Colour.
Journal of Cross-Cultural Psychology, 4(2), 135.
Areni, C. S., & Kim, D. (1994). The influence of in-store lighting on consumers' examination of
merchandise in a wine store. International of Research in Marketing, 11, 117-125.
Babin, B. J. Hardesty, D. M., & Suter, T. A. (2003). Colour and shopping intentions: The intervening
effect of price fairness and perceived affect. Journal of Business Research, 56(7), 541-551.
Babin, B. J., Darden, W. R., & Griffin, M. (1994). Work and/or fun: Measuring hedonic and utilitarian
shopping value. Journal of Consumer Research, 20(4), 644-656.
Baker, J. (1986). The role of the environment in marketing services: The consumer perspective. In
John A. Czepeil, Carole A. Congram and James Shanahan (eds.), The services Challange:
Integrating for competitive advantage, Chicago, IL: American Marketing Association, 79-84.
Baker, J., & Cameron, M. (1996). The effects of the service environment on affect and consumer
perception of waiting time: An integrative review and research propositions. Journal of the
Academy of Marketing Sciences, 24, 338–349.
Baker, J., Levy, M., & Grewal, D. (1992). An experimental approach to making retail store
environmental decisions. Journal of Retailing, 68(4), 445-460.
Bellizi, J. A., Crowley, A. E., & Hasty, R. W. (1983) The effect of colour in store design. Journal of
Retailing, 59, 21-45.
Bellizzi, J. A., & Hite, R. E. (1992). Environmental colour, consumer feelings, and purchase likelihood.
Psychology & Marketing, 9(5), 347-363.
Berlyne, D. E. (1967). Arousal and reinforcement. Nebraska Symposium on Motivation,15, 1-110.
Blackwell, R. D., Miniard, P. W., & Engel, J. F. (2006). Consumer Behaviour. Mason, USA: Thomson
South-Western.
Buttle,F. (1992) Shopping motives constructionist perspective. Services Industries Journal, 12,
349-67
Campbell, C. (1997). Shopping, Pleasure and the Sex War, 166-175. In The Shopping Experience. Falk,
P., & Campbell, C. (eds). Londen: Sage
Chattopadhyay, A. , & Basu, K. (1990). Humor in advertising: The moderating role of prior brand
evaluation. Journal of Marketing research, 27, 466-476.
Dholakia, R.R., Pedersen, B. and Hikmet, N. (1995). Married males and shopping: Are they sleeping
partners? International Journal of Retail and Distribution Management, 23(3), 27-33.
Eroglu, S. A., Machleit, K. A., & Chebat, J. C. (2005). The interaction of retail density and music tempo:
26
Eroglu, S., & Harrel, G. D. (1986). Retail crowding: Theoretical and strategic implications. Journal of
Retail, 62(4), 346-363.
Gifford, R. (1988). Light, decor, arousal, comfort and communication. Journal of Environmental
Psychology, 8, 177-189.
Hui,M. K., Bateson, J. E. G. (1991). Perceived control and the effects of crowding and consumer
choice on the service experience. Journal of Consumer Research, 18, 174–184.
Hurlbert, A., Ling, Y., & Robinson, L. (2006). Sex differences in colour preference. In NJ Pitchford, CP
Biggam, (Eds). Progress in Colour Studies 2: Cognition. Amsterdam: John Benjamins.
Jacobs, K. W., & Suess, J. F. (1975). Effects of four psychological primary colours on anxiety state.
Percept Mot Skills, 41(1), 207-210.
Kotler, P. (1973). Atmospherics as a marketing tool. Journal of Retailing, 49, 48-64
Machleit, K. A., Eroglu, S. A. , & Mantel, S. P. (2000). Perceived retail crowding and shopping
satisfaction: What modifies this relationship? Journal of Consumer Psychology, 9(1), 29-42.
Matilla, A. S., Wirtz, J. (2001). Congruency of scent and music as a driver of in-store evaluations and
behaviour. Journal of Retail, 77(2), 273-289.
Mehrabian, A., & Russell, J. A. (1974). An approach to environmental psychology. Cambridge, MA:
MIT Press
Michon, R., Chebat, J. C., & Turley, L.W. (2004) Mall atmospherics: The interaction effects of the mall
environment on shopping behaviour. Journal of Business Research, 58(5), 576-583.
Miwa, Y., & Hanyu, K. (2006). The effects of interior design on communication and impressions of a
counselor in a counseling room. Journal of Environment and Behaviour, 38, 484-502.
Roberts, M.L., & Wortzel, L.H. (1979). New Life-Style Determinants of Women's Food Shopping
Behaviour. Journal of Marketing, 43(3), 28-39.
Schaninger, C.M., & Allen, C.T. (1981). Wife's Occupational Status as a Consumer Behaviour
Construct. Journal of Consumer Research, 8(2), 189-196.
Slama, M. E., & Tashchian, A. (1985). Selected socioeconomic and demographic characteristics
associated with purchase involvement. Journal of Marketing, 49, 72-82.
Summers, A.T., & Hebert, P.R (2001). Shedding some light on store atmospherics Influence of
illumination on consumer behaviour, Journal of Business Research, 54, 145-150.
Turley, L.W., & Milliman, R. E. (2000). Atmospheric effects on shopping behaviour: A review of the
experimental evidence. Journal of Business Research, 49, 193–211.
Valdez, P., & Mehrabian, A. (1994). Effects of colour on emotions. Journal of Experimental Psychology
27
Van Rompay, T. J. L., Tanja-Dijkstra, K., Verhoeven, J. W. M., & van Es, A. F. (In press). On store design
and consumer motivation: Spatial control and arousal in the retail context. Journal of
environment and Behaviour.
Van Rompay, T. J. L., Galetzka, M., Pruyn, A. T. H., & Moreno-Garcia, J. (2008).Human and spatial
dimensions of retail density: revisiting the role of perceived control. Journal of Psychology
and Marketing, 25, 319-335.
Van Rompay, T. J. L., Krooshoop, J. Verhoeven, J.W.M., & Pruyn, A. T. H. (2011). With or without you:
Interactive effects of retail density and need for affiliation on shopping pleasure and
28
Appendix A: English version of the questionnaire (PDF)
Appendix B: Dutch version of the questionnaire (PDF)