ORIGINAL RESEARCH
FUNCTIONAL
Influence of Resting-State Network on Lateralization of
Functional Connectivity in Mesial Temporal Lobe Epilepsy
L. Su, J. An, Q. Ma, S. Qiu, and D. Hu EBM
2
ABSTRACT
BACKGROUND AND PURPOSE: Although most studies on epilepsy have focused on the epileptogenic zone, epilepsy is a system-level disease characterized by aberrant neuronal synchronization among groups of neurons. Increasingly, studies have indicated that mesial temporal lobe epilepsy may be a network-level disease; however, few investigations have examined resting-state functional connectivity of the entire brain, particularly in patients with mesial temporal lobe epilepsy and hippocampal sclerosis. This study primarily investigated whole-brain resting-state functional connectivity abnormality in patients with mesial temporal lobe epilepsy and right hippocampal sclerosis during the interictal period.
MATERIALS AND METHODS: We investigated resting-state functional connectivity of 21 patients with mesial temporal lobe epilepsy with right hippocampal sclerosis and 21 neurologically healthy controls. A multivariate pattern analysis was used to identify the functional connections that most clearly differentiated patients with mesial temporal lobe epilepsy with right hippocampal sclerosis from controls.
RESULTS:Discriminative analysis of functional connections indicated that the patients with mesial temporal lobe epilepsy with right hippocampal sclerosis exhibited decreased resting-state functional connectivity within the right hemisphere and increased resting-state functional connectivity within the left hemisphere. Resting-state network analysis suggested that the internetwork connections typically obey the hemispheric lateralization trend and most of the functional connections that disturb the lateralization trend are the intranetwork ones.
CONCLUSIONS: The current findings suggest that weakening of the resting-state functional connectivity associated with the right hemisphere appears to strengthen resting-state functional connectivity on the contralateral side, which may be related to the seizure-induced damage and underlying compensatory mechanisms. Resting-state network– based analysis indicated that the compensatory mechanism among different resting-state networks may disturb the hemispheric lateralization.
ABBREVIATIONS:DMN⫽default-mode network; FC⫽functional connectivity or connection; HS⫽hippocampal sclerosis; mTLE⫽mesial temporal lobe epilepsy; R-mTLE⫽mesial temporal lobe epilepsy with right hippocampal sclerosis; RS⫽resting-state; RSN⫽resting-state network; TLE⫽temporal lobe epilepsy
U
p to 0.1% of the human population worldwide has temporal lobe epilepsy (TLE), and 60%–70% of these cases are clas-sified as mesial temporal lobe epilepsy (mTLE).1 mTLE is a drug-refractory form of human epilepsy that is typicallychar-acterized by hippocampal sclerosis (HS). Surgical intervention can prevent temporal lobe seizure recurrence in patients with mTLE.2Aberrant neuronal synchronization is believed to be as important as abnormal excitability with respect to epileptic seizure occurrences,3,4and resting-state functional connectiv-ity (RS-FC) analysis is an effective approach for examining neural synchronization.
Debilitating mTLE seizures are believed to originate pri-marily from specific anatomic divisions of the temporal lobe.2
Received October 1, 2014; accepted after revision January 25, 2015.
From the College of Mechatronics and Automation (L.S., Q.M., D.H.), National Uni-versity of Defense Technology, Changsha, Hunan, People’s Republic of China; De-partment of Medical Imaging (J.A., S.Q.), First Affiliated Hospital of Guangzhou Uni-versity of Chinese Medicine, Guangzhou, Guangdong, People’s Republic of China; and Department of Information Engineering (L.S.), Officers College of Chinese Armed Police Force, Chengdu, Sichuan, China.
This study was supported by the National Basic Research Program of China (2011CB707802, 81271389, 81471251, 91420302, and 61420106001).
Drs Longfei Su and Jie An contributed equally to this work.
Please address correspondence to Dewen Hu, PhD, No. 109, Deya Rd, Kaifu District, Changsha City, Hunan Province, People’s Republic of China; e-mail: dwhu@nudt. edu.cn; and Shijun Qiu, PhD, First Affiliated Hospital of Guangzhou University of
Chinese Medicine, 16 Airport Rd, Guangzhou, Guangdong, 510405, People’s Repub-lic of China; e-mail: [email protected]
Indicates open access to non-subscribers at www.ajnr.org Indicates article with supplemental on-line appendix and table. Indicates article with supplemental on-line photo.
EBM
However, investigations involving large-scale network analysis have challenged this traditional conceptualization.3,5-7 Fur-thermore, several studies have reported an mTLE-related de-crease in basal RS-FC in the epileptogenic hemisphere in brains of patients with mTLE, accompanied by contralateral compen-satory mechanisms.8,9
Many mTLE studies have focused on the epileptogenic zone, and most analyses that have investigated regions outside the hip-pocampus have focused on structural imaging technology.1,10,11 In contrast, few whole-brain functional network analyses of mTLE have been conducted. Structural MRI or electroencepha-lography or both incompletely measure temporal changes during the disease process,5while resting-state fMRI takes serial images during a time period that can capture the dynamic and evolving changes related to epilepsy.12The RS-FC derived from the fMRI images reflects functional aberrations and offers a network per-spective on the psychiatric and cognitive complications of mTLE.7,13We hypothesized that mesial temporal lobe epilepsy with right hippocampal sclerosis (R-mTLE) is a functional disease involving disturbances of RS-FC over the entire brain rather than a local disease that is confined to the temporal lobe. To test this hypothesis, we applied the multivariate pattern analysis method in this study.14
MATERIALS AND METHODS
Participants
We studied 21 consecutive right-handed patients with R-mTLE who underwent presurgical evaluation at Guangdong 999 Brain Hospital. Diagnoses of R-mTLE and the lateralization of the sei-zure foci of this disease were determined via comprehensive eval-uations that included examinations of the patients’ detailed medical histories, video-electroencephalography telemetry, and neuroimaging. The presence of abnormally elevated T2 fluid-at-tenuated inversion recovery signals in the hippocampus was used as the diagnostic criterion for HS. In all patients, the HS site cor-responded to the epileptogenic site. None of the patients with R-mTLE had mass lesions (tumor, vascular malformation, or malformations of cortical development) or traumatic brain in-jury. HS was detected in all patients following qualitative histo-pathologic analysis.15Twenty-one healthy right-handed subjects were recruited as controls; these controls were matched to the examined patients with R-mTLE with respect to age, sex, and years of education (Table). All controls were medically healthy and free of any neurologic or psychiatric disorders at the time of the study.
Standard Protocol Approvals, Registrations, and Patient Consents
This study was approved by the Research Ethics Review Board of the Institute of Mental Health of Southern Medical University. Informed consent was obtained from each subject.
Imaging Protocol
During the experiments, subjects were instructed to keep their eyes closed, relax, and remain awake. Subjects were asked not to perform any specific cognitive exercises. After each session, the subjects were asked whether they had fallen asleep during the preceding session, and all subjects confirmed that they had re-mained awake throughout the experiment. Functional MR im-ages were acquired by using an Intera 1.5T MR scanner (Philips Healthcare, Best, the Netherlands) with a gradient-echo EPI se-quence. We used the following imaging parameters: TR/TE⫽ 3000/50 ms; thickness/gap⫽4.5/0 mm; FOV⫽230⫻230 cm; flip angle⫽90°; matrix⫽128⫻128; sections⫽31. The duration of each functional resting-state session was approximately 8 min-utes, and 160 volumes were obtained for each patient.
Data Preprocessing
Data preprocessing was performed by using the Statistical Para-metric Mapping software package (SPM8; http://www.fil.ion. ucl.ac.uk/spm/software/spm12). For each subject, the first 10 vol-umes of scanning data were discarded to reduce magnetic satura-tion effects. The remaining 150 volumes of data were corrected by registering and reslicing for head motion. Subsequently, these volumes were normalized to standard echo-planar imaging tem-plates in Montreal Neurological Institute space. The resulting im-ages were spatially smoothed with a Gaussian filter with an 8-mm full width at half maximum kernel, detrended to remove linear trends, and temporally filtered with a Chebyshev bandpass filter (0.01– 0.08 Hz) to reduce artifacts caused by respiration or cardiac action. All fMRI volumes were registered to a Montreal Neuro-logical Institute template before further time-series extraction for ROIs. The Montreal Neurological Institute coordinates for the ROIs in this template are shown in the On-line Table. Each re-gional mean time-series was further corrected for the effects of WM, CSF, and head movement by regression on the time-series of WM, CSF signal and translations, and rotations of the head esti-mated in the course of initial movement correction by image re-alignment. The residuals of these regressions constituted the set of regional mean time-series used for functional connectivity analysis.16
The center coordinates were defined as the areas of peak activ-ity identified in 5 meta-analyses that focused on error processing, default-mode network (DMN), memory, language, and sensori-motor functions. Although these functional networks were iden-tified in task-related studies, they have been confirmed by many previous resting-state fMRI studies and were further used as rest-ing-state networks (RSNs).17-20Inevitably, using this pre-existing localization of ROIs can introduce bias; however, using a priori ROIs also offers a substantial increase in power.4
We used the Pearson correlation coefficient to evaluate the functional connectivity between each pair of ROIs. This approach allowed us to obtain symmetric 160⫻160 matrices that captured Demographic and clinical data
Mean (Range)
PValue
R-mTLE Control
Sample size 21 21 –
Sex (M/F) 9:12 9:12 1.000a
Age (yr) 28.5⫾7.9 (18–43) 25.1⫾5.7 (17–37) .187b
Education (yr) 11.6⫾2.3 (9–16) 11.5⫾2.7 (6–16) .891b
Onset (yr) 15.7⫾9.8 (2–34) – –
Duration (yr) 12.9⫾7.4 (3–33) – –
aPearson2test. b
the resting-state functional network activity of each subject. After removing the 160 diagonal elements of each functional connec-tivity matrix, we extracted the upper triangle elements of these connection matrices as classification features; therefore, the fea-ture space for classification was spanned by the remaining (160⫻ 159) / 2⫽12,720 dimensional feature vectors. In this article, the functional connections (FCs) for classification are referred to as “features.”
Alternatively, an unsampled version of the automatic ana-tomic labeling template was introduced for ROI definition, which segmented the cerebrum into 600 ROIs. Further analysis by using this template and selection of ROI radii are displayed in “ROI Definition for the Entire Brain” in the On-Line Appendix.
Identification of Features with High Discriminative Power
The support vector machine recursive feature elimination algo-rithm was originally proposed for gene selection21and has been applied in fMRI studies for the identification of multiple active voxels.22The support vector machine recursive feature elimina-tion algorithm combines the support vector machine and recursive feature elimination approaches to produce a multivari-ate feature-selection algorithm. In the support vector machine classification procedure, all samples are categorized into 2 parts. One portion of the samples with class labels was used to train the classifier, called “training samples.” The training samples can be used to identify the parameters of the classifier. All training sam-ples constructed the training set. The other portion of the samsam-ples without class labels was used to test the effectiveness of the classi-fier called “testing samples.” The classiclassi-fier can predict the class labels of the testing samples. The support vector machine classi-fication was applied to the training set, and the discriminative weightw共fi兲of featurefiwas obtained for each training sample. The scoring function was defined as follows:
Score共fi兲⫽
冘
k⫽1 n
兩wk共fi兲兩
n
In the equation above,firepresents theith feature,wk共fi兲 repre-sents the discriminative weight of featurefiin thekth sample, and
nis the number of training samples. The featuresfi,i⫽1,2, · · ·,n
were then ranked by Score共fi兲,i⫽1,2, · · ·,n, and the feature with the smallest score was eliminated. This procedure was re-peated on the retained features until all features were eliminated. To accelerate the computational process, we eliminated the half of the remaining features with the smallest scores in each iteration of the algorithm.
The details of identification of discriminative FCs are dis-played in “Cross-Validation and Consensus Functional Connec-tions” in the On-line Appendix.
Support Vector Classification and Performance Evaluation
Support Vector Classification. After the dataset of features had been prepared, linear support vector machines were used to solve the classification problem.23 All pattern analyses were
implemented by using the LIBSVM software package (http://www.csie.ntu.edu.tw/⬃cjlin/libsvm/).
Performance Evaluation. Based on the cross-validation results, the performance of a classifier was quantified in terms of the gen-eralization rate, sensitivity, and specificity.24Notably, “sensitiv-ity” represents the proportion of patients who were correctly clas-sified, and “specificity” represents the proportion of controls who were correctly classified. The overall proportion of correctly clas-sified samples was evaluated by using the generalization rate.
RESULTS
Classification Results
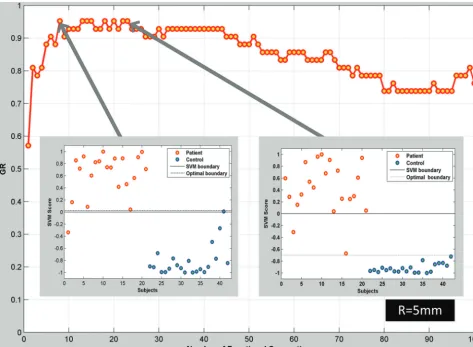
The network analysis was based on the classification results. The classification accuracy rates relative to the number of selected FCs are indicated in Fig 1. Classification accuracies (expressed in terms of the generalization rate) of⬎90% were achieved in clas-sification approaches that used relatively few (approximately 10 – 50) FCs.
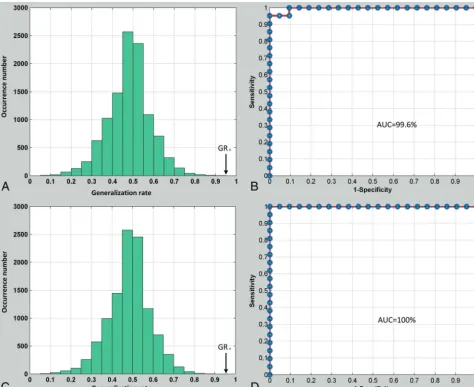
In particular, when the first 8 FCs were used, a sensitivity of 95.2% and a specificity of 95.2% were obtained (only 1 patient and 1 control participant were not successfully identified). Fur-thermore, if the support vector machine classification boundary was replaced with the optimal classification boundary, a sensitiv-ity of 95.2% and a specificsensitiv-ity of 100% were obtained (only 1 pa-tient was not successfully identified), which are reflected in Fig 2B. When the first 23 connections were used, a sensitivity of 90.5% and a specificity of 100% were obtained (only 2 patients were not successfully classified). Furthermore, if the optimal classification boundary was used, a sensitivity of 100% and a specificity of 100% were obtained (all subjects were correctly classified), which were also reflected by the receiver operating characteristic in Fig 2D.
Using the generalization rate as the applicable statistic, we de-termined the permutation distribution of estimates, which are shown in Fig 2A, -C; the results indicated that the classifier learned the relationship between the data and the labels with a⬍.0001 probability of being incorrect.
Because a leave-one-out cross-validation approach was used, the results represent estimations of the classification accuracy for the scanning results for a new subject; thus, these findings have a direct diagnostic relevance. The receiver operating characteristic curves of the classifiers, which were determined by using a leave-one-out cross-validation approach, are depicted in Fig 2B, -D. The area under the receiver operating characteristic curve for the classification method was 99.6% when 8 FCs were used and 100% when 23 FCs were used.
In the present study, each ROI was defined as a sphere with a given center coordinate and a radius of 5 mm. Radii of 4 and 7.5 mm were also used for ROI definitions, but the classification re-sults were not better than those of the radius of 5 mm, which are displayed in On-line Fig 1.
Functional Connectivity Changes
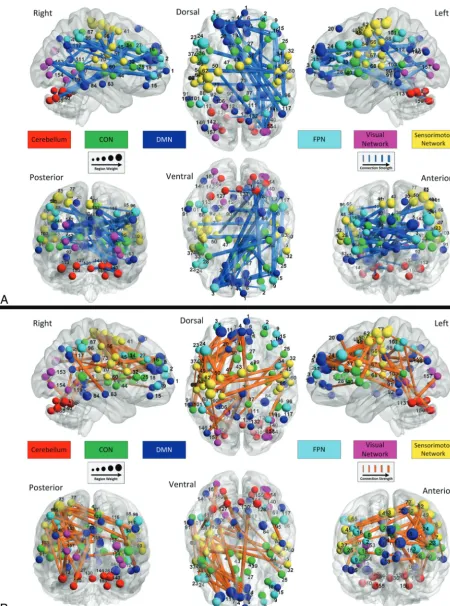
hemi-sphere (Fig 3A), and stronger connections in patients with R-mTLE relative to healthy controls were mainly distributed in the left hemisphere (Fig 3B).
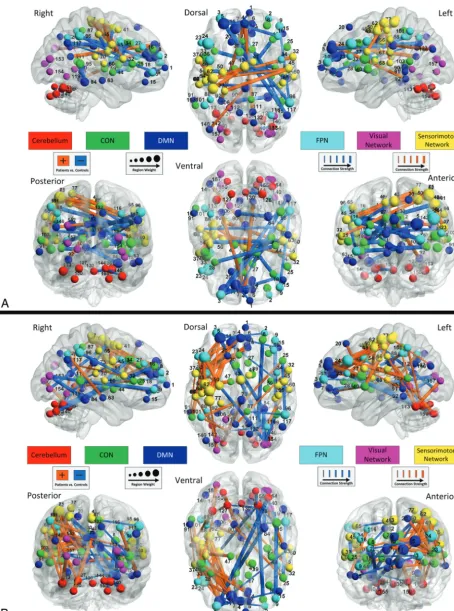
These altered FCs may be categorized as either intranetwork connections, connecting nodes within the same functional net-work; or internetwork connections, connecting nodes from 2 dif-ferent functional networks. The second finding of this study was that compared with healthy controls, patients with R-mTLE showed a different internetwork pattern compared with the intra-network connectivity changes.
Most intranetwork FCs were weaker, while more internetwork FCs were stronger in the patients with R-mTLE compared with controls (Fig 4A, -B).
DISCUSSION
In this study, we sought to validate the hypothesis that R-mTLE is a disease with RSN disturbances. Multivariate pattern analysis results indicated that R-mTLE-related changes in functional con-nectivity predominantly follow this pattern: Weaker connections were primarily distributed in the right hemisphere, while most of the stronger connections were in the left hemisphere. Additional RSN analysis demonstrated that most of the altered FCs—not strictly associated with hemispheric lateralization—were intra-network FCs; most of the FCs—which primarily obeyed the
hemi-spheric lateralization—were internetwork FCs. Specifically, weaker connections were localized within the DMN, cingulo-opercular network, and frontoparietal network, whereas stronger connections were localized within the sensorimotor network.
RSN Analysis of Brain Regions beyond the Hippocampus
To validate the hypothesis that mTLE is a network disease, some studies have investigated abnormalities in brain regions other than the hippocampus.1,6,10,11,25,26In addition, the support vec-tor classification accuracy of structural MRI and DTI datasets that exclude the hippocampus can reach approximately 90%.10Given that resting-state fMRI can capture dynamic and evolving changes related to epilepsy,12we applied RS-FC on the basis of fMRI data. Although the hippocampus is particularly important for the iden-tification of mTLE, this study sought to demonstrate that R-mTLE is a disease affecting the RSN of the entire brain rather than a local disease that is limited to hippocampal aberrations. The ROI template used in this investigation, which facilitated the RSN analysis and excluded the hippocampus, achieved classification accuracies up to 95%. This result provides important evidence that R-mTLE is a network disease characterized by functional aberrations distributed across the entire brain. In addition, we defined the epileptogenic zone through the use of a 2-samplet
[image:4.594.56.530.47.394.2]trols, and this zone was added to the ROI template. Whole-brain functional connectivity was determined on the basis of the 160⫹ 1 ROIs mentioned above. The resulting classification accuracy was not improved, and the identified discriminative connections were identical to the results presented in this article.
Identification of FCs
From a functional integration perspective, RS-FC analysis exhib-its advantages relative to other modalities,27particularly when multivariate pattern analysis methods are used.28The support vector machine recursive feature elimination method can predict group membership at an individual subject level, and the results obtained by using this method may be clinically useful29because the results can include unique information that may be over-looked by univariate voxel-based morphometry approaches.30,31 As indicated in Fig 1, maximal classification accuracy
(generaliza-tion rate⫽95.2%, area under the receiver operating characteristic curve⫽100%) was obtained by using only 23 features. We as-signed connection strengths on the basis of the occurrence of these connections in the leave-one-out cross-validation results (Fig 3). As the number of features increased beyond 23, the clas-sification accuracy generally decreased. This result suggests that only a few of the 12,720 examined connections were highly discriminative.
Different R-mTLE-Related RS-FC Changes in the Epileptogenic and Contralateral Sides of the Brain
An initial finding of this study was that changes in RS-FC in pa-tients with R-mTLE demonstrate hemispheric lateralization. Weaker FCs in patients with R-mTLE were primarily distributed in the right hemisphere (Fig 3A). However, most of the stronger FCs in the patients with R-mTLE were located in the left hemi-FIG 2. Classification evaluation.A, The permutation distribution of estimates produced by the linear support vector machine classifier (with 10,000 repetitions) if the first 8 most discriminating features are used. The x- and y-axes indicate the generalization rate and occurrence number; GR0, is the generalization rate obtained by the classifier trained on the actual class labels. Using the generalization rate as the test statistic, this
[image:5.594.56.531.47.434.2]sphere (Fig 3B). Previous studies have attributed the lateralization of RS-FC in mTLE to compensatory mechanisms in the human brain.8,9However, this conclusion was derived from RS-FC anal-yses that were restricted to the hippocampus and several other brain regions that are closely related to mTLE. Furthermore, only a small sample of patients with mTLE and even fewer patients with R-mTLE were examined in the prior studies. Our study pro-vides further support for the hypothesis that patients with mTLE demonstrate decreased functional connectivity in the epilepto-genic sides of their brains but exhibit contralateral compensatory mechanisms. First, our study focused on brain regions outside the hippocampus, thereby suggesting that the pathophysiology may be more widely distributed than previously recognized,. The weaker RS-FC in the contralateral hemisphere suggests a compen-satory mechanism that involves the entire brain. Second, previous studies have examined only a small number of patients with R-mTLE. Relative to these prior studies, our investigation included a larger number of participants with R-mTLE.
Further evidence is needed to validate the hemispheric later-alization of the RS-FC in mTLE. To validate this hemispheric lateralization, we also investigated GM and WM concentrations and the GM and WM presenting with similar hemispheric later-alizations, which are detailed in “Voxel-Based Morphometric Analysis” in the Appendix and On-line Fig 2.
RSN Analysis of R-mTLE
The second finding of the current study is that the intranetwork FCs were weakened, while the internetwork RS-FC was increased. It is generally believed that the decrease in RS-FC reflects an im-pairment in the functional network related to the corresponding RSN, while an increased RS-FC may indicate enhanced function due to the compensatory mechanism.32,33Furthermore, most of the FCs that did not conform to the observed pattern of hemi-spheric lateralization were intranetwork FCs. In contrast, most internetwork FCs followed the observed laterality patterns. This result may indicate that as functional units, the RSN and the hemisphere influence each other.
Intranetwork FCs that were weakened in patients with R-mTLE relative to control subjects were mainly localized to the DMN cingulo-opercular network and frontoparietal network. In contrast, intranetwork FCs that were strengthened in patients with R-mTLE relative to control subjects were localized to the sensorimotor network. The DMN is characterized by task-in-duced deactivation, which is essential for maintaining baseline levels of brain activities related to self-awareness, episodic mem-ory, and environmental monitoring.34In recent years, the DMN has been reported to be decreased in RS-FC and has attracted considerable attention in mTLE research.35-37Previous studies also found that the RS-FC in the frontoparietal network was de-creased in mTLE.37,38The strength of most intranetwork connec-tions in the DMN, cingulo-opercular network, and frontoparietal network was reduced in patients with R-mTLE relative to healthy controls in this study, consistent with a previous independent component analysis– based study.38This result may indicate that R-mTLE produces disturbances in executive control functions for the DMN, cingulo-opercular network, and fronto-parietal net-work, which are believed to be closely related to executive control
tasks.39-41Patients with mTLE demonstrate apparent executive deficits.42-44In previous studies, the sensorimotor network had abnormal RS-FC and the patients with mTLE displayed cogni-tive impairments.38,43,45The increased RS-FC in the sensori-motor network in the current study may be a compensatory mechanism between the left and the right sensorimotor cortex as shown in Fig 3B.
In contrast, internetwork connections between the aforemen-tioned RSNs were generally stronger in patients with R-mTLE than in control subjects. This phenomenon may have been pro-duced by compensatory mechanisms. The increased RS-FC strength reflects increased spontaneous synchronization among brain regions, and previous studies have attributed increased RS-FC in mTLE to underlying compensatory mechanisms.35 Sev-eral age-related studies have reported that the weakening of short-range connectivity and the strengthening of long-short-range connec-tivity during aging are driven by functional segregation and integration, respectively.14,46,47 In addition, a published article reported that patients with mTLE demonstrated decreased local functional connectivity and increased intrahemispheric func-tional connectivity.33However, the results obtained in our study suggest that R-mTLE induces impairments in specific functional networks and that the functional networks become more inte-grated to compensate for deficits caused by these impairments. We propose that the compensatory mechanism involves interac-tions between distinct functional units and cannot simply be as-sessed in terms of anatomic distance.
Finally, comparing Figs 3 and 4, we found that most intranet-work FCs were interhemispheric FCs, which indicates that the compensatory mechanism among different RSNs may disturb the hemispheric lateralization.
Limitations and Future Work
There were several limitations in our study. First, it examined a small sample. Our findings must be replicated with larger datasets before the findings of this investigation can be broadly generalized to patient populations with R-mTLE. Second, mesial temporal lobe epilepsy with left HS was not considered in our study. In future studies, we plan to address these limitations by conducting multimodal network analyses to investigate patients with mesial temporal lobe epilepsy with left HS and R-mTLE.
CONCLUSIONS
Based on the classification results, we found that compared with connections of the healthy controls, weakened connections of the patients with R-mTLE were primarily distributed in the right hemisphere, whereas the majority of strengthened connections were located in the left hemisphere. Additional RSN analyses demonstrated that most of the altered FCs—not strictly associ-ated with hemispheric laterality—were intranetwork FCs; most of the FCs—which tended to obey the hemispheric laterality—were internetwork FCs.
ACKNOWLEDGMENTS
Disclosures: Longfei Su—RELATED:Grant: National Natural Science Foundation of China,*Comments: National Basic Research Program of China (2011CB707802) and the National Natural Science Foundation of China (61003202, 61005084). *Money paid to the institution.
REFERENCES
1. Mueller SG, Laxer KD, Barakos J, et al.Widespread neocortical ab-normalities in temporal lobe epilepsy with and without mesial scle-rosis.Neuroimage2009;46:353–59
2. Engel J Jr.Mesial temporal lobe epilepsy: what have we learned? Neuroscientist2001;7:340 –52
3. Spencer SS.Neural networks in human epilepsy: evidence of and applications for treatment.Epilepsia2002;43:219 –27
4. Engel J, Thompson PM, Stern JM, et al.Connectomics and epilepsy. Curr Opin Neurol2013;26:186 –94
5. Maccotta L, He BJ, Snyder AZ, et al.Impaired and facilitated func-tional networks in temporal lobe epilepsy.Neuroimage Clin2013; 2:862–72
6. Voets NL, Beckmann CF, Cole DM, et al.Structural substrates for resting network disruption in temporal lobe epilepsy. Brain 2012;135:2350 –57
7. Cataldi M, Avoli M, de Villers-Sidani E.Resting state networks in temporal lobe epilepsy.Epilepsia2013;54:2048 –59
8. Bettus G, Bartolomei F, Confort-Gouny S, et al.Role of resting state functional connectivity MRI in presurgical investigation of mesial temporal lobe epilepsy. J Neurol Neurosurg Psychiatry 2010;81: 1147–54
9. Bettus G, Guedj E, Joyeux F, et al.Decreased basal fMRI functional connectivity in epileptogenic networks and contralateral compen-satory mechanisms.Hum Brain Mapp2009;30:1580 –91
10. Focke NK, Yogarajah M, Symms MR, et al.Automated MR image clas-sification in temporal lobe epilepsy.Neuroimage2012;59:356 – 62 11. Mueller SG, Laxer KD, Cashdollar N, et al.Voxel-based optimized
morphometry (VBM) of gray and white matter in temporal lobe epilepsy (TLE) with and without mesial temporal sclerosis. Epilep-sia2006;47:900 – 07
12. Richardson M.Current themes in neuroimaging of epilepsy: brain networks, dynamic phenomena, and clinical relevance.Clin Neuro-physiol2010;121:1153–75
13. Zhang Z, Liao W, Chen H, et al.Altered functional-structural cou-pling of large-scale brain networks in idiopathic generalized epi-lepsy.Brain2011;134:2912–28
14. Dosenbach NU, Nardos B, Cohen AL, et al.Prediction of individual brain maturity using fMRI.Science2010;329:1358 – 61
15. Meencke H, Veith G.Hippocampal sclerosis in epilepsy.In: Lu¨ders H, ed.Epilepsy Surgery.New York: Raven; 1991:705–15
16. Achard S, Salvador R, Whitcher B, et al.A resilient, low-frequency, small-world human brain functional network with highly con-nected association cortical hubs.J Neurosci2006;26:63–72 17. Lee MH, Smyser CD, Shimony JS.Resting-state fMRI: a review of
methods and clinical applications.AJNR Am J Neuroradiol2013; 34:1866 –72
18. van den Heuvel MP, Hulshoff Pol HE.Exploring the brain network: a review on resting-state fMRI functional connectivity.Eur Neuro-psychopharmacol2010;20:519 –34
19. Repovs G, Csernansky JG, Barch DM.Brain network connectivity in individuals with schizophrenia and their siblings.Biol Psychiatry 2011;69:967–73
20. Tedeschi G, Esposito F.Neuronal networks observed with resting state functional magnetic resonance imaging in clinical popula-tions.In: Bright P.Neuroimaging Cognitive and Clinical Neuroscience. North Logan: InTech; 2012:3
21. Guyon I.Gene selection for cancer classification using support vec-tor machines.Mach Learn2002;46:389 – 422
22. De Martino FD, Valente G, Staeren N, et al.Combining multivariate voxel selection and support vector machines for mapping and clas-sification of fMRI spatial patterns.Neuroimage2008;43:44 –58
23. Vapnik V. The Nature of Statistical Learning Theory. New York: Springer-Verlag; 1995
24. Fawcett T.An introduction to ROC analysis.Pattern Recognition Let-ters2006;27:861–74
25. Focke NK, Yogarajah M, Bonelli SB, et al.Voxel-based diffusion tensor imaging in patients with mesial temporal lobe epilepsy and hippocampal sclerosis.Neuroimage2008;40:728 –37
26. Bernhardt BC, Chen Z, He Y, et al.Graph-theoretical analysis reveals disrupted small-world organization of cortical thickness correlation networks in temporal lobe epilepsy. Cereb Cortex 2011;21:2147–57
27. Friston KJ, Frith CD.Schizophrenia: a disconnection syndrome? Clin Neurosci1995;3:89 –97
28. Shen H, Wang L, Liu Y, et al.Discriminative analysis of resting-state functional connectivity patterns of schizophrenia using low dimen-sional embedding of fMRI.Neuroimage2010;49:3110 –21 29. Gong Q, Wu Q, Scarpazz C, et al.Prognostic prediction of
therapeu-tic response in depression using high-field MR imaging. Neuroim-age2011;55:1497–503
30. Haynes JD, Rees G.Decoding mental states from brain activity in humans.Nat Rev Neurosci2006;7:523–34
31. Su L, Wang L, Chen F, et al.Sparse representation of brain aging: extracting covariance patterns from structural MRI. PloS One 2012;7:e36147
32. Zhang Z, Lu G, Zhong Y, et al.Impaired attention network in tem-poral lobe epilepsy: a resting FMRI study.Neurosci Lett2009;458: 97–101
33. Greicius MD, Flores BH, Menon V, et al.Resting-state functional connectivity in major depression: abnormally increased contribu-tions from subgenual cingulate cortex and thalamus.Biol Psychiatry 2007;62:429 –37
34. Buckner RL, Andrews-Hanna JR, Schacter DL.The brain’s default network: anatomy, function, and relevance to disease.Ann N Y Acad Sci2008;1124:1–38
35. Zhang Z, Lu G, Zhong Y, et al.Altered spontaneous neuronal activ-ity of the default-mode network in mesial temporal lobe epilepsy. Brain Res2010;1323:152– 60
36. Liao W, Zhang Z, Pan Z, et al.Default mode network abnormalities in mesial temporal lobe epilepsy: a study combining fMRI and DTI. Hum Brain Mapp2011;32:883–95
37. Zeng H, Pizarro R, Nair VA, et al.Alterations in regional homoge-neity of resting-state brain activity in mesial temporal lobe epi-lepsy.Epilepsia2013;54:658 – 66
38. Luo C, Qiu C, Guo Z, et al.Disrupted functional brain connectivity in partial epilepsy: a resting-state fMRI study. PLoS One2011; 7:e28196
39. Dosenbach NU, Fair DA, Cohen AL, et al.A dual-networks architec-ture of top-down control.Trends Cogn Sci2008;12:99 –105 40. De Pisapia N, Turatto M, Lin P, et al.Unconscious priming
instruc-tions modulate activity in default and executive networks of the human brain.Cereb Cortex2012;22:639 – 49
41. Corbetta M, Shulman GL.Control of goal-directed and stimulus-driven attention in the brain.Nat Rev Neurosci2002;3:201–15 42. Zamarian L, Trinka E, Bonatti E, et al.Executive functions in chronic
mesial temporal lobe epilepsy.Epilepsy Res Treat2011;2011:596174 43. Bell B, Lin JJ, Seidenberg M, et al.The neurobiology of cognitive disorders in temporal lobe epilepsy.Nat Rev Neurol2011;7:154 – 64 44. Keller SS, Baker G, Downes JJ, et al.Quantitative MRI of the prefron-tal cortex and executive function in patients with temporal lobe epilepsy.Epilepsy Behav2009;15:186 –95
45. Hermann BP, Lin JJ, Jones JE, et al.The emerging architecture of neuropsychological impairment in epilepsy.Neurol Clin2009;27: 881–907
46. Zuo XN, Ehmke R, Mennes M, et al.Network centrality in the hu-man functional connectome.Cereb Cortex2012;22:1862–75 47. Fair DA, Cohen AL, Power JD, et al.Functional brain networks