Assessing onsite energy usage: an explorative
study
A R T I C L E I N F O
R.M.J. Janssen (s0095834)Master Student Civil Engineering and Management at the Faculty of Engineering Technology
University of Twente, Enschede, The Netherlands
G R A D UAT I O N C O M M I T T E E
dr. ir. R.S. de Graaf (Department ofConstruction Management & Engineering, University of Twente)
dr. ir. A.G. Entrop (Department of Construction Management & Engineering, University of Twente)
ir. M.W. Florijn (Vastgoed Groep Drienerlo, University of Twente)
April 2014
A B S T R A C T
Assessment of building energy use is widely incorporated in building energy regulations, energy certification and standards. The majority of these assessments focus on a building’s operational energy and on the indirect energy embodied in building materials. However there is limited data regarding direct embodied energy during the construction stage, while due to the increased focus on lowering operational energy the relative share of embodied energy is increasing significantly. Although this growing significance is recognized, current interpretations, quantification and analysis procedures of embodied energy throughout the whole construction process are unclear and needed.
1. I N T R O D U C T I O N
The onsite construction work of residential buildings involves a variety of activities that requires the use of energy sources. Buildings, building materials and components worldwide annually consume about 30-40% of total global primary energy for construction, operation and maintenance (Asif, Muneer et al., 2007; Dixit, Fernández-Solís et al., 2012). Eurostat (2013) in their pocketbook Energy, transport and environment indicators stated that in 2011, residential buildings accounted for around 25% of the final energy consumption in the EU-28 (Eurostat, 2013). According to Bansal, Singh et al. (2014) an enormous part of this energy is consumed in construction activities alone.
There is a vast amount of methods and instruments that - within the context of sustainability assessment - consider energy usage associated with buildings (Ding, 2007; Haapio and Viitaniemi, 2008). The need to develop normative, mechanisms and protocols that enable to structure the application of energy assessment in the building sector has been long recognized (Casals, 2006; Dixit, Fernández-Solís et al., 2012). Building energy regulations, certification of energy and standards have evolved over the years and now generally include detailed assessment and methods of building energy use (Casals, 2006; Hernandez and Kenny, 2011).
However, the majority of these assessments mainly focused on a building ‘s operational energy usage (energy for heating and cooling, lighting and operating appliances (Ibn-Mohammed, Greenough et al., 2013)) without considering usage in other parts of the buildings life-cycle, such as in materials manufacturing, construction, maintenance, refurbishment and demolition (Bekker, 1982; Hernandez and Kenny, 2011; Davies, Emmitt et al., 2013). Nevertheless according to Bastos, Batterman et al. (2014) many authors have emphasized the importance of a life-cycle perspective in order to understand a building’s environmental impacts (Davies, Emmitt et al., 2013; Bastos, Batterman et al., 2014). The assessment of those environmental impacts of buildings throughout their life time is known as Life Cycle Assessment (LCA). A specific form of LCA, which assesses energy consumed by a building during its life time - in other words life cycle energy - is a technique called life cycle energy analysis (LCEA) (Fay, Treloar et al., 2000; Karimpour, Belusko et al., 2014).
Within a life cycle perspective a building‘s energy usually is differentiated into (1) embodied energy and (2) operating energy. Fay et al (2000) concluded that “studies have highlighted the importance of both operational and embodied energy attribute to buildings over their lifetime”. Although the definition and the
type of embodied energy according to Dixit et al. (2012) is subject to differences in opinion about its system boundaries and the type of energy to be included in embodied energy analysis, overall embodied energy is divided into two levels (Fay, Treloar et al., 2000; Ramesh, Prakash et al., 2010):
1. Direct (initial) embodied energy: energy consumed in onsite and offsite operations, such as construction, prefabrication, assembly, transportation and administration (including sub-contractors) (Fay, Treloar et al., 2000; Dixit, Fernández-Solís et al., 2010); 2. Indirect energy: energy embodied in manufacturing
of the building materials (initial embodied energy), energy in the material used in renovation, refurbishment (recurrent energy) and demolition processes (demolition energy) (Fay, Treloar et al., 2000; Dixit, Fernández-Solís et al., 2010).
As mentioned earlier when assessing a buildings energy usage, focus has been on its operational phase, which is covered by the second component of a building’s energy, called operational energy. Karimpour et al. (2014) started their research with the statement that “current research concludes that operational energy remains the dominant parameter and when attempting to reduce the life cycle energy of buildings, the change in embodied energy can be generally ignored”. For residential buildings “most authors conclude that operational energy represents 80-90% of total life cycle energy”(Karimpour, Belusko et al., 2014).
actual operational energy used in a building, the importance of embodied energy as a proportion of the total life cycle energy increases (Kaloumpir, 2014) and is again underscored. Decreasing both operational and embodied energy in building construction can significantly reduce the overall energy consumption and thus eventually minimize energy footprint of buildings (Bansal, Singh et al., 2014) and green house gas emissions (Haynes, 2010; Dixit, Fernández-Solís et al., 2012). However, one should not forget the proportional relationship; operational and embodied energy are strongly linked and should be considered as a balance equation (Waldron, Jones et al., 2013).
While literature thus shows a growing significance of embodied energy, current interpretations and quantification procedures of embodied energy are quite unclear (Abanda, Tah et al., 2012). Although the indirect embodied energy in building materials is studied more and more, there is limited data which supports the capture and assessment of embodied energy throughout the whole construction process (Van Ooteghem and Xu, 2012). There is a need for reliable and good quality data for energy analysis (Gama, Wamuziri et al., 2010). In addition there is the need for the development of protocols or standards to guide data analysis in (complex) construction projects that can be utilized for the calculation and analysis of embodied energy (Dixit, Fernández-Solís et al., 2012).
Within the realm of Life Cycle Energy Analysis (LCEA) and in line with current research on residential buildings, this paper explores the direct initial embodied energy usage (energy used for onsite construction activities) during one particular stage in a residential building‘s life cycle: the construction stage. Where onsite energy is usually available in the form of electricity, diesel and gasoline fuel or natural gas (Sharrard, Matthews et al., 2007) these four forms of energy create the scope of onsite energy usage in this research.
First the paper describes the method that was used for collecting and analyzing data in order to explore the quantification of the onsite energy usages. Based on that method it proposes guidelines for future research in the attempt to quantify of onsite energy usage, as suggested by Dixit et al (2012). The method used in this research was tested with a sample of building projects in
the residential sector. Evaluation of and reviewing the method created the cornerstones of the proposed guidelines for data collection. Second, after quantification of the energy usages, the paper statistically explores the onsite electricity usage of the projects in relation to four project characteristics in order to investigate its potential in assessment and comparison of ‘direct initial embodied energy’ of projects.
The quantification and analysis of onsite energy usage offers both clients and contractors potential benefits. It provides insight in the energy footprint of residential building projects and offers the possibility to assess and compare building projects (within a company or within a market) with regard to energy usage during construction and raises the opportunity to integrate it for example procurement procedures.
2. M E T H O D
Since no method, standard or protocol for the quantification and analysis of energy usages of onsite construction activities (direct initial embodied energy) existed, a three steps approach was used: (1) determination of relevant variables; (2) selection of projects; (3) data collection.
2.1 Variables of interest
For the selection of these energy usage variables and project characteristics a set of criteria was used in order to ensure a pragmatic collection process. Information on the variables and characteristics should be available and known or already collected for other purposes in archival sources. It should be able to obtain with collection at minimal cost or time investment. At last it should provide a good overview of the project.
In consultation with a user group of clients and contracting parties that are active in the residential sector, but also referring to the energy forms (Sharrard, Matthews et al., 2007) described in the introduction of this paper, onsite energy usage in this research is measured with four variables (Table 1). In addition, and required for the assessment and comparison of projects on an equal level, six basic project characteristics (Table 2) were selected. These project characteristics were also used to describe
Table 1.Onsite energy usage variables electricity usage
[kWh] diesel usage[L] gasoline usage[L] natural gas usage[m3]
(1 kWh = 3.6 MJ; 1 L diesel = 40 MJ; 1 L gasoline = 34 MJ; 1 m3 natural gas = 31.65 up to 35.17 MJ)
Table 2. Basic project characteristics construction period
the residential building projects within the sample.
The energy usages selected are the usages only due to onsite construction activities. Transportation of materials or equipment to and from the construction site was not included. That is, embodied energy of cradle to site was excluded and not within the scope of this research. Concerning the selected basic project characteristics (see Table 2) the construction period of the project was expressed in workable days, assuming that no energy was used on non-workable days. The additional five variables gross floor area, built area (the horizontal area that was covered by buildings), gross building volume, the average building height (thus assuming all buildings within a project were of similar height) and the deployment of staff in hours were selected because those according to the user group of clients and contractors were expected to represent the basic characteristics of the project.
2.2 Selecting (residential building) projects
After determining the variables of interest, a sample of residential building projects was selected. Ten contractors were asked to provide residential building projects that satisfied two criteria: (1) a project had to be recently finished in order to obtain a representative and full overview of the current situation in residential building sector; and (2) a project had to be transparent, meaning the contractors have recorded values of the characteristics and energy usages of the project. Together, the contractors provided 22 projects satisfying the selection criteria. When checking if the projects really met the criteria the sample on the criteria, unfortunately three projects had to be removed from the sample, resulting in 19 projects that seemed appropriate for data collection.
2.3. Data collection
Data on the four types of energy use of onsite construction activities as well as data on the six project characteristics was collected from archival sources of each project. Using secondary data made the study executable in terms of time and experience, but it also involved risks. Since the goal of this study was not to assess the correctness of the administration done by the contractors, it is assumed that the data from the archival source observations provide a reliable and accurate overview. Nevertheless, the usefulness of the data was critically reviewed. A data-collection-table (Appendix 1) was created to be used as the instrument for collecting the values of the variables. Feedback on this table, received from parties involved in the study, showed that it required some adjustments. Since the feedback showed some interpretation inconvenience, operational definitions of the variables were added in order to make the variables valid and measurable. By describing what was and what was not
part of the measurement, misunderstanding was minimized in order to enable a clear interpretation when collecting but also an appropriate appraisal of the study. For example the gross floor area (based on ASHRAE definition) is “The sum of the floor areas of all the spaces within the building with no deductions for floor penetrations other than atria. It is measured from the exterior faces of exterior walls or from the centerline of walls separating buildings but it excludes covered walkways, open roofed-over areas, porches and similar spaces, pipe trenches, exterior terraces or steps, roof overhangs, parking garages, surface parking, and similar features” (LEEDuser, 2014).
Using the operational definitions, the data-collecting-table was explained and instructed to its users; data collection for this study was outsourced to internship students. At each of the contractors that provided projects, an internship student did the collecting, thereby first looking for the data themselves, however when necessary with assistance from the researchers (authors). For every project a student filled out the data-collecting-table. According to the contractors involved in this study the values for the variables should be present and should be easy to transcribe. However, it appeared to be difficult to collect the data. In addition and as requested the collectors included information about used sources and unforeseen difficulties and problems, information that was very useful for the development of guidelines for future research.
3. R E S U LT S
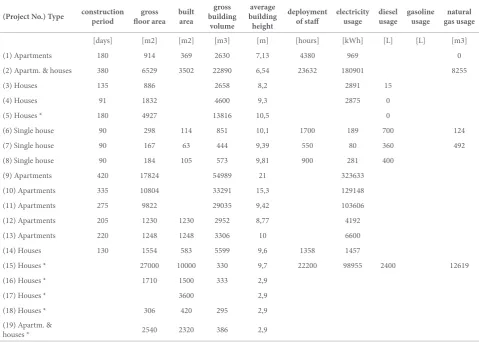
The basic project characteristics and energy usages of each residential building project found with the data collection are shown in Table 3. Apart from the variables, also some extra information was included in it to get a better idea of the projects within the sample. Because of difference, two types of residential projects were distinguished: (1) housing - or ground-orientated residential building - projects and (2) apartment projects. Looking at the differences in the values project characteristics and energy usages it can be seen that both small as large projects were part of the sample. For example the sample contains a project with a single house with a gross floor area of 167 m2, but also a project
with multiple houses and a gross floor area of 27.000 m2. Second
analysis to enable a comparison on a more or less equal level. Table 3 presents the raw data found with the data collection process. Before this data could be analyzed the raw data needed preparation.
4. A N A LY S I S
4.1. Preparation of the data for analysis
In order to explore the onsite energy usages by investigating how the four energy usage variables are associated with the six project characteristic variables, the collected data was checked for appropriateness for analysis.
Although the parties involved in the project asserted that measuring the selected variables would not be too difficult the vast amount of empty cells is remarkable when looking at Table 1. Of the 22 projects provided before data collection initiated three were removed because those did not satisfy the criterion of transparency. The data collection showed that also Project Nos. 16, 17, 18 and 19 were not appropriate for this study since no energy usages of these projects were available. In addition, it was found that Project No. 15 was still in the running and not completely finished. Therefore, also project 15 was removed from
the sample set.
After removing these non-appropriate projects, the remaining sample of 13 projects showed that of the four energy usage variables, the electricity usage was the variable that seemed most useful for analysis since it was found that no numbers on gasoline usage were available and the response on diesel- and natural gas usage was very minor. Other missing values were notably present in the results of the project characteristic variables built area, deployment of staff, natural gas and diesel usage. Checking the collected data for appropriateness resulted in removing both projects as variables from the dataset to be used for analysis and leaving four project characteristic variables and one energy usage variable.
Based on the project characteristics and backgrounds of the variables, the researcher and user group expected four directional bivariate relationships to be relevant for analysis:
A. The greater the construction period the greater the electricity usage;
[image:5.595.58.538.83.426.2]B. The greater the gross floor area the greater the electricity usage;
Table 3. Collected values of the project characteristics and energy usages of the 19 projects
(Project No.) Type construction period floor areagross built area building gross volume
average building height
deployment
of staff electricity usage diesel usage gasoline usage gas usagenatural
[days] [m2] [m2] [m3] [m] [hours] [kWh] [L] [L] [m3]
(1) Apartments 180 914 369 2630 7,13 4380 969 0
(2) Apartm. & houses 380 6529 3502 22890 6,54 23632 180901 8255
(3) Houses 135 886 2658 8,2 2891 15
(4) Houses 91 1832 4600 9,3 2875 0
(5) Houses * 180 4927 13816 10,5 0
(6) Single house 90 298 114 851 10,1 1700 189 700 124
(7) Single house 90 167 63 444 9,39 550 80 360 492
(8) Single house 90 184 105 573 9,81 900 281 400
(9) Apartments 420 17824 54989 21 323633
(10) Apartments 335 10804 33291 15,3 129148
(11) Apartments 275 9822 29035 9,42 103606
(12) Apartments 205 1230 1230 2952 8,77 4192
(13) Apartments 220 1248 1248 3306 10 6600
(14) Houses 130 1554 583 5599 9,6 1358 1457
(15) Houses * 27000 10000 330 9,7 22200 98955 2400 12619
(16) Houses * 1710 1500 333 2,9
(17) Houses * 3600 2,9
(18) Houses * 306 420 295 2,9
(19) Apartm. &
houses * 2540 2320 386 2,9
C. The greater the gross building volume the greater the electricity usage;
D. The greater the average building height the greater the electricity usage.
In these relationships the four project characteristics are the independent variables and the electricity usage is the dependent variable. Although this direction of the relationship is expected without empirical or theoretical evidence and with considerable caution about causality, it is still unlikely that for example a higher electricity usage causes a longer construction period.
4.2. Visually exploring the four relationships
After the preparation four single relationships of two variables formed the basis for further analysis. Each relationship
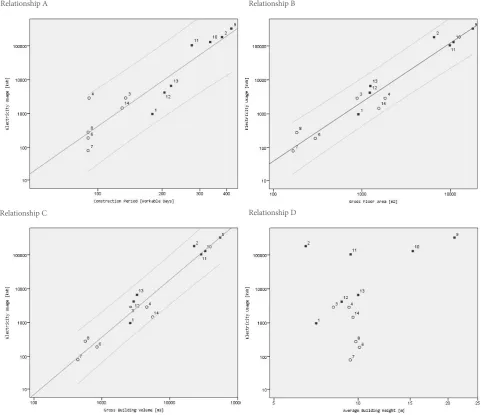
was first explored using SPSS statistics. With SPSS, scatter plots (Figure 1) were drawn in order to have a visual look on the data, the type of relationship and possible cases differing markedly from others (Field, 2009). Since both very small and very large values needed to be displayed in the graphs, instead of a linear scale a logarithmic scale was used.
[image:6.595.57.540.328.743.2]The scatter plot of relationship A suggests a more or less linear relationship (drawn with a 95% confidence interval) between construction period and electricity usage (Figure 1-A). The scatter plots of relationship B and relationship C are very alike. Figure 1-B shows a more or less linear relationship between gross floor area and electricity usage, while in Figure 1-C a very similar relationship is observed between gross building volume and electricity usage. A less obvious relationship was visible between average building height and electricity usage (See Figure 1-D). Figure 1-A, 1-B and 1-C suggest linear relationships, more
Figure 1. Scatter plots of the four single relationships on a Logaritmic scale
■ is an apartments project; ○ is a houses project
Relationship A Relationship B
specifically a positive linear correlation, meaning larger values of the project characteristic variables tend to be associated with larger values of electricity usage.
4.3. Calculating the strength of the four
relationships
Now that with scatter plots for Relationships A, B and C a visual analysis suggests the existence of a linear positive correlation while the scatter plot of relationship D suggested no visual correlation, correlation coefficients were calculated in order to determine how strong the relationships between the two variables were.
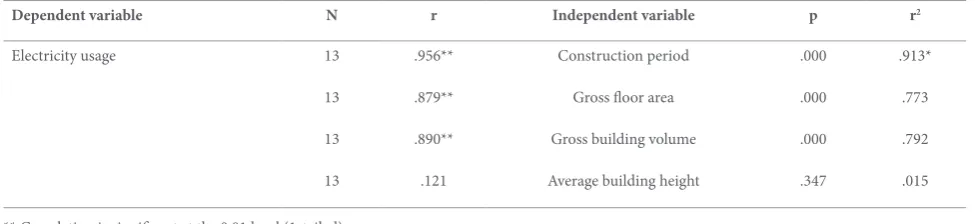
Before calculation, the data distribution of the four project characteristics and the electricity usage was investigated for normality. By examining box plots, using SPSS, it was found that the variables showed skewness and none showed a normal distribution. Knowing that the data were non-normally distributed, one of the relationships showed non-linearity and the sample size (N) is quite small, Spearman’s rho (the technique that deals with these assumptions) was selected as the appropriate correlation coefficient to be used (Field, 2009). Again using SPSS, four correlation coefficients (r) were calculated of which the result is presented in Table 4. The probability (p) of the correlations is also calculated in order to determine whether the correlation is occurring by chance. This is called the statistical significance of the correlation, in this research indicated by a probability value of less than 0.01. A one-tailed test is performed because of the expectation that the relationship exists in one direction.
With a correlation coefficient of r = 0,121 the correlation between average building height and electricity usage is very weak, which was also visible in its scatter plot. On the other hand the correlation coefficients of the other three relationships show different findings. There was a strong positive correlation between gross floor area and electricity usage (r = 0,879, p < .000) and between gross building volume and electricity usage (r =
0.890, p < .000). A very strong correlation was found between the construction period and electricity usage (r = 0,956, p < .000).
All of these three strong correlations were significant (p < .000), meaning the relationships between the variables are statistically significant. This means that the probability of this correlation occurring by chance is very close to zero, which indicates that based on the observed data the correlation coefficient of the population is not equal to zero. The fact that three positive correlation coefficients were found means that as one variable increases, the other variable increases as was expected.
The fourth measure that is included in Table 4 is called the coefficient of determination (r2), another measure for the
strength of a relationship. Although no conclusions about causality can be derived from these correlations coefficients, the coefficient of determination tells us more about the relationship. For example the coefficient of determination for the relationship between electricity usage and construction period is r2 = 0.913,
which means that 91.3 % of the total variation in electricity usage can be explained or accounted for by variation in construction period. That leaves 8.7% of the variability still to be accounted for by other variables. However while talking about accounted for by or explained by, this still does not necessarily cause this variation. So, although construction period can account for 91.3% of the variation in electricity usage, it does not necessarily cause this variation. Instead, our correlation analysis shows a relationship or association; it did not define the explanation or its basis.
4.4. Interpretation of the findings
[image:7.595.55.543.640.752.2]Without empirical or theoretical evidence a set of four directional relationships was identified as relevant for the analysis in this research. The analysis, based on the data from the sample of projects, provided empirical evidence for the existence of three of the expected relationships. As expected, the three strong positive relationships found show that the greater (in terms of
Table 4. Correlation coefficients of the four single bivariate relationships
Dependent variable N r Independent variable p r2
Electricity usage 13 .956** Construction period .000 .913*
13 .879** Gross floor area .000 .773
13 .890** Gross building volume .000 .792
13 .121 Average building height .347 .015
** Correlation is significant at the 0.01 level (1-tailed)
construction period, gross floor area and gross building volume) a project, the greater it’s electricity usage appears to be. On the other hand, based on the sample data, no relationship was found between average building height and the electricity usage. Although expected that higher buildings require more electricity (lifting materials), based on the sample, it is interpreted that the variable height alone does not show a relationship with electricity usage of a building project. As a variable on itself it might be of very minor influence, however, in combination with other variables (like gross floor area) it could be interesting for further definition of a building project’s electricity usage.
When looking at the data that was found, it was found that the sample included both small as large projects, resulting in quite some differences in the values of the project characteristic variables and the electricity usage. Since no background study was performed on each of the projects, it is hard to state whether a value found for the project characteristic variables is a very high or very low value. This also counts for the electricity usage in absolute form. However, when looking at the electricity usage per square meter gross floor area, within the sample, the average use of electricity for houses ranges from 0.5 to 3.3 kWh/m2
(11.88 MJ/m2) where for apartments it ranges from 1.1 to 18.2
kWh/m2 (65.52 MJ/m2). To get an idea on these values, it would
be interesting to put these numbers in perspective of numbers on initial embodied energy (including the energy embodied in the materials used). Unfortunately, no numbers on in specific the electricity usage or other forms of energy usage during construction phase were found.
5. C O N C LU S I O N S
The research behind this paper started with a demand to explore possible relationships between energy usages and project characteristics. Underlying this demand was the question whether these relationships would be appropriate for the assessment and comparison of energy usage for onsite construction activity of residential building projects. Literature review showed that although the assessment of building energy use is widely incorporated in building energy regulations, energy certification and standards, the majority of these assessments focus on a building’s operational energy and on the indirect energy embodied in building materials. It also showed that due to the increased focus on lowering operational energy the relative share of embodied energy is increasing significantly. Although this growing significance is recognized, very little research was available on current interpretations, quantification and analysis procedures of embodied energy in the construction stage.
Although among the contractors and researchers the expectation existed that the data required for this study was available and ready to be collected, the data collection process of this research showed different.
In order to explore the existence and appropriateness of the earlier mentioned relationships, with help of scatter plots and Spearman’s rho, three strong linear positive and significant correlations between onsite electricity usage and three basic project characteristics were identified. Based on the correlation coefficients, onsite electricity usage has a:
• very strong positive linear significant relationship with construction period in workable days (r = 0,956, p < .000);
• strong positive linear significant relationship with gross floor area (r= 0,879, p < .000);
• strong positive linear significant relationship with gross building volume (r = 0,890 , p < .000);
• weak non-linear not-significant correlation (r= 0,121 p < .347) with average building height.
• For the assessment and comparison of onsite electricity usage of projects, these correlations provide promising ground for future research.
6. D I S C U S S I O N
The data response in this research was minor and the analysis was based on a relatively small set of projects. Nevertheless some interesting and promising information could be extracted from it. While first the difficulties around the data response are discussed, the second part of this discussion reflects the investigated relationships and the appropriateness of variables.
6.1. Causality
does not tell us anything about the direction of the relationship, or which variable causes the other to change. Although intuitively unlikely or even unlogic, there is no statistical reason why a certain electricity usage cannot cause a certain construction period. Proving the causation is a major challenge without a set of rules or criteria. In general however, the more robust a correlation the more likely it is to imply causation. Therefore it is recommended to extend this study by using a larger sample in combination with methods that investigate and control of the influence of other variables on the electricity usage. Two methods suggested are partial correlation and in case of multiple regression, the detection of multicollinearity.
The finding that average building height has a weak non-linear correlation with electricity usage means that based on the sample used in this research average building height should not be used in relationship with electricity usage for assessing or comparing residential building projects.
6.2. Data collection
Although in an early stage of the research the contractors of the user group stated that the values of the energy usage and project characteristics were easy to collect, the completeness of the dataset (Table 3) showed differently. Where the first instrument for data collection was checked by parties in the field and then improved, this did not guarantee a great response: a lot of cells remained empty or in other words: values were missing. This however doesn’t mean that the response was minor. In contrast, the response of this research surfaced some interesting information. It could well be that data was just not available because it was just not recorded by the contractors. On the other hand it could also well be that the data were recorded by the contractors, but were not obtained. Concerning the collection of data or non collection of data it could be questioned whether the used data collection table was indeed appropriate and whether with the operational definitions it was valid. In addition its reliability could be questioned, meaning whether different internship students or new collectors would find the same values that were found.
6.3. Accuracy
In an early stage the user group of clients and contractors implied that data on gasoline usage, diesel usage and natural gas usage were easy to collect. However, this research showed that it was not easy to collect data considering these variables. Diesel usage was often not administered, thus contractors suggested roughly estimating that usage. Second not on all sites a natural gas
connection was present, making it hard to say how much gas was used. Regarding gasoline usage it seemed that this form of energy is seldom used and when used it was not registered accurately. Although electricity usage had the greatest response, some contractors could not provide the electricity usage a project: the usage was not always obvious since some projects were realized over multiple years and (end of year) energy bills were not yet available for the current year.
Besides these difficulties with the energy usage there were also difficulties with the project characteristic variables. It was found that the source of archival data varies quite much from automated software to a with a project involved employee. It was sometimes hard to find this involved person with the right knowledge of a project since some of the projects were finished some time ago. Initially the gross built area was selected by the parties involved in this project as a variable of interest to express an energy usage in. During collection it seemed that the gross built area was not easy to collect from archival sources. Still this variable could be interesting while in combination with the gross floor area some these two could give an idea about the size and height of buildings in a project.
At last the deployment of staff variable was very difficult. Hours of on-site personnel could be derived from administration, however hours of project managers or project planners was very hard to get since these people often work on multiple building sites. These hours are most often estimated from week to week.
Concerning accuracy (which counts for the other variables) it could be questioned whether differences between real, registered and/or collected values are of great influence on the relationships that were found with this research. Big differences might be of influence, however small differences, in for example square meters gross floor area of a large building project, are expected to have no major influence on the relationships found.
6.4. Appropriateness of the selected
variables
In addition it is also important to question the project characteristic variables that were used in this research. It might be not enough to express an energy usage in a gross floor area or in a construction period in workable days: also during non-workable days, energy could be used for example for heating or security. And, although in this research height showed no correlation with electricity usage, when constructing higher buildings, other equipment like cranes is required, cranes that might run on electricity. Expressing electricity usage in gross floor area only does not cover the fact that buildings might be one level or several. It can be questioned if a gross floor area only then is appropriate when comparing projects concerning different floor levels. In other words: Do the project characteristics provide a picture that is well representing the project? It might well be that energy usage for the construction of certain parts (e.g. a foundation) in for example a ‘row of houses project’ is substantially lower than in a ‘ detached houses’ project because ‘more work can be done at once’. But not only the type of houses, also could its design (e.g. different types of roofs, different types of walls, construction methods) be of influence. These differences are just a few examples that illustrate the difficulty of comparing building projects on energy usage.
6.4. Practice
Based on the steps of the method used in this research, the difficulties that surfaced during the data collection and other findings of this research, guidelines for future research were developed in order to assist quantification of energy usage for onsite construction activities of multiple building projects. Although it is based on a research with a sample of residential building projects, the expectation exists that it can also be used for buildings with other functions, non-residential buildings like schools, hospitals, offices, and etcetera. The variables that were used in this research are also applicable in other building projects. This does not mean the correlations that were found with this study are to be applied to other populations. The guidelines proposed will not guarantee a better response than was the case in this study, but it offers directives for further development of a method that enables quantification and analysis of onsite energy usages.
6.5. Scope
Where this research explored the energy consumed in onsite construction activities, it can be questioned whether this scope (from start of onsite activities to the actual handing over of the project) is set right and covers enough ground. It is questionable
how to cope with projects that for example have a vast amount of prefabricated elements; a lot of energy is put in the fabrication and transportation of these offsite fabricated elements, but is not covered with the scope of this research. Concerning the deployment of staff, it is also difficult how to cope with offsite hours spent on a project, or hours of transportation of staff to and from the construction site. It is also questionable whether only the energy put in the assembly and construction of the residential buildings should be considered, or also the energy put in preparing the site for construction. When wishing to cover embodied energy, it is therefore of importance to apply a life cycle perspective, covering multiple stages of a buildings life cycle.
7. R E C O M M E N DAT I O N S
7.1. Data collection
Concerning the instrument to be used for data collection it is strongly recommended to have clear and operational definitions of the variables in the instrument. The variables should be measurable and valid thus should be clearly defined including the unit it is expressed in. Concerning energy usages it should be clear that only energy on the construction site is measured. Project characteristic variables should be clear, when possible using definitions that are familiar to and registered by the contracting parties in the field of study.
Before collecting data the identification of a suitable project set is critical. The projects in the set need to be of the same building type or function (residential or non-residential; apartments or houses; etc.). Second, the projects in the set need to be completely finished since although a relationship between (e.g.) gross floor area and electricity usage was found, it is unlikely that during a project both of these variables follow a similar and linear progression. Third it is advised to investigate possible further categorization in addition to building type or function. While not proven in this research the expectation exists that for example the construction method is of influence to an energy usage. Making use of cranes or not making use of cranes makes a possible difference. Finally, it is important that the data of the projects is available. When a project is recently finished it could well be that e.g. electricity invoices are not yet processed by the energy supplier as was the case during this research.
7.2. Practice
Besides limitations and recommendations this research also gave insight in the practical application or the use of the correlations found. Now that there seems to be an association between three project characteristic variables and the electricity usage, it makes sense to use the electricity usage in combination with one of the three project characteristic variables. As a part of assessment two types of potential use are found in predicting and comparing of the onsite electricity usage of a project.
The correlations found indicate the presence of a linear relationship in the sample. It however does not indicate its nature: correlation does not guarantee causation. The strong correlations found however show that the data fit to a linear pattern. Not within the scope of this research but recommended for future investigation is to define the pattern of the relationship. Recommended is to perform a linear regression analysis in order to develop a mathematical equation for the line of best fit representing the data. That equation would enable it to calculate the electricity usage of a project based on one or more known values. Whether to use one of the project characteristic variables or to use multiple (new or project characteristic) variables is something to be investigated in future research.
7.2.1. Prediction of onsite electricity usage
with a regression equation
If future research shows that within a certain project population there is a very strong linear correlation between electricity usage and gross floor area, with help of regression analysis an equation for the best fit line could be found. For example in combination with a 95% confidence interval this equation then enables to calculate (with a 95% confidence interval) an electricity usage based on the gross floor area. That calculation can be used before onsite activities of a project initiate in order to predict its expected onsite electricity usage. One must keep in mind that here the assumption is made that all projects follow the pattern that is represented by the equation. In predicting, of the three strong correlated project characteristic variables the construction period seems less appropriate since the amount of workable days (which is known at the end) is not as certain as for example the gross floor area (which is known at the start).
7.2.2. Assessment/comparison of onsite
electricity usage with a regression equation
An equation for the best fit line can also be used after a project is finished and the onsite electricity usage of that project
is known. With the equation based on e.g. the gross floor area of that project an onsite electricity usage with a 95% confidence interval between a certain upper and lower bounds (e.g. plus or minus 20%) can be calculated that represents the projects used in the regression analysis. If those projects are considered ‘normal’ then the actual electricity usage can be compared with the calculated electricity usage. Based on those two values the onsite electricity usage of the project can be assessed and evaluated e.g. using bonus-malus. The challenge is here to investigate which projects are considered ‘normal’ and can be used as a reference project. Research is required that investigates whether projects should be grouped and if so how. For example it was interesting to see the appearance of two groups of projects in the scatter plot of electricity usage and construction period (Figure 1-A), suggesting two separate scopes and thus different equations. The data in that plot taught that all cases around the right line were apartment projects, while the cases around the left line were housing projects. This could be fortuitous but is very interesting ground for future research.
This research has investigated projects of with a size ranging from a small (a single house) to a very large project (with more than 100 units). Research will have to produce evidence if it might be more accurate to categorize projects, for example to analyze correlations for projects with a gross floor area of 50 - 250 m2, 251 - 1000 m2, etc. This does not have to result in normally
distributed variables, since projects just do differ for example in size or construction period.
Now correlations are found, projects with equal project characteristics could also be compared without equation. After finishing a project the electricity usage could be divided by (e.g.) the gross floor area in order to calculate the average kWh electricity usage per square meter gross floor area of that project. That average value (example given for the set of 13 projects in this research ranging from 0.48 to 27.71 kWh/m2), could then be
compared with one or more (or an average of) similar projects with an equal gross floor area.
7.3. Perspective
sum of the embodied energy might even increase. For example when prefabricated elements are applied in the construction, the onsite construction energy could be lower compared to when not applying prefabricated elements. Then one should not forget the amount of energy put in the production and transportation of the prefabricated materials to the site.
R E F E R E N C E S
Abanda, F. H., J. H. M. Tah, et al. (2012). “Mathematical modelling of embodied energy, greenhouse gases, waste, time–cost parameters of building projects: A review.” Building and Environment(0). Asif, M., T. Muneer, et al. (2007). “Life cycle assessment: A case study
of a dwelling home in Scotland.” Building and Environment 42(3): 1391-1394.
Bansal, D., R. Singh, et al. (2014). “Effect of construction materials on embodied energy and cost of buildings—A case study of residential houses in India up to 60 m2 of plinth area.” Energy and Buildings 69(0): 260-266.
Bastos, J., S. A. Batterman, et al. (2014). “Life-cycle energy and greenhouse gas analysis of three building types in a residential area in Lisbon.” Energy and Buildings 69(0): 344-353.
Bekker, P. C. F. (1982). “A life-cycle approach in building.” Building and Environment 17(1): 55-61.
Casals, X. G. (2006). “Analysis of building energy regulation and certification in Europe: Their role, limitations and differences.” Energy and Buildings 38(5): 381-392.
Cellura, M., F. Guarino, et al. (2014). “Energy life-cycle approach in Net zero energy buildings balance: Operation and embodied energy of an Italian case study.” Energy and Buildings 72(0): 371-381.
Davies, P. J., S. Emmitt, et al. (2013). ADDRESSING EMBODIED ENERGY FROM A CONTRACTOR’S PERSPECTIVE. Sustainable Building Conference 2013. Coventry University.
Ding, G. K. C. (2007). “Sustainable construction - The role of environmental assessment tools.” Journal of Environmental Management 86: 451-464.
Dixit, M. K., J. L. Fernández-Solís, et al. (2010). “Identification of parameters for embodied energy measurement: A literature review.” Energy and Buildings 42(8): 1238-1247.
Dixit, M. K., J. L. Fernández-Solís, et al. (2012). “Need for an embodied energy measurement protocol for buildings: A review paper.” Renewable and Sustainable Energy Reviews 16(6): 3730-3743.
Eurostat (2013). Energy, transport and environment indicators. Fay, R., G. Treloar, et al. (2000). “Life-cycle energy analysis of buildings: a
case study.” BUILDING RESEARCH & INFORMATION 28(1): 31-41.
Field, A. (2009). Discovering Statistics using SPSS, SAGE Publications Inc.
Gama, E. C. M., S. C. Wamuziri, et al. (2010). Environmental sustainability in the construction industry in developing countries: a study of embodied energy of low-cost housing. 26th Annual ARCOM Conference, Leeds, School of Engineering and the Built Environment. Haapio, A. and P. Viitaniemi (2008). “A critical review of building
environmental assessment tools.” Environmental Impact Assessment Review 28(7): 469-482.
Habert, G., E. Castillo, et al. (2012). “Power: A new paradigm for energy use in sustainable construction.” Ecological Indicators 23(0): 109-115.
Haynes, R. (2010). Embodied Energy Calculations within Life Cycle Analysis of Residential Buildings Australia.
Hernandez, P. and P. Kenny (2011). “Development of a methodology for life cycle building energy ratings.” Energy Policy 39(6): 3779-3788. Ibn-Mohammed, T., R. Greenough, et al. (2013). “Operational vs.
embodied emissions in buildings—A review of current trends.” Energy and Buildings 66(0): 232-245.
Karimpour, M., M. Belusko, et al. (2014). “Minimising the life cycle energy of buildings: Review and analysis.” Building and Environment 73(0): 106-114.
LEEDuser. (2014). 2014, from http://www.leeduser.com/glossary/ term/5599.
Moncaster, A. M. and K. E. Symons (2013). “A method and tool for ‘cradle to grave’ embodied carbon and energy impacts of UK buildings in compliance with the new TC350 standards.” Energy and Buildings 66(0): 514-523.
Ramesh, T., R. Prakash, et al. (2010). “Life cycle energy analysis of buildings: An overview.” Energy and Buildings 42(10): 1592-1600. Sharrard, A., H. Matthews, et al. (2007). “Environmental Implications of
Construction Site Energy Use and Electricity Generation.” JOURNAL OF CONSTRUCTION ENGINEERING AND MANAGEMENT. Van Ooteghem, K. and L. Xu (2012). “The life-cycle assessment of a
single-storey retail building in Canada.” Building and Environment 49(0): 212-226.
A P P E N D I X I - E X A M P L E D E S I G N O F A DATA C O L L E C T I O N I N S T R U M E N T
Data Collection Form
Project characteristics and energy usages Project:
Contractor Contact:
Data collector:
Pr
oj
ec
t C
ha
rac
ter
ist
ics
Building’s (main)function: Start of construction (month-year): Number of units built: Finish of construction (month-year): Main construction method:
Construction period (workable days): Source: Gross Project Floor Area (m2): Source:
Built Area (m2): Source:
Gross Project Volume (m3): Source:
Average Building Height (m): Source:
Deployment of Staff (hours): Source:
En
er
gy u
sa
ges Electricity usage (kWh): Source:
Diesel usage (L): Source:
Gasoline usage (L): Source: