ORIGINAL RESEARCH
BRAIN
Subcortical Deep Gray Matter Pathology in Patients with
Multiple Sclerosis Is Associated with White Matter Lesion
Burden and Atrophy but Not with Cortical Atrophy:
A Diffusion Tensor MRI Study
R. Cappellani, N. Bergsland, B. Weinstock-Guttman, C. Kennedy, E. Carl, D.P. Ramasamy, J. Hagemeier, M.G. Dwyer, F. Patti, and R. Zivadinov
ABSTRACT
BACKGROUND AND PURPOSE: The association between subcortical deep gray matter, white matter, and cortical pathology is not well understood in MS. The aim of this study was to use DTI to investigate the subcortical deep gray matter alterations and their relationship with lesion burden, white matter, and cortical atrophy in patients with MS and healthy control patients.
MATERIALS AND METHODS:A total of 210 patients with relapsing-remitting MS, 75 patients with progressive MS, and 110 healthy control patients were included in the study. DTI metrics in whole brain, normal-appearing white matter, normal-appear-ing gray matter, and subcortical deep gray matter structures were compared. The association between DTI metrics of the subcor-tical deep gray matter structures with lesion burden, normalized white matter volume, and normalized corsubcor-tical volume was investigated.
RESULTS:DTI measures were significantly different in whole brain, normal-appearing white matter, and normal-appearing gray matter among the groups (P⬍.01). Significant differences in DTI diffusivity of total subcortical deep gray matter, caudate, thalamus, and hippocampus (P⬍.001) were found. DTI diffusivity of total subcortical deep gray matter was significantly associated with normalized white matter volume (P⬍.001) and normalized cortical volume (P⫽.033) in healthy control patients. In both relapsing and progressive MS groups, the DTI subcortical deep gray matter measures were associated with the lesion burden and with normalized white matter volume (P⬍.001), but not with normalized cortical volume.
CONCLUSIONS: These findings suggest that subcortical deep gray matter abnormalities are associated with white matter lesion burden and atrophy, whereas cortical atrophy is not associated with microstructural alterations of subcortical deep gray matter structures in patients with MS.
ABBREVIATIONS:AD⫽axial diffusivity; FA⫽fractional anisotropy; HC⫽healthy control; MD⫽mean diffusivity; PMS⫽progressive MS; RD⫽radial diffusivity; RRMS⫽relapsing-remitting MS; SDGM⫽subcortical deep gray matter
A
lthough in the past MS has been considered an inflammatory demyelinating disease affecting primarily the white matter of the central nervous system, currently, a substantial number of studies have established that gray matter is also involved indiffer-ent stages of the disease.1-5Cortical and subcortical deep gray matter (SDGM) atrophy occurs also in the early stages of MS, and disability progression is significantly influenced by the neuronal loss of the gray matter.6-8
Atrophy of the SDGM structures is associated with disabil-ity progression and cognitive dysfunctions and can also predict the conversion to clinically definite MS.9-12An increasing body of evidence suggests that the atrophy of cortical and SDGM structures is associated with white matter lesion burden,13but the underlying pathophysiologic processes remain poorly understood. Secondary Wallerian degeneration is certainly im-plicated in neuronal damage of gray matter structures; how-ever, it seems unlikely to be the sole cause of gray matter pathology.4,14
DTI is an advanced MR imaging technique that has been used in a number of in vivo and ex vivo studies.15,16DTI measures are Received July 26, 2013; accepted after revision September 18.
From the Buffalo Neuroimaging Analysis Center (R.C., N.B., C.K., E.C., D.P.R., J.H., M.G.D., R.Z.), and Jacobs Neurological Institute, Department of Neurology (B.W.-G., R.Z.), State University of New York, Buffalo, New York; and Depart-ment GF Ingrassia, Section of Neurosciences (R.C., F.P.), University of Catania, Catania, Italy.
Please address correspondence to Robert Zivadinov, MD, PhD, FAAN, Depart-ment of Neurology, School of Medicine and Biomedical Sciences, The Jacobs Neurological Institute, 100 High St, Buffalo, NY 14203; e-mail: rzivadinov@ bnac.net
Indicates open access to non-subscribers at www.ajnr.org
Indicates article with supplemental on-line tables.
able to identify alterations outside the focal lesions in the so-called normal-appearing white matter and normal-appearing gray mat-ter that remain largely undetected with conventional MR imaging in patients with MS.17
There is a growing interest in studying the DTI alterations of the SDGM in the different stages of the MS disease process. Pre-vious studies suggested that SDGM DTI abnormalities are also present in patients with clinically isolated syndrome18,19and are associated with disability progression as well as cognitive dysfunc-tions in patients with MS.20-23
Although different studies have investigated the associations between white matter lesions, brain atrophy, and DTI alteration in patients with MS,24-26the same relationships were not exten-sively investigated in healthy people whose pathophysiologic al-teration of the brain cannot be attributable to the inflammatory process in the central nervous system. Therefore, in the current study, we aimed to investigate volumetric and DTI global, tissue-specific, and regional brain differences in a large cohort of healthy control (HC) patients, patients with relapsing-remitting MS (RRMS), and patients with progressive MS (PMS). We hypothe-sized that microstructural abnormalities of SDGM structures de-tected by DTI techniques are associated with lesion burden, and with white matter and gray matter volume alterations in patients with MS. Another aim was to explore the same associations in the HC group.
MATERIALS AND METHODS
Patients
A total of 285 patients with MS according to the McDonald crite-ria27and 110 HC patients were recruited and underwent scanning by use of the same MR imaging protocol. They were classified as having RRMS, secondary-progressive MS, and primary-progres-sive MS. Participants were excluded if they had contraindications to MR imaging, had any pre-existing medical conditions known to be associated with brain pathology, had relapse (patients with MS), or were treated with steroids within the month preceding study entry. All patients underwent neurologic examination, and an Expanded Disability Status Scale assessment was obtained by an examiner blinded to their MR imaging characteristics. All HC patients also underwent both neurologic and clinical examina-tions. Moreover, we collected previous medical history, demo-graphic, and physical data to evaluate the vascular risk factors. The internal Institutional Review Board approved the study pro-tocol, and written informed consent was obtained from all participants.
MR Imaging Acquisition
All patients were examined on a 3T Signa Excite HD 12.0 Twin Speed 8-channel scanner (GE Healthcare, Milwaukee, Wiscon-sin) by use of an 8-channel head and neck coil. MR imaging se-quences included multiplanar dual FSE proton attenuation and T2WI, FLAIR, 3D T1WI by use of a fast-spoiled gradient echo with magnetization-prepared inversion recovery pulse and spin-echo T1WI both with and without a single dose of an intravenous bolus of 0.1 mMol/kg of gadolinium with diethylene triamine pentaacetic acid. Pulse sequence characteristics for 3T MR imag-ing were as follows: All scans were acquired with a 256⫻256
matrix and a 25.6-cm FOV for an in-plane resolution of 1⫻1 mm2with a phase FOV of 75% and 1 average. Sequence specific parameters were as follows: for the proton attenuation/T2: 3-mm-thick sections with no gap; TE1, 12 ms; TE2, 95 ms; TR, 3000 ms; echo-train length, 14; flip angle, 90°; for the FLAIR scans: 3-mm thick sections with no gap; TE, 120 ms; TI, 2100 ms; TR, 8500 ms; flip angle, 90°; for 3D T1WI: 1-mm thick sections with no gap; TE, 2.8 ms; TI, 900 ms; TR, 5.9 ms; flip angle, 10°; and for spin-echo T1WI: 3-mm-thick sections with no gap; TE, 16 ms; TR, 600 ms; flip angle, 90°.
An echo-planar DTI sequence was acquired as part of the MR imaging protocol. The sequence was acquired with 3-mm-thick sections with no gap, a 96⫻96 matrix, a 32-cm FOV, and a 75% phase FOV, resulting in a voxel size of 3.33 mm⫻3.33 mm⫻3.00 mm. The sequence used a TE of 81.8 ms, TR of 8200 ms, 1 average, and an array spatial sensitivity encoding technique (parallel im-aging) factor of 2. DTI parameters were 15 noncollinear direc-tions with a b-value of 800 s/mm2.
MR Imaging Analysis
Initial DTI processing was performed by use of the FMRIB Diffu-sion Toolbox (FSL; http://www.fmrib.ox.ac.uk/fsl).28,29In brief, raw diffusion tensor images were eddy corrected to minimize gra-dient-related geometric distortions. Then, “dtifit” was used to fit a tensor model at each voxel, and scalar maps of fractional anisot-ropy (FA), mean diffusivity (MD), radial diffusivity (RD), and axial diffusivity (AD) were created. Subsequently, these maps were coregistered and resampled into the high-resolution 3D T1WI space by use of the B0 image as a reference. In this space, tissue segmentation and parcellation data were overlaid, and summary measures for each DTI metric were calculated on a re-gion-by-region basis. The FSL registration tool FLIRT (http:// www.fmrib.ox.ac.uk/) was used with nearest-neighbor interpola-tion to bring the FIRST (version 1.2; http://fsl.fmrib.ox.ac.uk/fsl/ fslwiki/FIRST) masks and DWI data into a common space.
The SIENAX Cross-Sectional Software Tool (version 2.6; http://fsl.fmrib.ox.ac.uk/fsl/fslwiki/SIENA) was used to estimate normalized gray matter volume, normalized white matter vol-ume, normalized brain parenchymal volvol-ume, normalized lateral ventricular volume, and normalized cortical volume. Before seg-mentation, the 3D T1WI was modified by use of an in-house developed inpainting tool to avoid the impact of T1 hypointensi-ties.2To segment SDGM structures, the FIRST tool on 3D T1WI was used. Specifically, the thalamus, caudate, putamen, globus pallidus, hippocampus, amygdala, and accumbens nucleus were identified in this way.
T2-weighted hyperintense and T1-weighted hypointense pre-contrast and postpre-contrast lesion volume were assessed by use of a semiautomated edge detection contouring/thresholding tech-nique.2T2 lesions were delineated on FLAIR images and were confirmed on proton attenuation and T2 images. T1-hypointense lesions were delineated on T1-spin-echo images, and T1-Gd le-sions were delineated on postcontrast T1-spin-echo images.
Statistical Analysis
tested for normality by use of the Shapiro-Wilk test. Demo-graphic, clinical, and MR imaging differences between the groups were tested by use of the2test, the Studentttest, and the Mann-WhitneyUtest in pair-wise comparisons, and ANOVA and the Kruskal-Wallis test for 3-way analyses, where appropriate.
We also performed linear regression analysis to evaluate the relationships between DTI variables and MR imaging metrics. In each analysis, DTI variables were the dependent variable. The analyses were age and sex adjusted in the HC group, and age, sex, disability level, and disease duration adjusted in the MS groups.
AllPvalues were corrected for multiple comparisons by use of Benjamini-Hochberg correction. NominalPvalues⬍.05 were regarded as significant, by 2-tailed testing.30
RESULTS
Demographic, Clinical, and Conventional MR Imaging Characteristics
Demographic, clinical, and conventional MR imaging character-istics of HC patients and patients with MS are shown in Table 1. Patients did not significantly differ from the HC group in sex, age, or cardiovascular risk factors. The mean age of the patients with MS was 46.9 years (standard deviation, 8.2), 206 (72.3%) were women, the mean disease duration was 14.4 years (standard
deviation, 9.1), and median Expanded Disability Status Scale score was 3.0. Of the 285 patients with MS in the study, 225 were receiving disease-modifying treat-ment, which included interferon-beta (n⫽94), glatiramer acetate (n⫽59), na-talizumab (n⫽44), intravenous immu-noglobulin (n ⫽ 4), and combination therapy (n⫽24).
Demographic, clinical, and MR imag-ing characteristics were also compared between 210 patients with RRMS and 75 patients with progressive MS. The pro-gressive MS group consisted of 58 patients with secondary-progressive MS and 17 with primary-progressive MS. As ex-pected, the mean age, disease duration, Expanded Disability Status Scale score, and MR imaging measures were signifi-cantly different between the RRMS and PMS groups.
As expected, patients with MS showed significantly increased T2 lesion volume compared with HC patients (P⬍.001, Table 1). Patients with PMS showed significantly increased T2 lesion volume (P⫽.001) and T1 lesion volume (P⫽.037) compared with those in the RRMS group, whereas the RRMS group presented with signifi-cantly increased T1 gadolinium lesion volume (P⫽.046).
Brain Volume Differences among Study Groups
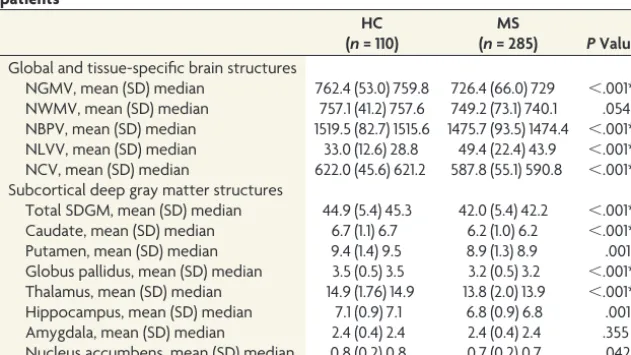
Table 2 shows the differences between HC patients and patients with MS in global, tissue-specific, and regional brain volume structures. Global and tissue-specific brain volumetric assessment showed a significant decrease of normalized gray matter volume, normalized brain parenchymal volume, normalized cortical vol-ume, and a significant increase of normalized lateral ventricular volume (allP⬍.001) in the MS group. These patients also showed decreased total SDGM, caudate, globus pallidus, thalamus (all P⬍.001), putamen and hippocampus (bothP⫽.001), and nu-cleus accumbens (P⫽.042). This is referenced in On-line Tables 1 and 2.
Differences in DTI Measures among the Study Groups
DTI differences are shown in Table 3. DTI FA, MD, AD, and RD differences in global and tissue-specific brain structures were in-Table 1: Demographic, clinical, and conventional MRI characteristics of healthy control patients and patients with MS
HC (n= 110) MS (n =285) RRMS (n =210) PMS (n =75) PValue
Age (y), mean (SD) median 47.0 (12.9) 50 46.9 (8.2) 48 0.965 46.1 (8.5) 46 49.2 (6.5) 50 .006*
Sex, female, n (%) 76 (69.1) 206 (72.3) 0.329 149 (70.9) 57 (78) .496
Disease duration (y), mean (SD) median NA 14.4 (9.1) 13 13.2 (8.8) 12 17.9 (9.2) 18 ⬍.001*
EDSS, mean (SD) median NA 3.4 (1.9) 3.0 2.6 (1.5) 2.5 5.4 (1.5) 6.0 ⬍.001*
T2-LV, mean (SD) median 0.3 (1.2) 0 13.5 (16.1) 7.3 ⬍.001* 11.0 (13.5) 6.7 20.4 (20.4) 13.2 .001*
T1-LV, mean (SD) median 0 3.3 (6.5) 1.0 NA 2.7 (6.1) 0.8 5.1 (7.2) 1.7 .037*
T1-Gd-LV mean (SD) median NA 0.05 (0.02) 0 NA 0.06 (0.4) 0 0.01 (0.02) 0 .046*
Note:—EDSS indicates Expanded Disability Status Scale; LV, lesion volume; NA, not available; SD, standard deviation. Statistical analysis among groups was performed with the Studentttest, test, the Mann-WhitneyUtest and the2
test. AllPvalues were corrected for multiple comparisons with use of Benjamini-Hochberg correction.
The volumes are expressed in milliliters.
[image:3.594.55.533.57.142.2]* indicates significantPvalues (P⬍.05) after correction.
Table 2: Structural brain volume measures in patients with MS and healthy control patients
HC (n= 110)
MS
(n= 285) PValue
Global and tissue-specific brain structures
NGMV, mean (SD) median 762.4 (53.0) 759.8 726.4 (66.0) 729 ⬍.001* NWMV, mean (SD) median 757.1 (41.2) 757.6 749.2 (73.1) 740.1 .054 NBPV, mean (SD) median 1519.5 (82.7) 1515.6 1475.7 (93.5) 1474.4 ⬍.001* NLVV, mean (SD) median 33.0 (12.6) 28.8 49.4 (22.4) 43.9 ⬍.001* NCV, mean (SD) median 622.0 (45.6) 621.2 587.8 (55.1) 590.8 ⬍.001* Subcortical deep gray matter structures
Total SDGM, mean (SD) median 44.9 (5.4) 45.3 42.0 (5.4) 42.2 ⬍.001* Caudate, mean (SD) median 6.7 (1.1) 6.7 6.2 (1.0) 6.2 ⬍.001* Putamen, mean (SD) median 9.4 (1.4) 9.5 8.9 (1.3) 8.9 .001* Globus pallidus, mean (SD) median 3.5 (0.5) 3.5 3.2 (0.5) 3.2 ⬍.001* Thalamus, mean (SD) median 14.9 (1.76) 14.9 13.8 (2.0) 13.9 ⬍.001* Hippocampus, mean (SD) median 7.1 (0.9) 7.1 6.8 (0.9) 6.8 .001* Amygdala, mean (SD) median 2.4 (0.4) 2.4 2.4 (0.4) 2.4 .355 Nucleus accumbens, mean (SD) median 0.8 (0.2) 0.8 0.7 (0.2) 0.7 .042*
Note:—NBPV indicates normalized brain parenchymal volume; NCV, normalized cortical volume; NGMV, normalized gray matter volume; NLVV, normalized lateral ventricular volume; NWMV, normalized white matter volume. Statistical analysis between groups was performed with use of the Mann-Whitney test for nonparametric data and the Studentttest for parametric data. AllPvalues were corrected for multiple comparisons using Benjamini-Hochberg correction.
The volumes are expressed in milliliters.
[image:3.594.54.370.213.390.2]vestigated among the HC, RRMS, and PMS groups. Significant differences were found in FA, MD, and RD in the global brain measures (P⬍.01), particularly in the normal-appearing brain tissue FA (P⬍.001), normal-appearing white matter FA (P⬍ .001), normal-appearing brain tissue RD (P⫽.001), and normal-appearing white matter RD (P⬍.001). Only the normal-appear-ing gray matter AD was significantly different (P⫽.011) among the groups.
The DTI MD, AD, and RD measures for total SDGM, caudate, thalamus, and hippocampus were significantly increased (P ⬍ .001) in patients with MS. FA was significantly decreased only in the thalamus (P⫽.002) and hippocampus (P⫽.047), and it was increased in the putamen (P⫽.025) and nucleus accumbens (P⫽ .006).
Linear Regression between SDGM DTI and MR Imaging Measures
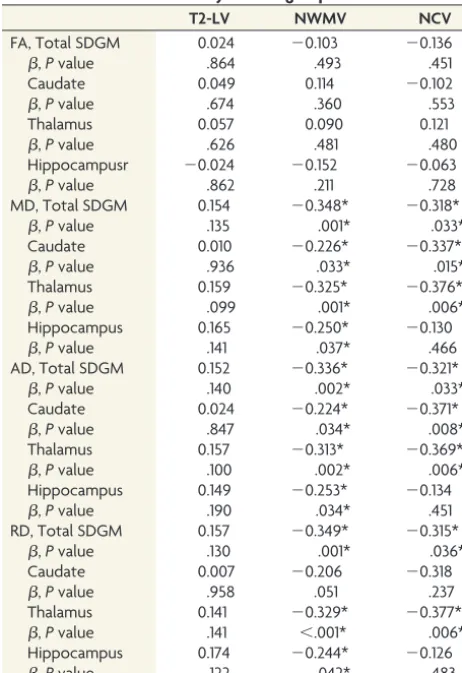
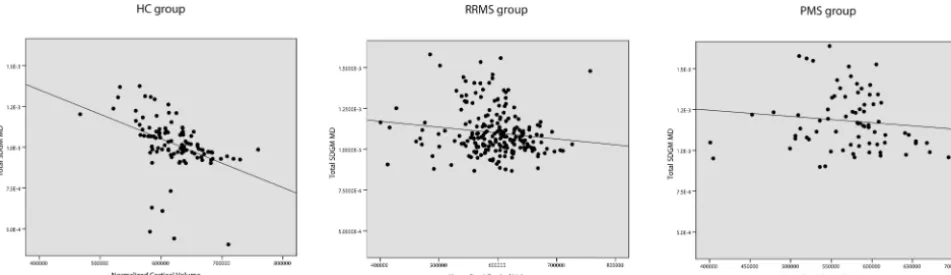
Linear regression analysis included only DTI variables of SDGM regions, which were significantly different among the 3 study groups from the ANOVA analyses. Associations of these signifi-cant SDGM DTI measures were then used to find associations with lesion volume, normalized white matter volume, and nor-malized cortical volume. The associations between SDGM DTI measures and MR imaging metrics in HCs are described in Table 3 and Figs 1–3. Significant associations were identified between the MD, AD, and RD of SDGM structures but not FA, and a decrease in normalized white matter volume (P⬍.001) and nor-malized cortical volume (P⫽.033) with the exception of hip-pocampus. No significant associations were detected between DTI measures and T2 lesion volume.
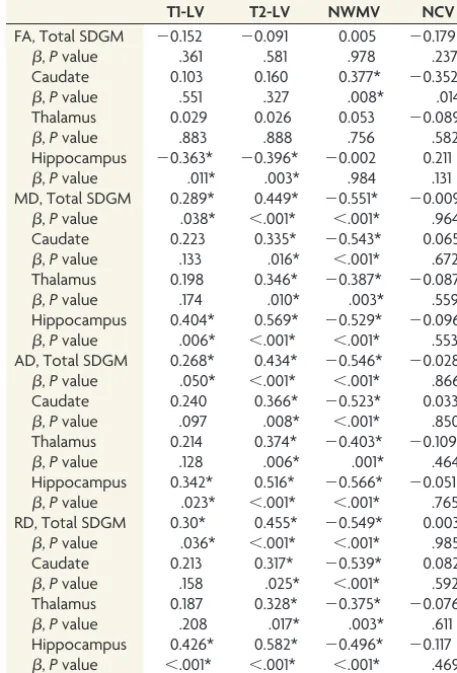
Linear regression analysis in the RRMS and PMS groups is shown in Tables 4 and 5 as well as Figs 1–3, respectively. Increased MD, AD, and RD variables were strongly associated with de-creased normalized white matter volume in the RRMS and PMS groups (allP⬍.001), but no significance was detected for the normalized cortical volume. The FA showed fewer significant re-sults. T1 lesion volume and T2 lesion volume were associated with most of the examined SDGM structure DTI measures.
DISCUSSION
Understanding the pathophysiology of gray matter degeneration and the relationship between focal lesions and distant tissue alter-ations in the gray matter is important to determine the right treat-ment strategies that can prevent clinical progression in patients with MS. It has been shown that development of gray matter pathology is associated with the progression of physical and cognitive disability in both cross-sectional and longitudinal studies.1-4,8-12,20,31
In this study, we used DTI on 3T MR imaging to investigate structural brain changes in a large cohort of HC patients and patients with MS. Then, we focused on the SDGM structures to
[image:4.594.53.284.173.509.2]FIG 1. Linear regression analysis between MD of total SDGM and T2 lesion volume in HC patients (⫽0.154,P⫽.135), patients with RRMS (⫽ 0.206,P⫽.015), and in patients with PMS (⫽0.449,P⬍.001).
Table 3: Linear regression analysis including diffusion tensor imaging measures, T2 lesion burden, and white matter and cortical volumes in the healthy control group
T2-LV NWMV NCV
FA, Total SDGM 0.024 ⫺0.103 ⫺0.136
,Pvalue .864 .493 .451
Caudate 0.049 0.114 ⫺0.102
,Pvalue .674 .360 .553
Thalamus 0.057 0.090 0.121
,Pvalue .626 .481 .480
Hippocampusr ⫺0.024 ⫺0.152 ⫺0.063
,Pvalue .862 .211 .728
MD, Total SDGM 0.154 ⫺0.348* ⫺0.318*
,Pvalue .135 .001* .033*
Caudate 0.010 ⫺0.226* ⫺0.337*
,Pvalue .936 .033* .015*
Thalamus 0.159 ⫺0.325* ⫺0.376*
,Pvalue .099 .001* .006*
Hippocampus 0.165 ⫺0.250* ⫺0.130
,Pvalue .141 .037* .466
AD, Total SDGM 0.152 ⫺0.336* ⫺0.321*
,Pvalue .140 .002* .033*
Caudate 0.024 ⫺0.224* ⫺0.371*
,Pvalue .847 .034* .008*
Thalamus 0.157 ⫺0.313* ⫺0.369*
,Pvalue .100 .002* .006*
Hippocampus 0.149 ⫺0.253* ⫺0.134
,Pvalue .190 .034* .451
RD, Total SDGM 0.157 ⫺0.349* ⫺0.315*
,Pvalue .130 .001* .036*
Caudate 0.007 ⫺0.206 ⫺0.318
,Pvalue .958 .051 .237
Thalamus 0.141 ⫺0.329* ⫺0.377*
,Pvalue .141 ⬍.001* .006*
Hippocampus 0.174 ⫺0.244* ⫺0.126
,Pvalue .122 .042* .483
Note:—NCV indicates normalized cortical volume; NWMV, normalized white matter volume; T2-LV, T2 lesion volume.
[image:4.594.59.532.570.706.2]investigate the association between their DTI alterations and le-sion burden, white matter, and cortical atrophy among the study groups. To better evaluate the microstructural damage of SDGM structures, we studied the diffusivity in the axial and radial direc-tions to detect differences that may be underestimated by the MD measures. The findings confirmed that brain gray matter is not spared by the MS pathologic process.3We found widespread DTI alterations in the global and tissue-specific brain structures among patients in the RRMS and PMS groups. In agreement with previous studies, the FA, MD, and RD were found to be signifi-cantly different in the appearing brain tissue, normal-appearing white matter, and normal-normal-appearing gray matter.32-34 In line with another study,35the AD was significantly different in the normal-appearing gray matter but not in the normal-appear-ing white matter or the normal-appearnormal-appear-ing brain tissue. In accor-dance with a prior study, normal-appearing white matter MD was increased and was dominated by increased RD with no significant change in AD among the 3 groups.36Also, in alignment with the results from previous studies,21,23we detected a significant in-crease of MD, AD, and RD in the total SDGM, caudate, thalamus, and hippocampus in patients with RRMS and particularly in pa-tients with PMS. FA was significantly decreased in the thalamus and hippocampus of patients with MS as reported previously21,37 and significantly increased in the putamen and nucleus accum-bens. Despite the extensive investigation of DTI abnormalities in the thalamus and other SDGM structures, FA has limitations in the study of gray matter structures; therefore, anisotropic findings remain conflicting.38-40Our present study supports results from
previous studies, which point toward the thalamus as one of the most affected SDGM structures.21,37
A significant issue to be clarified is related to the pathophysi-ology of the SDGM involvement and its associations with inflam-matory and degenerative pathology. The inflaminflam-matory process seems to be an important contributor to the atrophy of gray mat-ter, and previous studies have already established the spatial and temporal relationship between T2 lesion burden and gray matter volume loss.13,26The main objective of this study was to further investigate this issue, which included a large cohort of HC patients and patients with MS. To the best of our knowledge, this has not been previously studied in the HC patients. Our results suggest that lesion burden is related to SDGM diffusivity in patients with MS and particularly in the progressive type, where we found mod-est associations. However, at bmod-est, these associations explained 25%–30% of the variance. In support of this, other studies showed that an increase in thalamic DTI diffusivity and in myo-Inositol also correlated with T2 lesion volume in patients with MS.23On the contrary, we did not detect a significant correlation among SDGM DTI measures and lesion burden in the HC group, as expected. These results support the hypothesis that the structural damage of white matter connections could lead to trans-synaptic axonal degeneration and retrograde degeneration of neurons with alteration of the microstructural architecture of SDGM structures.
To better understand the differences in SDGM DTI abnormal-ities between patients with MS and HC patients, we investigated the relationship between white matter and cortical atrophy, to FIG 2. Linear regression analysis between MD of total SDGM and normalized white matter volume in HC patients (⫽ ⫺0.348,P⫽.001), patients with RRMS (⫽ ⫺0.415,P⬍.001), and patients with PMS (⫽ ⫺0.551,P⬍.001).
[image:5.594.57.533.52.183.2] [image:5.594.56.532.222.359.2]evaluate if the DTI alterations are also associated with atrophy in these structures. Some studies have recently demonstrated that thalamic DTI alterations are related to aging in HC patients.41,42 Linear regression analysis in the present study, adjusted for age and sex, demonstrated significant associations among increased diffusivity of the SDGM structures and white matter and cortical atrophy in the HC group. Indeed, these are important findings that have not been previously reported in healthy patients. These findings suggest that neuronal and axonal loss leading to white matter and cortical atrophy is modestly related to microstructural changes of the SDGM in HC patients. In contrast, we found SDGM DTI diffusivity associations with white matter atrophy in MS groups but not with cortical atrophy. DTI alterations of the SDGM structures seem to be more influenced by degeneration of the white matter network exemplified by accumulation of le-sion burden, but not by the neuronal loss of the cortical gray matter. A previous study also did not detect a relationship between normal-appearing gray matter diffusivity changes and gray matter volume.43 Taken together, these results suggest that SDGM DTI alterations are not associated with gray matter atrophy.
Although we detected uniformly consistent associations in
re-gression analyses for MD, AD, and RD measures, those for FA measures were not particularly consistent in both groups.
A limitation of our current study concerns the absence of lon-gitudinal investigations that could better explain the relationship among accumulation of lesion burden, development of white matter, and cortical and DTI alterations of the SDGM in patients with MS and in healthy patients. In addition, we performed DTI acquisition with larger voxel sizes that could lead to some poten-tial bias of acquisition data of the normal-appearing gray matter measures, especially in the cortical structures with a thickness⬍3 mm. Moreover, we did not investigate clinical correlation with DTI measures, as these were considered out of the current scope of our study. However, our present study confirmed that SDGM DTI alterations were present in different MS clinical phenotypes of the disease and were more pronounced in pa-tients with PMS.
CONCLUSIONS
[image:6.594.53.286.72.408.2]DTI alterations of the SDGM in patients with MS are related to white matter lesion burden and atrophy but not to cortical atro-phy. On the contrary, there was an association of SDGM DTI metrics with white matter and cortical atrophy in the HC group. Table 4: Linear regression analysis including diffusion tensor
imaging measures, T2 lesion burden, white matter, and cortical volumes in relapsing-remitting MS
T1-LV T2-LV NWMV NCV
FA, Total SDGM ⫺0.180 ⫺0.094 0.096 0.221*
,Pvalue .052 .331 .273 .013*
Caudate ⫺0.118 0.056 0.291* ⫺0.147
,Pvalue 0.230 0.583 0.001* 0.120
Thalamus ⫺0.130 0.068 0.101 0.176
,Pvalue .177 .496 .250 .054
Hippocampus ⫺0.242* ⫺0.295* 0.084 0.376*
,Pvalue .010* .001* .360 ⬍.001*
MD, Total SDGM 0.270* 0.206* ⫺0.415* 0.003
,Pvalue .002* .015* ⬍.001* .979
Caudate 0.282* 0.142 ⫺0.471* 0.050
,Pvalue .002* .115 ⬍.001* .605
Thalamus 0.268* 0.125 ⫺0.370* ⫺0.058
,Pvalue .003* .167 ⬍.001* .553
Hippocampus 0.227* 0.304* ⫺0.230* ⫺0.063
,Pvalue .014* ⬍.001* .006* .526
AD, Total SDGM 0.225* 0.179* ⫺0.389* 0.050
,Pvalue .010* .037* ⬍.001* .591
Caudate 0.280* 0.156 ⫺0.458* 0.043
,Pvalue .002* .076 ⬍.001* .653
Thalamus 0.246* 0.131 ⫺0.361* ⫺0.018
,Pvalue .006* .139 ⬍.001* .867
Hippocampus 0.175 0.240* ⫺0.226* 0.026
,Pvalue .058 .006* .006* .807
RD, Total SDGM 0.296* 0.222* ⫺0.428* ⫺0.028
,Pvalue ⬍.001* .008* ⬍.001* .785
Caudate 0.282* 0.133 ⫺0.476* 0.053
,Pvalue .002* .140 ⬍.001* .583
Thalamus 0.280* 0.120 ⫺0.372* ⫺0.081
,Pvalue .002* .190 ⬍.001* .408
Hippocampus 0.252* 0.334* ⫺0.227* ⫺0.113
,Pvalue .006* ⬍.001* .006* .230
Note:—NCV indicates normalized cortical volume; NWMV, normalized white matter volume; T1-LV, T1 lesion volume; T2-LV, T2 lesion volume.
Regression analysis was adjusted for the effects of age, sex, disability level, and disease duration. AllPvalues were corrected for multiple comparisons using Benja-mini-Hochberg correction.
[image:6.594.302.531.74.411.2]* indicates significantPvalues (P⬍.05) after correction.
Table 5: Linear regression analysis including diffusion tensor imaging measures, T2 lesion burden, white matter, and cortical volumes in progressive MS
T1-LV T2-LV NWMV NCV
FA, Total SDGM ⫺0.152 ⫺0.091 0.005 ⫺0.179
,Pvalue .361 .581 .978 .237
Caudate 0.103 0.160 0.377* ⫺0.352*
,Pvalue .551 .327 .008* .014*
Thalamus 0.029 0.026 0.053 ⫺0.089
,Pvalue .883 .888 .756 .582
Hippocampus ⫺0.363* ⫺0.396* ⫺0.002 0.211
,Pvalue .011* .003* .984 .131
MD, Total SDGM 0.289* 0.449* ⫺0.551* ⫺0.009
,Pvalue .038* ⬍.001* ⬍.001* .964
Caudate 0.223 0.335* ⫺0.543* 0.065
,Pvalue .133 .016* ⬍.001* .672
Thalamus 0.198 0.346* ⫺0.387* ⫺0.087
,Pvalue .174 .010* .003* .559
Hippocampus 0.404* 0.569* ⫺0.529* ⫺0.096
,Pvalue .006* ⬍.001* ⬍.001* .553
AD, Total SDGM 0.268* 0.434* ⫺0.546* ⫺0.028
,Pvalue .050* ⬍.001* ⬍.001* .866
Caudate 0.240 0.366* ⫺0.523* 0.033
,Pvalue .097 .008* ⬍.001* .850
Thalamus 0.214 0.374* ⫺0.403* ⫺0.109
,Pvalue .128 .006* .001* .464
Hippocampus 0.342* 0.516* ⫺0.566* ⫺0.051
,Pvalue .023* ⬍.001* ⬍.001* .765
RD, Total SDGM 0.30* 0.455* ⫺0.549* 0.003
,Pvalue .036* ⬍.001* ⬍.001* .985
Caudate 0.213 0.317* ⫺0.539* 0.082
,Pvalue .158 .025* ⬍.001* .592
Thalamus 0.187 0.328* ⫺0.375* ⫺0.076
,Pvalue .208 .017* .003* .611
Hippocampus 0.426* 0.582* ⫺0.496* ⫺0.117
,Pvalue ⬍.001* ⬍.001* ⬍.001* .469 Note:—NCV indicates normalized cortical volume; NWMV, normalized white matter volume; T1-LV, T1 lesion volume; T2-LV, T2 lesion volume.
Regression analysis was adjusted for the effects of age, sex, disability level, and disease duration. AllPvalues were corrected for multiple comparisons using Benja-mini-Hochberg correction.
Further longitudinal and postmortem studies need to shed light on the pathogenesis of SDGM and cortical degeneration in pa-tients with MS.
Disclosures: Bianca Weinstock-Guttman received honoraria as a speaker and as a consultant for Biogen Idec, Teva Pharmaceuticals, EMD Serono, Pfizer, Novartis, and Acorda. Dr. Weinstock-Guttman received research funds from Biogen Idec, Teva Pharmaceuticals, EMD Serono, Pfizer, Novartis, Acorda, and Cyberonics. ADDITIONAL DISCLOSURES* (ICMJE):UNRELATED: Consultancy:Teva Neurosci-ence, Genzyme & Sanofi, Novartis Mylan;Grants/Grants Pending:Teva Neurosci-ence, Genzyme & Sanofi, Questcor, Novartis;Payment for Lectures (including ser-vice on speaker bureaus):Biogen Idec, Teva Neuroscience, EMD Serono, Genzyme &Sanofi, Novartis;Payment for Manuscript Preparation:Novartis. Francesco Patti received honoraria for speaking and consultant activities by Bayer, Biogen Idec, Merck Serono, Novartis, Sanofi-Aventis, and Teva Pharmaceuticals. He also received research grant by FISM (Fondazione Italiana Sclerosi Multipla) and MIUR (Ministero Italiano della Universita` e della Ricerca). ADDITIONAL DISCLOSURES* (ICMJE): RE-LATED: Consulting Fee or Honorarium:Genzyme, Comments: I served as an advisory board member and speaking activity for the mentioned companies;UNRELATED: Board Membership:Bayer Schering, Biogen Idec, Merck Serono, Novartis, Sanofi-Genzyme, Comments: Advisory board;Payment for Lectures (including service on speaker bureaus):Bayer Schering, Biogen Idec, Merck Serono, Novartis, Sanofi-Gen-zyme, Teva, Comments: Travel grants/honoraria. Robert Zivadinov received per-sonal compensation from Teva Pharmaceuticals, Biogen Idec, EMD Serono, Novartis, and Sanofi-Genzyme for speaking and consultant fees. Dr. Zivadinov received finan-cial support for research activities from Biogen Idec, Teva Pharmacuticals, EMD Serono, Novartis, and Sanofi-Genzyme. ADDITIONAL DISCLOSURES* (ICMJE):
UNRELATED: Payment for Lectures (including service on speaker bureaus):Biogen Idec, EMD Serono, Teva Pharmaceuticals, Genzyme-Sanofi, Novartis. *If not dis-closed previously.
REFERENCES
1. De Stefano N, Matthews PM, Filippi M, et al.Evidence of early cor-tical atrophy in MS: relevance to white matter changes and disabil-ity.Neurology2003;60:1157– 62
2. Zivadinov R, Heininen-Brown M, Schirda CV, et al.Abnormal sub-cortical deep-gray matter susceptibility-weighted imaging filtered phase measurements in patients with multiple sclerosis: a case-con-trol study.Neuroimage2012;59:331–39
3. Hulst HE, Geurts JJ.Gray matter imaging in multiple sclerosis: what have we learned?BMC Neurol2011;11:153
4. Lucchinetti CF, Popescu BF, Bunyan RF, et al.Inflammatory cortical demyelination in early multiple sclerosis. N Engl J Med
2011;365:2188 –97
5. Ceccarelli A, Rocca MA, Pagani E, et al.A voxel-based morphometry study of grey matter loss in MS patients with different clinical phe-notypes.Neuroimage2008;42:315–22
6. Calabrese M, Rinaldi F, Mattisi I, et al.The predictive value of gray matter atrophy in clinically isolated syndromes. Neurology
2011;77:257– 63
7. Minagar A, Barnett MH, Benedict RH, et al.The thalamus and mul-tiple sclerosis: modern views on pathologic, imaging, and clinical aspects.Neurology2013;80:210 –19
8. Fisher E, Lee JC, Nakamura K, et al.Gray matter atrophy in multiple sclerosis: a longitudinal study.Ann Neurol2008;64:255– 65 9. Zivadinov R, Havrdova´ E, Bergsland N, et al.Thalamic atrophy is
associated with development of clinically definite multiple sclero-sis.Radiology2013;268:831– 41
10. Zivadinov R, Bergsland N, Dolezal O, et al.Evolution of cortical and thalamus atrophy and disability progression in early relaps-ing-remitting MS during 5 years. AJNR Am J Neuroradiol
2013;34:1931–39
11. Benedict RH, Zivadinov R, Carone DA, et al.Regional lobar atrophy predicts memory impairment in multiple sclerosis.AJNR Am J Neu-roradiol2005;26:1824 –31
12. Bakshi R, Benedict RH, Bermel RA, et al.T2 hypointensity in the deep gray matter of patients with multiple sclerosis: a quantita-tive magnetic resonance imaging study. Arch Neurol
2002;59:62– 68
13. Bendfeldt K, Blumhagen JO, Egger H, et al.Spatiotemporal
dis-tribution pattern of white matter lesion volumes and their asso-ciation with regional grey matter volume reductions in relaps-ing-remitting multiple sclerosis. Hum Brain Mapp 2010;31: 1542–55
14. Bo¨ L, Geurts JJ, van der Valk P, et al.Lack of correlation between cortical demyelination and white matter pathologic changes in multiple sclerosis.Arch Neurol2007;64:76 – 80
15. Schmierer K, Wheeler-Kingshott CA, Boulby PA, et al.Diffusion ten-sor imaging of post mortem multiple sclerosis brain.Neuroimage
2007;35:467–77
16. Filippi M, Rocca MA.MR imaging of multiple sclerosis.Radiology
2011;259:659 – 81
17. Rovaris M, Gass A, Bammer R, et al.Diffusion MRI in multiple scle-rosis.Neurology2005;65:1526 –32
18. Raz E, Cercignani M, Sbardella E, et al.Clinically isolated syndrome suggestive of multiple sclerosis: voxelwise regional investigation of white and gray matter.Radiology2010;254:227–34
19. Raz E, Cercignani M, Sbardella E, et al.Gray- and white-matter changes 1 year after first clinical episode of multiple sclerosis: MR imaging.Radiology2010;257:448 –54
20. Benedict RH, Hulst HE, Bergsland N, et al.Clinical significance of atrophy and white matter mean diffusivity within the thalamus of multiple sclerosis patients.Mult Scler2013;19:1478 – 84
21. Mesaros S, Rocca MA, Pagani E, et al.Thalamic damage predicts the evolution of primary-progressive multiple sclerosis at 5 years.
AJNR Am J Neuroradiol2011;32:1016 –20
22. Senda J, Watanabe H, Tsuboi T, et al.MRI mean diffusivity detects widespread brain degeneration in multiple sclerosis.J Neurol Sci
2012;319:105–10
23. Tovar-Moll F, Evangelou IE, Chiu AW, et al.Thalamic involvement and its impact on clinical disability in patients with multiple sclerosis: a diffusion tensor imaging study at 3T.AJNR Am J Neuro-radiol2009;30:1380 – 86
24. Jehna M, Langkammer C, Khalil M, et al.An exploratory study on the spatial relationship between regional cortical volume changes and white matter integrity in multiple sclerosis.Brain Connect
2013;3:255– 64
25. Henry RG, Shieh M, Amirbekian B, et al.Connecting white matter injury and thalamic atrophy in clinically isolated syndromes.J Neu-rol Sci2009;282:61– 66
26. Mu¨hlau M, Buck D, Forschler A, et al.White-matter lesions drive deep gray-matter atrophy in early multiple sclerosis: support from structural MRI.Mult Scler2013;19:1485–92
27. Polman CH, Reingold SC, Banwell B, et al.Diagnostic criteria for multiple sclerosis: 2010 revisions to the McDonald criteria.Ann Neurol2011;69:292–302
28. Behrens TE, Johansen-Berg H, Woolrich MW, et al.Non-invasive mapping of connections between human thalamus and cortex us-ing diffusion imagus-ing.Nat Neurosci2003;6:750 –57
29. Behrens TE, Woolrich MW, Jenkinson M, et al.Characterization and propagation of uncertainty in diffusion-weighted MR imaging.
Magn Reson Med2003;50:1077– 88
30. Benjamini Y, Hochberg Y.Controlling the false discovery rate—a practical and powerful approach to multiple testing.J Roy Stat Soc B Met1995;57:289 –300
31. Batista S, Zivadinov R, Hoogs M, et al.Basal ganglia, thalamus and neocortical atrophy predicting slowed cognitive processing in mul-tiple sclerosis.J Neurol2012;259:139 – 46
32. Bozzali M, Cercignani M, Sormani MP, et al.Quantification of brain gray matter damage in different MS phenotypes by use of diffusion tensor MR imaging. AJNR Am J Neuroradiol
2002;23:985– 88
33. Liu Y, Duan Y, He Y, et al.Whole brain white matter changes re-vealed by multiple diffusion metrics in multiple sclerosis: a TBSS study.Eur J Radiol2012;81:2826 –32
34. Akbar N, Lobaugh NJ, O’Connor P, et al.Diffusion tensor imaging abnormalities in cognitively impaired multiple sclerosis patients.
35. Hasan KM, Walimuni IS, Abid H, et al.Human brain atlas-based multimodal MRI analysis of volumetry, diffusimetry, relaxometry and lesion distribution in multiple sclerosis patients and healthy adult controls: implications for understanding the pathogenesis of multiple sclerosis and consolidation of quantitative MRI results in MS.J Neurol Sci2012;313:99 –109
36. Yu HJ, Christodoulou C, Bhise V, et al.Multiple white matter tract abnormalities underlie cognitive impairment in RRMS. Neuroim-age2012;59:3713–22
37. Bozzali M, Spano` B, Parker G, et al.Anatomical brain connectivity can assess cognitive dysfunction in multiple sclerosis.Mult Scler
2013;19:1161– 68
38. Ciccarelli O, Werring DJ, Wheeler-Kingshott CA, et al.Investigation of MS normal-appearing brain using diffusion tensor MRI with clinical correlations.Neurology2001;56:926 –33
39. Hannoun S, Durand-Dubief F, Confavreux C, et al.Diffusion tensor-MRI evidence for extra-axonal neuronal degeneration in caudate
and thalamic nuclei of patients with multiple sclerosis.AJNR Am J Neuroradiol2012;33:1363– 68
40. Zhao DD, Zhou HY, Wu QZ, et al.Diffusion tensor imaging char-acterization of occult brain damage in relapsing neuromyelitis op-tica using 3.0T magnetic resonance imaging techniques. Neuroim-age2012;59:3173–77
41. Hasan KM, Walimuni IS, Abid H, et al.Multimodal quantitative magnetic resonance imaging of thalamic development and aging across the human lifespan: implications to neurodegeneration in multiple sclerosis.J Neurosci2011;31:16826 –32
42. Hughes EJ, Bond J, Svrckova P, et al.Regional changes in thalamic shape and volume with increasing age. Neuroimage 2012;63: 1134 – 42
43. Oreja-Guevara C, Rovaris M, Iannucci G, et al.Progressive gray mat-ter damage in patients with relapsing-remitting multiple sclerosis: a longitudinal diffusion tensor magnetic resonance imaging study.