Evolution of Internal Crack in BCC Fe under
Compressive Loading
Dongbin Wei1, Zhengyi Jiang1, Jingtao Han2
1School of Mechanical, Materials and Mechatronic Engineering, University of Wollongong, Wollongong, Australia 2School of Materials Science and Engineering, University of Science and Technology Beijing, Beijing, China
Email: [email protected], [email protected], [email protected]
Received August 5, 2012; revised September 3, 2012; accepted September 9,2012
ABSTRACT
A molecular dynamics model has been developed to investigate the evolution of the internal crack of nano scale during heating or compressive loading in BCC Fe. The initial configuration does not contain any pre-existing dislocations. In the case of heating, temperature shows a significant effect on crack evolution and the critical temperature at which the crack healing becomes possible is 673 K. In the case of compressive loading, the crack can be healed at 40 K at a load- ing rate 0.025 × 10¹⁸ Pa·m1/2/s in 6 × 10⁻¹² s. The diffusion of Fe atoms into the crack area results in the healing proc-
ess. However, dislocations and voids appear during healing and their positions change continuously. Keywords: Internal Crack; Evolution; BCC Fe; Simulation; Compressive Load
1. Introduction
Metals own the ability of self-healing. It is possible that low strength materials might be made more reliable at a low cost if the crack healing is applied at an intermediate stage of their service life. The self-healing effect for creep cavitation in heat resisting stainless steels has been developed by alloy design, so micro-cracks can be con- strained from propagating by automatically forming compounds on the crack surfaces although they may not be annihilated [1,2].
A lot of research has been conducted on crack healing in inorganic and composite materials while less work has been performed on metals. The damage evolution in metals was analysed [3], and many kinds of heat treat-ment methods can be used to decrease the number of defects in metals after a long-term operation at high temperatures [4]. By TEM observation, a crack in α-Fe was found to be healed completely when the temperature was increased to a critical value of 1073 K [5]. It was suggested that the thermal or mechanical treatment pro- vides the driving force to minimise the surface energy resulting in the crack healing [6]. The healing of internal pre-cracks obtained using plate impact technology was studied in a vacuum at an elevated temperature [7,8], and the inhomogeneous microstructure in crack healing area was analysed [9]. It has been shown that the healing of fine cracks (100 nm) begins immediately after heating then proceeds according to the vacancy diffusion mecha- nism in the surface layer about 10 μm thick [10].
The effect of hydrostatic pressure on the shrinkage of cavities in copper introduced by creep at 773 K and situ- ated on grain boundaries was studied [11]. The density of the specimen showed a rapid increase when a hydrostatic pressure was applied during annealing, while the change was little when annealed under atmospheric pressure. The similar result was also obtained in [12]. One of the reasons why the ductility of experimental steels can be improved over the whole working temperature is to anni- hilate or heal micro-cracks that may occur during defor- mation [13]. The internal crack can be healed completely and rapidly under hot plastic deformation [14]. It is pos- sible to intensify crack healing and/or refinement of the microstructure by adjusting the parameters of plastic de-formation or isostatic pressure [15].
Molecular dynamics (MD) has been adopted to dis- cover the essence of crack healing in metals. MD simula- tion was conducted to study crack healing in Al [16] and Cu crystals [17], both of which are FCC. Dislocation generation and motion occur during crack healing. The critical temperature for crack healing depends upon the orientation of the crack plane. BCC crystal is character- ized by four close-packed directions, the <111> direc- tions, and by the lack of a truly close-packed plane such as the octahedral plane of the FCC lattice.
temperature ranged 273 - 1173 K been considered, but also the effect of compressive loading is taken into account.
2. Computational Method
The molecular dynamics method is built based on a set of Newtonian dynamics equations for a number of particles with the macro constraints and boundary condition. They are solved by a numerical method to achieve the classical trajectory and velocity. The macro physical properties and motion routine can be obtained based on the statistic- cal average of the results calculated for a long duration of time.
Assuming the total number of atoms is N, which fol- lows Newton’s law.
tot 1, , ,2 N i i U m
r r r
F v
r i i
N
(1) where , Utot is the total potential energy of
N atoms, is the atom mass. The position ri and
velocity i of every particle in a system can be obtained
by solving Equation (1). The position i and
velocity of every particle at time 1, 2, ,
i i
m v
Δi
v t t r t
ΔttΔtdepend on the position and velocity of that particle respectively at time t, and the leapfrog algorithm [19] is applied to calculate the positions and velocities of atoms.
i
r t v ti
The reliability of the molecular dynamics simulation depends on the description of the inter-atomic potential. The inter-atomic potential adopted here is the N-body potential proposed by Finnis and Sinclair according to the embedded atom method (EMA) [20], the total energy of an assembly of atoms can be written as
1
2 tot
1 1 1
1 2
N N N
i i
i j i i j
U
V rjij
r
(2) where the second term on the right hand side of Equation (2) is the conventional central pair-potential summation, while the first term is the N-body term, in which
1
N
i j i j
r
(3)where both V and Φ are functions of the inter-atomic distance rij. Constructed by [21], the following functional
forms have been adopted.
6 3 1 2 3 1k k k
k
k k k
k
V r a r r H r r
r A R r H R
(4)where the parameters a1, a2, A3, A4, A5, A6, A1 and A2 are −36.559853, 62.416005, −13.155649, −2.721376,
8.761986, 100.0000, 72.868366 and −100.944815 re-
spectively. r1, R2, R3, r4, r5, R6, R1 and R2 are 1.180000,
1.150000, 1.080000, 0.990000, 0.930000, 0.866025, 1.300000 and 1.200000 respetively [22], H x
is the Heaviside unit-step function which gives the cut-off dis-tance of each spline segment, r1 and R1 represent the cut-off radii of V and Φ respectively.
3. Model Description
The x-axis is along the extension line of the central crack, the y-axis along the normal of the crack plane, and the z-axis along the 1 12 direction. The lattice constant a0
for BCC Fe is 2.8665 × 10⁻¹⁰ m. The length of the calcu-
lation cell along the x-axis direction is 0 3 264
6 a
,
y-axis 48 2 0 2 a
, z-axis 6 6 0 6 a
. Every three layers of atoms along the x-axis direction constitutes a cycle of
0 3
2 a long, every two layers of atoms along y-axis di- rection constitutes a cycle of 2a0 long, and every six layers of atoms along z-axis direction constitutes a cycle of 6a0 long.
The crack is expressed by removing some atoms in the centre of the cell [23] and the angle between the
1 10 slip plane and the crack plane is set to be 60˚ randomly. The crack is about 5.957 × 10⁻⁹ m long and over 1.500 a0
wide. The width is larger than the cut-off radii of Φ, 1.300 a0, which means that there exists no interplaying
force between the atoms on either side of the crack sur- face. The total number of atoms is 12582.
Because of the limit of computation scale, the number of atoms in the simulation is usually much lower than that in a real system. Boundary conditions have signifi- cant effect on the reliability of simulation results. In the case of heating, fixed boundary condition [24,25] is adopted along the x- and y-axis directions, which means that the locations of the boundary atoms are constant during the whole calculation process. In the case of load- ing, displacement boundary condition is adopted along the x- and y-axis directions, i.e. the boundary atoms have displacement based on the biaxial plane strain linear elastic displacement field in the solid containing crack [26].
1
1 2 Re lm 1
2 1 lm Re
x y u Z E u Z E y Z y Z (5)
where ux, uy are the displacement in x and y direction
respectively, E is Young’s modulus, γ is Poisson’s ratio.
21
length of the central crack and z = x + yi. In both cases, periodical boundary condition [17,27] is used in z direc- tion.
The initial velocity is the Maxwell-Boltzmann distri- bution corresponding to a given temperature. The system temperature is maintained constant by scaling the atom velocities during the simulation.
The equilibrium of the atomic configuration is ob- tained after a long time relaxing at a low temperature near 0 K, as shown in Figure 1. No defects are set in this initial configuration. dy representing the minimum verti-
cal distance between the atoms on top crack surface and bottom crack surface is adopted for assessing healing process [18]. It is 1.526 a0 in the initial configuration.
Crack healing becomes possible when dy is less than the
cut-off radii of V, 1.180 a0.
4. Results and Discussion
4.1. Heating
The simulated temperature in the model in this study has to be below 1185 K for keeping the parameters of N- body potentials for BCC Fe valid. Simulations were car- ried out in the temperature range of 273 - 1173 K and the increment is 50 K. The simulation spans 6.0 × 10⁻¹¹ s and
the time step Δt is 1 × 10⁻¹⁶ s.
Relationships between dy and time at the temperatures
of 573, 623, 673, 773, 873 and 923 K are shown in Fig- ure 2 for comparison. It can be seen thatdy experiences a
dramatic decrease in the first 1.0 - 2.0 × 10⁻¹² s, then
increases and tends to fluctuate in a narrow range in all cases. The dramatic decrease may result from the unsta- ble calculation in this first 1.0 - 2.0 × 10⁻¹² s. The fluc-
tuation range moves down with an increase of tempera- ture.
When the temperature is 573 K, the fluctuation may be over the cut-off radii of Φ, R1 = 1.300 a0. When the tem-
perature is 623 K, the fluctuation range is between R1 =
1.300 a0 and the cut-off radii of V, r1 = 1.180 a0. When
the temperature is 673 K, the fluctuation range is around r1 = 1.180 a0. When the temperature reaches 773 K, the
fluctuation ranges decrease rapidly to be around 0.500 a0.
When the temperature reaches 923 K, the atoms on top and bottom surfaces move actively as shown in Figure 3, anddy becomes 0 when the simulation time is 3 × 10⁻¹¹ s,
as shown in Figure 3(c). The reason why the fluctuation ranges can decrease dramatically when the temperature reaches about 773 K may be the atoms on top and bottom surfaces become active enough at this temperature and can be brought to within a close range abruptly. A thre-shold value might exist but need to be delivered in the future study.
The above results show that the critical temperature at which the crack healing becomes possible is 673 K. A
dy=1.526 a0
5.957 10-9 m
110
x
z 112
y
111
O
60°
Figure 1. Initial configuration.
-0.5 0.0 0.5 1.0 1.5 2.0 2.5 3.0 3.5 4.0 4.5 5.0 5.5 6.0 6.5 0.0 0.1 0.2 0.3 0.4 0.5 0.6 0.7 0.8 0.9 1.0 1.1 1.2 1.3 1.4 1.5 1.6
cut-off radii of
cut-off radii of V
Time, 10-11s dy , x a0 573K 623K 673K 773K 923K
Figure 2. Relationships between dy and time.
transition temperature may exist in the range of 673 - 773 K, above which the process of crack healing is acceler-ated dramatically. The temperature at which a complete healing may be achieved is 923 K. Figure 4 shows the process of crack healing at 1173 K.
Only after 1 × 10⁻¹³ s,d
y decreases to 0.989 a0, which
is less than r1 = 1.180 a0, as shown in Figure 4(a); after
1.1 × 10⁻¹² s, the crack evolves into two sections, as
shown in Figure 4(b); after 1.8 × 10⁻¹² s, only two voids
are left at the position of two crack tips, as shown in Figure 4(c); after 4.5 × 10⁻¹² s, the crack is healed com-
pletely, as shown in Figure 4(d); the state of crack heal- ing remained stable after that.
4.2. Compressive Loading
The atomic configuration shown in Figure 1 is also adopted as the initial configuration for simulating crack evolution during compressive loading. The environment temperature is 40 K. The time step Δt s 1 × 10⁻¹⁵ s and
the loading rate is 0.025 × 10¹⁸ Pa·m1/2/s. i
After 5 × 10⁻¹² s, when the stress intensity factor K I =
1.25 × 10⁵ Pa·m1/2, d
(a)
(b)
[image:4.595.57.289.78.558.2](c)
Figure 3. Evolution of crack morphology at 923 K. (a) t = 6 × 10⁻¹² s; (b)
t = 1 × 10⁻¹¹ s; (c) t = 3 × 10⁻¹¹ s.
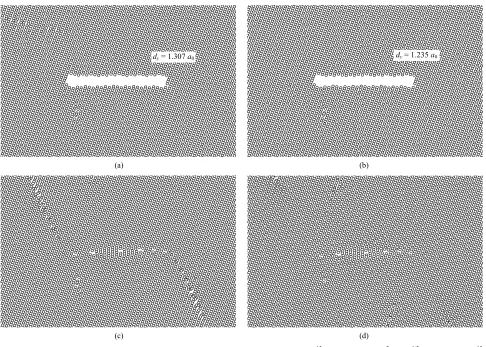
the happening of crack healing, as shown in Figure 5(a). After 6 × 10⁻¹² s, d
y = 1.235 a0, which is less than R1 =
1.300 a0, which means that the crack tends to be healed
as shown in Figure 5(b). When the time is 3 × 10⁻¹¹ s,
the crack is healed completely, as shown in Figure 5(c). Then it remains stable and the morphology when the time is 6 × 10⁻¹¹ s is shown in Figure 5(d).
During crack healing process, atoms deviates from their normal positions, which results in many defects such as dislocations and voids similar to that in Al [16] and Cu [17]. Some defects in the simulation cell at 4.5 × 10⁻¹², 6.0 × 10⁻¹², 3.6 × 10⁻¹¹ and 6.0 × 10⁻¹¹ s after the
dy = 0.989 a0
(a)
(b)
(c)
[image:4.595.308.540.186.708.2](d)
dy = 1.307 a0
dy = 1.235 a0
(a) (b)
[image:5.595.56.542.81.428.2]
(c) (d)
Figure 5. Crack healing process during compressive loading at 40 K. (a) t = 5 × 10-12 s, KI = 1.25 × 10⁵ Pa·m1/2; (b) t = 6 × 10⁻¹²
s, KI = 1.5 × 10⁵ Pa·m1/2; (c) t = 3 × 10⁻¹¹ s, KI = 7.5 × 10⁵ Pa·m1/2; (d) t = 6 × 10⁻¹¹ s, KI = 1.5 × 10⁶ Pa·m1/2.
crack has been healed completely at 1173 K are marked in Figures 6(a)-(d) respectively. The dashed rectangle frames show original crack locations, and the circles show the positions of some defects. The distribution of the defects in the cell is inhomogenous. Defects can be found to aggregate in the region where is with the origi-nal crack, especially around the areas where are the crack tips. The positions of these defects change continuously, and the inhomogeneity of the distribution of the defects decreases with an increase of time.
The crack can be considered a very large defect in the simulation cell. The existence of nano scale crack surface results in higher system energy than that without inner crack, so there is a tendency to eliminate the crack to reduce the system energy. However, the crack healing process cannot happen when the temperature is low be- cause an energy barrier exists between the state when the crack exists and the state when the crack is healed. Im- porting energy by temperature rise to activate atoms can help overcome the energy barrier.
In the process of crack healing, the activated atoms close to crack immigrate to the crack area and vacancies appear in the positions from where atoms emigrated, then
the atoms adjacent to these vacancies need adjust their positions. Because the crack size is much larger than the size of any other defects appearing in the simulation cell, it may cost much more time for the atoms immigrating to the crack area to rearrange their positions than the atoms that only need adjust their positions to accommo- date adjacent vacancies. This results in that the distribu- tion of defects is inhomogeneous in the early stage of healing.
The healing of a crack means that a large defect evolves into a lot of small defects and all the defects may not be eliminated. However, the atoms adjust their posi- tions continuously in order to reduce the system energy even after the crack has been healed. This continuous position adjustment results in more homogeneous distri- bution of defects with an increase of time, and the quan- tity of the defects in the crack area may be reduced.
Some defects in crack healing region when the time is 3 × 10⁻¹¹ and 6 × 10⁻¹¹ s during compressive loading are
(a) (b)
[image:6.595.57.543.86.476.2]
(c) (d)
Figure 6. Dislocations and voids in crack healing region at 1173 K. (a) t = 4.5 × 10⁻¹² s; (b) t = 6.0 × 10⁻¹² s; (c) t = 3.6 × 10⁻¹¹ s; (d) t = 6.0 × 10⁻¹¹ s.
(a) (b)
Figure 7. Defects in crack healing region during compressive loading at 40 K. (a) t = 3 × 10⁻¹¹ s, K
I = 7.5 × 10⁵ Pa·m1/2; (b) t =
6 × 10⁻¹¹ s, K
[image:6.595.57.541.512.714.2]the original crack was.
5. Conclusion
The critical temperature at which nano scale crack heal- ing of BCC Fe crystal without pre-existing dislocations becomes possible is 673 K. Temperature has a significant effect on the evolution of nano scale crack. Healing pro- ceeds rapidly at 1173 K. Compressive loading can result in crack healing. Crack is healed completely at 40 K at loading rate 0.025 × 10¹⁸ Pa·m1/2/s in 6 × 10⁻¹² s. Dislo-
cations and voids appear during healing process, and their positions change continuously. In the case of heat- ing, the distribution of the defects in the cell is inho- mogenous in the early stage of healing. This inhomoge- neity decreases and the quantity of the defects in the crack area may be reduced with an increase of time. In the case of compressive loading, most defects aggregate in the region where the original crack is.
6. Acknowledgements
The authors thank the support of Australia Research Council (ARC) Discovery Project.
REFERENCES
[1] K. Laha, J. Kyono, T. Sasaki, S. Kishimoto and N. Shinya, “Improved Creep Strength and Creep Ductility of Type 347 Austenitic Stainless Steel through the Self-Healing Effect of Boron for Creep Cavitation,” Metallurgical and Materials Transactions A, Vol. 36, No. 2, 2005, pp. 399- 409.
[2] N. Shinya and J. Kyono, “Effect of Boron Nitride Pre- cipitation at Cavity Surface on Rupture Properties,” Ma- terials Transactions, Vol. 47, No. 9, 2006, pp. 2302- 2307. doi:10.2320/matertrans.47.2302
[3] V. I. Kumanin, M. L. Sokolova and S. V. Luneva, “Damage Evolution in Metallic Materials,” Metal Science and Heat Treatment, Vol. 37, No. 4, 1995, pp. 131-135. doi:10.1007/BF01189467
[4] V. I. Kumanin, L. A. Kovaleva and M. L. Sokolova, “The Use of Recovery Heat Treatment to Eliminate Damage in Metallic Materials,” Metal Science and Heat Treatment, Vol. 37, No. 4, 1995, pp. 136-140.
doi:10.1007/BF01189468
[5] K. Gao, S. Li, L. Qiao and W. Chu, “Molecular Dynamics Simulation and in Situ TEM Study of Crack Healing,”
Materials Science and Technology, Vol. 18, No. 10, 2002, pp. 1109-1114. doi:10.1179/026708302225006133 [6] K. Gao, L. Qiao and W. Chu, “In Situ TEM Observation
of Crack Healing in Alpha-Fe,” Scripta Materialia, Vol. 44, No. 7, 2001, pp. 1055-1059.
doi:10.1016/S1359-6462(01)00671-6
[7] D. B. Wei, J. T. Han, J. X. Xie, C. G. Fu, L. Z. Wang and Y. X. He, “Steel Crack Healing at Elevated Temperature in Vacuum,” Acta Metallurgica Sinica, Vol. 36, 2000, pp.
[8] D. B. Wei
713-717.
, J. T. Han, Z. Y. Jiang, C. Lu and A. K. Tieu, “A Study on Crack Healing in 1045 Steel,” Journal of Materials Processing Technology, Vol. 177, No. 1-3, 2006, pp. 233-237. doi:10.1016/j.jmatprotec.2006.04.067 [9] D. B. Wei, J. T. Han, A. K. Tieu and Z. Y. Jiang, “An
Analysis on the Inhomogeneous Microstructure in Crack Healing Area,” Key Engineering Materials, Vol. 274-276, 2004, pp. 1053-1058.
doi:10.4028/www.scientific.net/KEM.274-276.1053 [10] V. A. Konkova, “Development and Curing of Nucleating
Microcracks in Deformed Aluminum,” Metal Science and Heat Treatment, Vol. 38, No. 11, 1996, pp. 490-493. doi:10.1007/BF01156525
[11] W. B. Beere and G. W. Greenwood, “Effect of Hydro-static Pressure on the Shrinkage of Cavities in Metals,”
Metal Science, Vol. 5, No. 1, 1971, pp. 107-113. doi:10.1179/030634571790439757
[12] A. Gittins, “Stability of Grain Boundary Cavities in Cop-per,” Nature, Vol. 214, 1967, pp. 586-587.
doi:10.1038/214586a0
[13] T. Matuszewski, P. Machmeier and H. McQueen, “The
, J. X. Xie, C. G. Fu, L. Z. Wang and
x’ Microstruc-Workability of Commercial and Experimental 0.6% Car-bon Low Alloy Steels in the Temperature Range of 650 - 870 deg C,” Metallurgical Transactions A, Vol. 25, No. 4, 1994, pp. 827-837.
[14] D. B. Wei, J. T. Han
Y. X. He, “Experimental Study on Inner Crack Healing in Steel During Hot Plastic Deforming,” Acta Metallurgica Sinica, Vol. 36, No. 6, 2000, pp. 622-625.
[15] J. Foct and N. Akdut, “Why Are ‘Duple
tures Easier to Form than Expected?” Scripta Metallur-gica et Materialia, Vol. 27, No. 8, 1992, pp. 1033-1038. doi:10.1016/0956-716X(92)90469-U
[16] G. H. Zhou, K. W. Gao, L. J. Qiao, Y. Wang and W. Y. Chu, “Atomistic Simulation of Microcrack Healing in Aluminium,” Modelling and Simulation in Materials Science, Vol. 8, 2000, pp. 603-609.
doi:10.1088/0965-0393/8/4/313
[17] S. Li, K. W. Gao, L. J. Qiao, F. X. Zhou and W. Y. Chu, “Molecular Dynamics Simulation of Microcrack Healing in Copper,” Computational Materials Science, Vol. 20, No. 2, 2001, pp. 143-150.
doi:10.1016/S0927-0256(00)00130-0
[18] D. B. Wei, J. T. Han, A. K. Tieu and Z. Y. Jiang, “Simu-lation of Crack Healing in BCC Fe,” Scripta Materialia, Vol. 51, No. 6, 2004, pp. 583-587.
doi:10.1016/j.scriptamat.2004.05.032
[19] D. W. Heermann, “Computer Simulation Methods in Theoretic Physics,” 2nd Edition, Springer-Verlg, Berlin, 1990. doi:10.1007/978-3-642-75448-7
[20] M. W. Finnis and J. E. Sinclair, “A Simple Empirical N-Body Potential for Transition Metals,” Philosophical Magazine A, Vol. 50, No. 1, 1984, pp. 45-55.
doi:10.1080/01418618408244210
[22] G. J. Ackland, D. J. Bacon, A. F. Calder and T. Harry, “Computer Simulation of Point Defect Properties in Di-lute Fe-Cu Alloy Using a Many-Body Interatomic Poten-tial,” Philosophical Magazine A, Vol. 75, No. 3, 1997, pp. 713-732. doi:10.1080/01418619708207198
[23] H. Noguchi and Y. Furuya, “A Method of Seamlessly Combining a Crack Tip Molecular Dynamics Enclave with a Linear Elastic Outer Domain in Simulating Elastic- Plastic Crack Advance,” International Journal of Frac-ture Mechanics, Vol. 87, No. 4, 1997, pp. 309-329. doi:10.1023/A:1007442003884
[24] M. F. Kanninen and P. C. Gehlen, “Atomic Simulation of
Crack Extension in BCC Fe,” International Journal of Fracture Mechanics, Vol. 7, No. 4, 1971, pp. 471-474. doi:10.1007/BF00189120
[25] B. deCelis, A. S. Argon and Y. J. Sidney, “Molecular Dynamics Simulation of Crack Tip Processes in Alpha- Iron and Copper,” Journal of Applied Physics, Vol. 54, No. 9, 1983, pp. 4864-4878. doi:10.1063/1.332796 [26] H. Tada, P. C. Paris and G. R. Irwin, “The Stress