TELEMETRY CASE REPORT
Assessing the utility and limitations
of accelerometers and machine learning
approaches in classifying behaviour
during lactation in a phocid seal
Courtney R. Shuert
1*, Patrick P. Pomeroy
2and Sean D. Twiss
1Abstract
Background: Classifying behaviour with animal-borne accelerometers is quickly becoming a popular tool for
remotely observing behavioural states in a variety of species. Most accelerometry work in pinnipeds has focused on classifying behaviour at sea often quantifying behavioural trade-offs associated with foraging and diving in income breeders. Very little work to date has been done to resolve behaviour during the critical period of lactation in a capital breeder. Capital breeding phocids possess finite reserves that they must allocate appropriately to maintain themselves and their new offspring during their brief nursing period. Within this short time, fine-scale behavioural trade-offs can have significant fitness consequences for mother and offspring and must be carefully managed. Here, we present a case study in extracting and classifying lactation behaviours in a wild, breeding pinniped, the grey seal (Halichoerus grypus).
Results: Using random forest models, we were able to resolve 4 behavioural states that constitute the majority of a
female grey seals’ activity budget during lactation. Resting, alert, nursing, and a form of pup interaction were extracted and classified reliably. For the first time, we quantified the potential confounding variance associated with individual differences in a wild context as well as differences due to sampling location in a largely inactive model species.
Conclusions: At this stage, the majority of a female grey seal’s activity budget was classified well using
acceler-ometers, but some rare and context-dependent behaviours were not well captured. While we did find significant variation between individuals in behavioural mechanics, individuals did not differ significantly within themselves; inter-individual variability should be an important consideration in future efforts. These methods can be extended to other efforts to study grey seals and other pinnipeds who exhibit a capital breeding system. Using accelerometers to classify behaviour during lactation allows for fine-scale assessments of time and energy trade-offs for species with fixed stores.
Keywords: Accelerometer, Grey seal, Maternal behaviour, Breeding behaviour, Machine learning, Classification
© The Author(s) 2018. This article is distributed under the terms of the Creative Commons Attribution 4.0 International License (http://creat iveco mmons .org/licen ses/by/4.0/), which permits unrestricted use, distribution, and reproduction in any medium, provided you give appropriate credit to the original author(s) and the source, provide a link to the Creative Commons license, and indicate if changes were made. The Creative Commons Public Domain Dedication waiver (http://creat iveco mmons .org/ publi cdoma in/zero/1.0/) applies to the data made available in this article, unless otherwise stated.
Open Access
*Correspondence: [email protected]
1 Department of Biosciences, Durham University, Durham DH1 3LE, UK
Background
Observing animals has been the hallmark approach of ethological studies. Often credited with formalizing the field, Altmann [1] gave researchers a toolkit for sampling behaviour state and context in the field through compa-rable and repeatable approaches to measures of activity and interaction. Quantitative observational studies have been used to understand behaviour in a wide range of contexts, such as individual- or population-level forag-ing decisions [2, 3] and investigating the mechanisms
for conflict and conflict-avoidance [4]. Comparative
observations also allow examination of how behaviour may vary over time such as differences between day and night activities [5, 6] or across individuals, including personality types and consistent individual differences [7–9]. With the advancement of animal-borne data log-gers, researchers have been able to extend the applica-tion of behavioural studies to species that have typically been very difficult to observe in the wild, such as marine mammals. More specifically, triaxial accelerometers have been used to infer behaviour remotely in pinnipeds when they are unobservable during trips to and from feeding aggregations [10–14] and other at-sea activities [15, 16]. Often, these accelerometry deployments focus on build-ing coarse-scale activity budgets for resolvbuild-ing energetics associated with foraging and diving or towards more fine-scale event detection, such as head-striking behaviour, to infer the rate of prey consumption relative to energy expenditure at sea [17–20]. These studies tend to focus on species who exhibit an income approach to the repro-ductive period of their life history, in which they must regularly supplement their energy stores to maintain and provision their pups, or focus on detecting and classify-ing behaviour outside of the reproductive period (e.g. [10,
14]). While accelerometers have been used extensively to study the behaviour of terrestrial animals, rarely has any accelerometry research been geared to the consequences of behaviour associated with the brief, but important on-land portion of seal life history (e.g. [21–26]).
The application of machine learning methods has also become a popular tool for remotely classifying behaviour from accelerometers in a variety of species (e.g. [27–30].). While accelerometers often present a novel tool for cap-turing behaviour, the associated data sets can quickly
become monumental tasks to examine manually [31].
Supervised machine learning presents a way to overcome this. By using a period of time where the behaviour of an individual is known, a concurrent set of accelerom-etry data can be labelled and used to train a classification algorithm of choice in order to classify behaviour outside of the observable period [31]. Many different algorithms are available to use in classification, ranging from simple linear discriminant analyses (e.g. [32]) and decision tree
algorithms (e.g. [33]) to more advanced black box type approaches such as random forests (e.g. [24]), support vector machines (e.g. [27]), and artificial neural networks (e.g. [34]). Gaining access to individuals in order to build a training data set can often be challenging. Captive sur-rogates have been used with accelerometers mounted in an analogous way to those in the wild and used to train an algorithm to classify the behaviour of their wild counter-parts (e.g. [22, 23, 35, 36]). One such study noted, how-ever, that captive surrogates may not exhibit behaviour in the same mechanistic fashion as those in the wild which may lead to poor, yet undetectable, model performance in classification of unknown data in wild individuals [26]. Having access to behavioural information in a wild con-text is therefore key to ensuring that trained data match that of a wild cohort of individuals and will likely more accurately characterize behaviour when out of sight.
During their 18-day period on shore, breeding female grey seals have fixed resources that they must allocate to maintain themselves and their pup [3, 37–39]. Behav-ioural decisions and small fluctuations in activity likely have an impact on this energetic allocation. Grey seals offer a good system to look at activity in detail, but visual observations to assess behaviour are limited to daylight hours. During the UK grey seal breeding season in the autumn, this may only be about one-third of their daily cycle at best. The use of supervised machine learning algorithms would be extremely powerful in order to elu-cidate behaviour outside of this limited observable time. While many previous studies have evaluated the mechan-ics of behaviour at sea, the authors have been unable to find any published studies that attempt to resolve and classify lactation and breeding behaviour on land in grey seals and other pinnipeds using accelerometry (e.g. [40]). Accelerometry-derived activity will also allow not only for the assessment of behaviour overnight, an area of research that is largely either ignored or inaccessible (e.g. [5]), but also will overcome the limitations of visual focal sampling by recording data continuously and simultane-ously over many individuals, free from observer biases.
advise placement of accelerometers close to the centre of mass as a better indicator of energy expenditure (e.g.
[31]), head-mounted accelerometers may give a better
indication of vigilance, an important indicator of stress management in many terrestrial animals [44–49]. This motivated the comparison of the resolution of data from both head (vigilance) and torso-mounted accelerometers (energy expenditure) in the same context and directly assess trade-offs associated with behaviour detection for a largely inactive model species (Fig. 1). Our study encompassed two successive breeding seasons, during which time individuals were exposed to varying environ-mental and animal density conditions across years on the breeding colony that may confound an in situ accelerom-etry study. As grey seals are typically site faithful [50], the amount of variability and repeatability between years for accelerometry feature characteristics measured in repeat capture females were quantified as well as the amount of variance between individual females.
The main aim of this study was to build a useable etho-gram of behavioural states as derived from accelerome-ters during lactation to potentially extend to other efforts to study grey seals and other pinnipeds who exhibit a cap-ital breeding system. Video footage of female grey seals
was decoded using a very detailed ethogram of behav-iours as part of a larger effort to study grey seal ethology. These detailed behaviours were condensed into broader categories of 8 behavioural states and used to label the concurrent acceleration data collected during the 2015 and 2016 breeding seasons on the Isle of May, Scotland. Several females in 2016 were equipped with two acceler-ometers, one on the head and one on the torso, to evalu-ate the effect of placement on behaviour detection. Due to an unforeseen glitch in the firmware of the accelerom-eters, sampling rates differed between seasons (50 Hz in 2015; 25 Hz in 2016). Labelled accelerometry data were then used to train a random forest algorithm using a subset of training data (60%), with model performance assessed through the remaining data (40%) separately for each season. In order to examine trade-offs in behaviour detection with accelerometer placement, separate ran-dom forest models were constructed for a subset of indi-viduals who were tagged with both an accelerometer on the head and torso. Random forest model results from pooled data were also compared to results of random forests fit to each individual. This was done in order to compare and contrast the trade-offs in model accuracy and training data sample size. In addition, we wished to evaluate the stereotypy of behaviours for females recap-tured in two subsequent breeding seasons, with the 2015 data subsampled to match the sampling rate of 2016, by quantifying the amount of inter-individual variability present in the accelerometry features using variance and repeatability estimates.
Results
Using random forests, we were able to classify four of six core behaviours (Rest, Presenting/Nursing, Alert, and Flippering pup) reliably during lactation in grey seals (Table 1). Between years and accelerometer place-ment schemes, static behaviours (Rest, Presenting/Nurs-ing, Flippering pup) were consistently classified well based on measures of precision (true positive accuracy), recall (sensitivity), and F1 (the harmonic mean of Preci-sion and Recall) between training (60%) and testing data (40%). All non-Rest behaviours were misclassified to some extent as Rest, resulting in a high number of false positives (values in italics across the top row; Table 2). Accelerometers sampling at a higher frequency (50 Hz in 2015; Fig. 2) was better able to classify behaviours such as Alert than those sampling at a lower frequency (25 Hz in 2016; Table 3), resulting in an F1 of 45% greater for 2015. However, torso-mounted accelerometers gener-ally performed better than head-mounted accelerom-eters on many of the static behaviours associated with lactation, such as Presenting/Nursing and Rest, despite the lower sampling rate. This resulted in F1 being 29%
Fig. 1 Example of accelerometers mounts for female grey seals.
Example of attachment set up for a a head-mounted accelerometer,
and b a torso-mounted accelerometer in addition to a head mount,
contained within a custom-designed ballistic nylon footprint on a female grey seal. Tag-frame axes labelled with arrows pointing in direction of positive acceleration values for each axis (X, Y, and Z).
Each accelerometer was configured to measure ± 2 g at 50 Hz (2015)
greater for accelerometers mounted on the torso against
those mounted on the head in 2016 (Table 3).
Locomo-tion events, however, were completely undetected in the random forest models for torso-mounted accelerometers. Error estimates and out-of-bag errors (bootstrapped samples from random forest model building) against number of trees grown can be found in the supplemen-tary materials (see Additional files 1–3).
Of the feature variables calculated to summarize the acceleration data (see definitions and derivations in Table 4), components relating to static acceleration (those relating to body posture) were found to be the most important for classifying behaviours. According to random forest models, stZ, stX, stY ranked as top three most important variables, followed by Pitch and Roll relative to the decreasing Gini index (Fig. 3). Gini will approach zero as each of the branches contain a single behavioural category; therefore, a greater decrease in mean Gini indicates that the feature variable in ques-tion is more important for splitting these branches and differentiating the behaviours within the random forest Table 1 Ethogram of female grey seal behaviour during lactation
Behaviours observed in lactating grey seals (n= 53) over two breeding seasons sampled over 137 h of video data. Behaviours in italics were excluded from the final analysis due to their extremely rare occurrence in the video footage (< 2 min per individual in most cases) and inconsistent feature characteristics in the accelerometer signal. Behavioural categories were largely adapted from [38, 51, 52]. The mean proportion of time in each behaviour across individuals (prop ± standard deviation) is included to give an indication as to the approximate time and variability for each behavioural state
Behaviour Description Prop.
Rest Seal is motionless, head on ground 0.581 ± 0.21
Alert Seal is stationary, head is up and moving, may look at pup 0.257 ± 0.15
Presenting/Nursing Female is rolled laterally so that nipples are presented to pup; pup may be nursing 0.075 ± 0.06
Flippering pup Female using fore-flipper to lightly stroke/scratch pup 0.021 ± 0.02
Misc. mother–pup interaction Any other active interaction between female and pup 0.009 ± 0.01
Locomotion Directed movement > 0.5 body lengths; seal is moving on ventral surface using fore- and hind-flippers 0.014 ± 0.03
Comfort Movement Female performing low intensity movements that do not change geographic location (< 0.5 body lengths) 0.053 ± 0.02
Social/aggression Any non-aggressive behaviour such as nosing other females (social), or aggressive interaction such as open-mouth
threats or biting/lunging (aggression) 0.017 ± 0.02
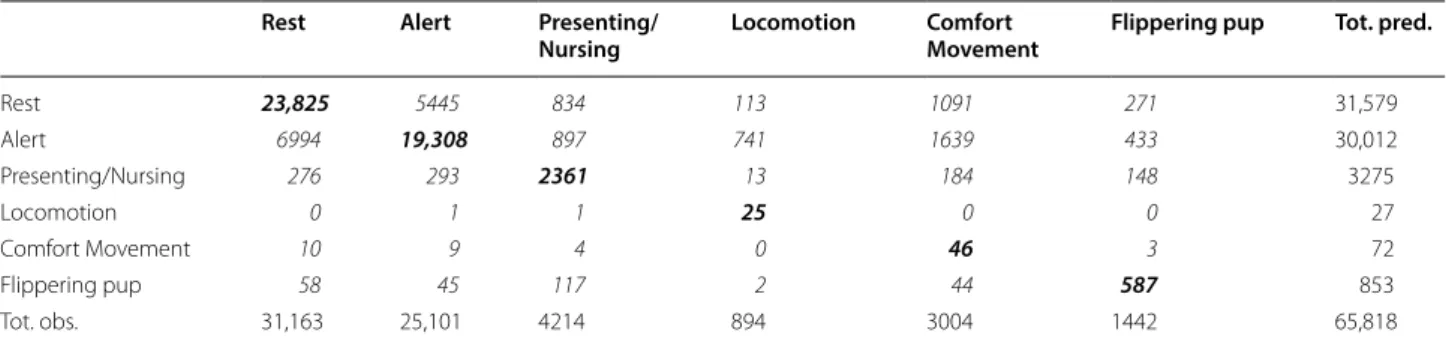
Table 2 Confusion matrix of behaviour classified from random forests
Confusion matrix of classified discrete feature windows (each 1-s wide) showing the predicted behaviours (rows; originating from random forest classification) against the observed reference behaviours (columns; originating from the focal video data) for accelerometers mounted on the head in 2015 (50 Hz). Behaviours included Rest, Alert, Presenting/Nursing, Locomotion, Comfort Movement, and Flippering pup. Values across the diagonal (bold italic) represent those behaviours that were correctly identified, true positives, while those in italics represent false positives (rows) and false negatives (columns)
Rest Alert Presenting/
Nursing Locomotion Comfort Movement Flippering pup Tot. pred.
Rest 23,825 5445 834 113 1091 271 31,579
Alert 6994 19,308 897 741 1639 433 30,012
Presenting/Nursing 276 293 2361 13 184 148 3275
Locomotion 0 1 1 25 0 0 27
Comfort Movement 10 9 4 0 46 3 72
Flippering pup 58 45 117 2 44 587 853
Tot. obs. 31,163 25,101 4214 894 3004 1442 65,818
Rest Alert
Nursing
Locomotion Comfort
Movement Flipper Pup
0 0.2 0.4 0.6 0.8 1
0.5 0.55 0.6 0.65 0.7 0.75 0.8 0.85 0.9 0.95
Recall
Precision
Fig. 2 Precision and recall for head-mounted accelerometers. Scatter plot of precision and recall for the random forest model for head-mounted accelerometers for 2015 (sampled at 50 Hz) on lactating grey seals. Behaviours include Rest, Alert, Presenting/ Nursing, Locomotion, Comfort Movements, and Flippering pup as
Table 3 C omparison of b eha viour classific ation acr oss ac celer omet er moun ts Pr ecision (positiv e pr edic tiv e v alue), R ecall (sensitivit
y), and F1 (har
monic mean of P
recision and R
ecall) f or R est , A ler t, P resen ting/Nursing , L oc omotion, C omf or t M ov emen
t, and F
lipper
ing pup beha
viours as defined
in T
able
1
modelled using a r
andom f
or
est f
or 2015 head-moun
ted
, 2016 head-moun
ted
, and 2016 t
orso
-moun
ted ac
celer
omet
ers using da
ta pooled acr
oss all individuals
. F1 v
alues when r
andom f
or
ests ar
e fit t
o
individuals (‘F1 (I
ndiv
.)’) ar
e included f
or c
ompar
ison, though only a small subset of individuals had sufficien
t da
ta in all beha
viour
al ca
tegor
ies t
o build a model
. V
alues closer t
o 1 indica
te bett
er model per
for
manc
e
for each beha
viour ca
tegor
y.
Values in par
en
theses indica
te the change in pooled F1 v
alues bet
w
een 2015 and 2016 as w
ell as bet
w een ac celer omet er moun t c onfigur ations f
or the 2016 head- and t
orso -moun ted ac celer ometr y da ta, r espec tiv ely . L oc
omotion bouts w
er
e c
omplet
ely undet
ec
ted in the 2016 t
orso -moun ted ac celer omet ers Beha viour
2015 Head moun
t (50 H
z)
2016 Head moun
model [53]. Summaries of these top five feature varia-bles with respect to behaviour can be found in the addi-tional files (see Addiaddi-tional file 4) as well as a list of full Gini index rankings of all features (Additional file 5). Power spectrum densities in all acceleration dimen-sions and those pertaining to VeDBA and VeDBAs were also very important (Additional file 5).
The effects of year and individual on the top feature variable, stZ, were modelled as a generalized linear mixed effects model with maternal post-partum mass a fixed effect to account for the potential influence of inter-annual variation in cost of transport associated with changes in mass between years. The variance of these two random effects, individual and year, were computed over 1000 bootstrapped samples using the package ‘rptR’ for repeat capture females in R [63, 64]. Overall, Present-ing/Nursing and Comfort Movement were found to vary greatly between individuals for the top feature variable, stZ, for torso-mounted data (Fig. 4). The variance com-ponent due to individuals was 12.2 ± 5.3%, for
Present-ing/Nursing and 21.2 ± 9.6% for Comfort Movement
across bootstrapped samples (Table 5). Other behaviours, however, showed less than 5% variance. No variance was explained by the effect of year across bootstrapped samples. However, top feature variables most likely to be associated with the position and movement mechan-ics for each behaviour appear to be repeatable across individuals, indicating varying degrees of stereotypy (Table 5). Alert and Locomotion, largely upright behav-iours, appear to be consistent for each seal with respect
to stZ, while Rest and Presenting/Nursing, where the
head is most often tilting in a downward direction, were consistent and repeatable with respect to stX (Table 5). Flippering pup was found to be highly significant and repeatable within individuals between years with respect to Roll, potentially indicating a side preference and a high degree of stereotypy (adjusted-R= 0.925; D= 1070, p < 0.001 as determined from a likelihood ratio test). This led to evidence that some females lay preferentially on Table 4 Summary of feature variables extracted from acceleration data
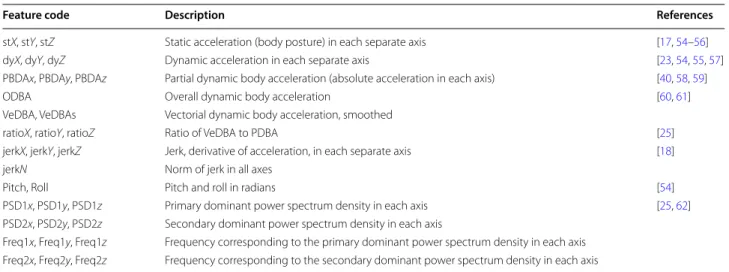
Summary of feature variables used to classify behaviour through machine learning methods. All feature variables, with the exception of those relating to power spectrum density and frequency (e.g. PSD1x, Freq1x), were summarized according to their mean value over 1-s windows of time (50 samples at 50 Hz, 25 at 25 Hz). Power spectrum and frequency elements (PSD1x–Freq2z) were derived over a 3-s moving window (1-s overlap on either side) to minimize spectral leakage
Feature code Description References
stX, stY, stZ Static acceleration (body posture) in each separate axis [17, 54–56]
dyX, dyY, dyZ Dynamic acceleration in each separate axis [23, 54, 55, 57]
PBDAx, PBDAy, PBDAz Partial dynamic body acceleration (absolute acceleration in each axis) [40, 58, 59]
ODBA Overall dynamic body acceleration [60, 61]
VeDBA, VeDBAs Vectorial dynamic body acceleration, smoothed
ratioX, ratioY, ratioZ Ratio of VeDBA to PDBA [25]
jerkX, jerkY, jerkZ Jerk, derivative of acceleration, in each separate axis [18]
jerkN Norm of jerk in all axes
Pitch, Roll Pitch and roll in radians [54]
PSD1x, PSD1y, PSD1z Primary dominant power spectrum density in each axis [25, 62]
PSD2x, PSD2y, PSD2z Secondary dominant power spectrum density in each axis
Freq1x, Freq1y, Freq1z Frequency corresponding to the primary dominant power spectrum density in each axis
Freq2x, Freq2y, Freq2z Frequency corresponding to the secondary dominant power spectrum density in each axis
one side of their body (as indicated by Roll) during the Flippering pup behaviour, potentially indicating later-alization given its highly significant repeatability (Fig. 5). Four of the females were found to preferentially lay on their right side, where Roll was significantly less than 0 as determined through a one sample signed rank test (‘0J’:
V= 148, p < 0.001; ‘74,789’: V= 1017, p < 0.001; ‘74,904’:
V= 3598, p < 0.001; and ‘74,962’: V= 1207, p < 0.001; see Fig. 5). Likewise, five additional females were found to preferentially lay on their left side, where Roll was signifi-cantly greater than 0 as determined through a one sample signed rank test (‘45,447’ V= 145,710, p < 0.001; ‘58,038’:
V= 46,524, p < 0.001; ‘74,920’: V= 475,420, p < 0.001; ‘72,146’: V= 1,125,800, p < 0.001; and ‘4H’: V= 84,251,
p < 0.001; see Fig. 5).
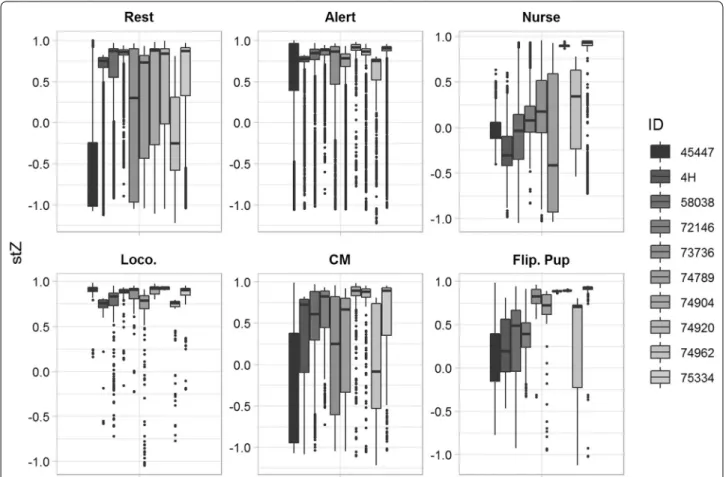
Fig. 4 Individual variability of behaviours with respect to static acceleration in the Z-axis. Boxplot of each behavioural group (Rest, Alert, Presenting/ Nursing (Nurse), Locomotion (Loco.), Comfort movements (CM), and Flippering pup (Flip. Pup)) with respect to static acceleration in the Z-axis (stZ) for torso-mounted accelerometers, the feature variable found to be most important in differentiating behaviour in the final random forest model. A high degree of variability existed between individuals and would likely contribute to a lower Precision and Recall when fitting random forests using pooled data
Table 5 Variance and repeatability estimates
for individual ID
Variance explained by individual ID across pooled data of top feature variable, stZ. Variance and standard error (SE) of the random effect of individual ID were estimated over 1000 bootstrapped samples within a generalized linear mixed effects model using the ‘rptR’ package in R [63], adjusted for maternal post-partum mass for repeat capture females (n= 11). No variance was explained by the random effect of year. Repeatability (adj.-R) for each behaviour was estimated with specific feature variables (Feat. Var.) corresponding to each behaviour using the same mixed effect model structure. Those repeatability estimates that were significant as determined through likelihood ratio tests are labelled with an (*)
Behaviour Variance SE Feat. var. adj.-R
Rest 0.042 0.019 stX 0.373
Alert 0.042 0.020 stZ 0.295
Presenting/Nursing 0.122 0.053 stX 0.600
Locomotion 0.037 0.018 stZ 0.248
Comfort Movement 0.212 0.096 Pitch 0.619
Discussion
Four behaviours, representing upwards of 90% of a lactat-ing female grey seal’s activity budget, were classified well using accelerometry. Overall, several core behaviours of grey seals during lactation were resolved more success-fully than others and the reasons varied. Behaviours that were largely stationary, such as Rest and Presenting/ Nursing, were best classified in our random forest model. We were also able to reliably classify a form of mother– pup interaction, Flippering pup, with many females showing a specific bias towards left- or right-side posi-tioning, potentially indicating a form of lateralization. Our two movement behaviours of interest, Locomotion and Comfort Movement, were poorly classified regard-less of sampling rate (year) or accelerometer placement, despite being among the most popular behaviours to classify in the literature across taxa [54, 65–67]. Torso-mounted accelerometers generally performed better than head-mounted accelerometers on the same individuals, but a higher sampling rate still achieved better classifica-tion for most behaviours. While a higher sampling rate may have achieved better classification overall at the cost
of a shorter deployment time, especially with the con-sideration of technical issues from tag malfunction in this study, we were still able to resolve a coarse level of behaviour with 4 of 6 target behaviours classified reliably. It was notable that individuals differed significantly, as indicated by individual ID contributing a large portion of variance in modelling. Individuals were largely consistent within themselves, however, in the mechanics of behav-iour between years.
Limitations of behavioural classification
Random forests have been used to classify behaviour in a wide range of taxa, including domestic sheep (Ovis aries, [68]), Eurasian beavers (Castor fibre; [69]), brown hares (Lepus europaeus; [24]), puma (Puma concolor; [70]), griffon vultures (Gyps fulvus; [32]), and other pinniped species (e.g. [40]). In all these studies, only three or four behavioural states with extremely disparate feature char-acteristics could be discriminated successfully, as was the case in the current investigation. While random forests computationally intensive to train, they take much less time to classify new behavioural data and are generally robust given their two layers of randomness in classifica-tion [53]. Unsurprisingly in the estimates of error across trees (Additional files 1–3), movement behaviours (Loco-motion and Comfort Movement) with the poorest Pre-cision and Recall also had the highest error rates. Some on-land behaviours of interest in female grey seals may be too variable in execution (amplitude of signal) and dura-tion (presence in time) to classify accurately given the sensitivity of the accelerometers within the current study design in grey seals. In signal theory, random signals as might arise from a behaviour like Comfort Movement are very difficult to characterize [71]. These signals are often contaminated with multiple spectral densities and frequencies that will vary in magnitude over time. Often these signals violate the assumptions of transforms, such as the fast Fourier transform used here, that may lead to inconsistent features, even when properly windowed through more advanced signal processing methods; it may not be possible to accurately and consistently extract some of the behaviours of interest from acceleration data, even with the addition of more feature variables.
Stationary behaviours during lactation
Overall, static acceleration and its subsequent compo-nents were considered the most important features for discriminating behaviour. Rest and Presenting/Nurs-ing were among the best classified on both head- and torso-mounted accelerometers (Precision of 69–75% and 72–80%, respectively, and Recall of 76–93% and 19–56%, respectively). These behaviours involve extensive periods of little to no movement, with only periodic adjustments
Fig. 5 Individual differences in side preference for Flippering pup behaviour. Boxplot of static acceleration in the Y-axis, as represented by the derivative Roll, with respect to individual for repeat capture females. Some females appear to show preference for being
positioned on the right (values towards − 1) or the left (values
towards + 1), indicating individual lateralization in a female–pup
of body position lasting for brief periods (e.g. Comfort Movements). Resting, and other static behaviours, is often the most easily identifiable behaviour as found in a variety of taxa through accelerometry [70, 72, 73]. Rest and Presenting/Nursing behaviours represent the key trade-off in energy conservation in lactating phocids, maximizing the transfer of finite energy stores to the pup [39, 74–78]. Rest and Presenting/Nursing represent most (65–90%) of a female grey seal’s activity budget in the wild [38, 79–81]. In the current study, these two behav-iours represented almost half of the testing data (Table 2). As capital breeders, grey seal mothers do not return to sea to forage and supplement their energy stores [82]. Resting often seems to be viewed in ethology as the left-over period of a behavioural activity budget. Grey seals of both sexes must budget time spent resting in order to maximize their energy allocation to breeding [39, 83, 84]. For male grey seals, increasing time spent resting may extend tenure within a key breeding territory as they may spend several weeks on the colony without supplemental energy income [85].
A key aim of many studies of lactating phocids is to track the energetics of reproduction. While Rest can be variable in overall body positioning in grey seals, Present-ing/Nursing is stereotypical as indicated by its relatively high repeatability, with females alternating regularly between lying on the right or left side to maximize access to both teats as indicated by the wide range of the static acceleration signal across years (Additional file 4). Mater-nal expenditure during lactation is most accurately quan-tified by the fat and protein content of milk, overall milk output, or enzyme activity levels as an indication of the female’s ability to mobilize fat [82, 86, 87]. These previous studies often involved many repeated sampling events over the lactation period that potentially cause distur-bance to both the female and her pup. When repeated physiological samples are unavailable, researchers often calculate mass transfer efficiency by measuring the ratio of the amount of maternal mass lost to the mass gained by the pup based on two capture events at the beginning and end of lactation [39]. Accelerometers may give a use-ful behavioural estimate of maternal effort in nursing to compare across populations, especially with respect to topographical considerations, tidal effects, or the effect of disturbance. While not directly useable as a measure of discrete energy transfer between females and pups, this behaviour may only be a useful indication of energetic differences relating to extreme outliers of low mass trans-fer efficiencies.
The stationary pup interaction in the form of Flipper-ing pup was also classified well, irrespective of accel-erometer sampling protocols. This behaviour also had the lowest calculated inter-individual variability and the
highest significant repeatability score with respect to body position. While many other pup-directed behav-iours can be identified through conventional behavioural observation, this was the only other maternal behaviour that was reliably classified outside of Presenting/Nurs-ing. Similar to Presenting/Nursing, females often engage in Flippering pup behaviour while lying on one side or the other, repeatedly stroking or scratching the pup. While this behaviour involves a similar body position to that of Presenting/Nursing or Rest, there is a slight average increase in the frequency associated with the x-axis of movement with this behaviour, making it rela-tively stereotypical in feature space. As this behaviour is often observed preceding nursing events, this may be an important tool for further assessing patterns in maternal care. Interestingly, some females appear to be selective in choosing which side to lay on, likely using their opposite front flipper to stroke the pup, as indicated by the slight saturation towards positive acceleration (indicating right side preference; significant in four females) or negative acceleration (indicating left side preference; significant in five females) in Roll (Fig. 5). Our definition of Flipper pup likely broadly defines a class of movement, but may contain differences in flippering associated with a posi-tive affecposi-tive state, generally preceding a nursing event, or with a negative affective state, such as stimulating a pup to move away from a threat source. It is likely that we would find stronger side preferences in this behav-iour associated with these different affective states. These results add to a growing body of evidence for preferen-tial lateralization in mammals, both for humans and others [88–90]. While we could detect no bias in Pre-senting/Nursing towards lying on the left or right, our result indicates that some grey seal females may exhibit a preference towards left handed flippering of the pup irrespective of affective state, which is consistent with research indicating that this will keep the pup in the left eye allowing control by the right hemisphere of the brain, associated kin recognition and threat recognition in mammals [88, 89, 91–93]. This intriguing evidence of handedness in female grey seals should be built upon by detailed studies of behaviour to assess degree of later-alization in other non-nursing mother–pup interactions and social contexts.
Vigilance during lactation
period of 1 min, an accelerometer might only character-ize short periods detectable movement, accurately clas-sified as Alert, interspersed with short periods of data that may behave as Rest. Given the fine-scale resolution of second-by-second behaviour, Alert may be indistin-guishable as a single state lasting several seconds or min-utes. In fact, Alert behaviours were most often mistaken for Rest. Some degree of post hoc thresholding might be necessary to improve the derivations of time-activity budgets of states over time.
Vigilance has been studied extensively in a variety of terrestrial species [44, 46, 48, 94]. Understanding how individuals allocate time (and consequently energy) to vigilance has been a major topic of study in behavioural ecology. Often in ungulates and other prey species, this represents a trade-off associated with balancing time foraging and acquiring energy (head-down) and look-ing out for potential sources of danger (head-up; [21,
49, 68]). Studying the functions of vigilance has led to insight into the evolution of group living and predator– prey dynamics (e.g. [95, 96]). Even predators must bal-ance vigilbal-ance activity, balancing vigilbal-ance for threats and prey items alike [46, 47]. Grey seals, too, must balance the time that they spend vigilant watching out for threats to their young, though we are only able to comment on the amount of time spent in a general state of Alert. With no indication of context, it is impossible to comment on the functionality of accelerometer-derived vigilance activity. Most terrestrial studies evaluating vigilance have used collar-mounted accelerometers [97, 98]. Other types of Alert or even social and aggressive behaviours and contexts may be better classified with the placement of an accelerometer in a location with a greater variety of postural dynamics, such as being glued on to the neck behind the head. The extraction of context-specific types of alert behaviours may allude to fine-scale decision-making during this sensitive period of development for mother and pup.
Phocid locomotion on land
Perhaps surprisingly, Locomotion was not well classified in our grey seals on land. Identifying modes of locomo-tion is a popular aim in the accelerometry literature, from flight to running to swimming [16, 65, 99, 100]. Locomo-tion types are often bounded by various biomechanical pressures that limit their interpretation [101, 102] and are easily identifiable and separable by their spectral densi-ties and frequencies [70]. In other pinnipeds, differences in at-sea locomotion detected with tags mounted along the dorsal midline, often expressed as stroke frequency, are used as a reliable indicator of energetic expendi-ture [67]. Often, as in this study, frequency and spec-tral density elements are extracted using a fast Fourier
transform [103]. This transform assumes that the signal is stable in time and space in order to dissolve it into its spectral elements [62, 71]. Behaviours like swimming in marine mammals are often stable and can last over many minutes or hours. However, if a signal is too brief or inconsistent in execution, this transform is not likely to accurately detect changes in frequency and power; the signal may be missed entirely. In the case of grey seals on land, locomotion is typically brief as females tend to stay within a few body lengths of their pups, with only the rare long-distance trip to a pool of water [41, 42]. In total, Locomotion only comprises about 1% of a female’s activity budget, even across different seal breeding colo-nies where topographical differences may alter locomo-tory needs (e.g. [3, 81]). Generally grey seals appear to limit the time spent locomoting, likely as a mechanism for conserving energy and to avoid being away from off-spring [38]. Female grey seals must prioritize maximiz-ing energy stores upon arrival to a breedmaximiz-ing colony to maintain themselves and nourish their pup during lac-tation while fasting [52]. While Locomotion was clearly present within the accelerometry signal upon visual inspection, with individual ‘steps’ visible, it generally was missed entirely by our classification algorithms as indi-cated by a high precision (92%) and extremely low recall (5.4%) when sampled at the highest rate in 2015. In addi-tion to being brief, grey seal Locomoaddi-tion on land may not be stereotypical enough to accurately classify when moving over short distances as females will often alter-nate between vigilance and directed movement, as well as being able to locomote while still on their side. Even though PSD was an important predictor of behavioural classification in the current study, Locomotion was only identifiable in head-mounted accelerometer deployments and was often confused with Alert or Rest behaviours, but very poorly classified (Table 2). Seal locomotion on land, especially at slower speeds, is typically led by the head and forelimbs, rather than the centre of mass. This may explain in part why Locomotion was marginally bet-ter classified in the head-mounted acceleromebet-ters, rather than on the torso. It may be possible for accelerometers mounted on the torso, but sampling at a higher rate to capture the more subtle movements, to accurately detect Locomotion and subsequent energy usage on land, but may still suffer from the confounding effects discussed above.
poor classification Precision and Recall when attempt-ing to separate groomattempt-ing behaviour when the individual was either the actor (grooming another) or the receiver (being groomed by another; [25]). Another study in cap-tive elephants showed that although differences in affec-tive state could be discriminated, acceleration needed to be sampled at extremely high levels (1000 Hz) in order to elucidate minute differences in postural dynamics [104]. Given the inherent trade-offs in battery longevity, storage capacity, and sampling rate as well as best practice rec-ommendations for tagging, it is unlikely that this type of highly sensitive measurement could yet be applicable in a wild setting. Torso-mounted accelerometers show prom-ise in extracting key behaviours while seals are on land, though a higher sampling rate that was used here may be necessary to classify behaviours with greater Precision and Recall. In addition, a higher sampling rate may be able to highlight minute differences in postural dynam-ics that may improve in the identification of contextual interactions in grey seals. Nevertheless, the resolution of behaviour identified in the current study is comparable to other previous efforts to classify behaviour in various other vertebrates, such as [13, 23, 40, 59, 66].
When examining inter-annual differences in behav-ioural mechanics for repeat capture females, it was found that individual ID included as a random effect explained a relatively high amount of variance. We found that while there was clear inter-individual differences in behaviour in certain behaviours, females were largely consistent within themselves between years. For comparison, we fit-ted random forests to individual seals and indeed found higher F1 values across the board for all behaviours. While building random forests for each individual cer-tainly overcomes this inter-individual variability, clearly apparent in Fig. 4, with respect to behavioural mechanics, only a small subset of the individuals actually had enough training data to build a random forest for all 6 behaviours investigated here. One of our main aims by pooling data from all individuals was to increase the overall sample size of behavioural reference data, especially with the goal to overcome the difficulty of observing behaviour in a wild context without the use of captive surrogates. As with the results presented here, researchers must con-sider the trade-offs with data availability (in either a wild context or with captive surrogates) and random forest model accuracy (fitting to an individual or pooling data) within the context of the study at hand.
While the exact reason for such a high amount of vari-ance is unclear, differences in substrate within and among study locations on the colony likely contributed to inter-individual differences and may have confounded clas-sification of behaviour from accelerometers, even when every effort is made to tag the same individuals. Care
should be taken in future work to consider the over-all effect of individual variability, especiover-ally associated with the surrounding context, when classifying behav-iour using accelerometers (e.g. [40]). Several other stud-ies have pointed out the potential confounding effects of environment in dictating the overall body position of an individual [54, 99]. Static acceleration was one of the most important predictors of behaviour in the favoured random forest model classifying our 6 behavioural states. While female grey seals tended to return to simi-lar locations on the colony between years, the topogra-phy of the island is highly variable and has already been shown to be an important consideration in the behaviour of this species [3, 50, 79]. It is unclear how or whether the effect of topography on body position and dynamic movement can be addressed or corrected for without the application of more sensors to model movement within quantified fine-scale topography, such as the addition of magnetometers and GPS (e.g. [105]). Individuals did vary significantly within themselves with respect to Present-ing/Nursing within static components of acceleration. Rather than being a mechanistic error, this likely indi-cates an attempt by females to maximize access to milk, ensuring the pup has fairly equal access to nipples dur-ing suckldur-ing bouts. Separatdur-ing left and right side Present-ing/Nursing may improve classification. In addition, it is more than likely that higher Precision and Recall might be achieved if the behaviours were defined exclusively by their mechanics. This would, however, be at the risk of losing what little contextual information is contained in the behaviours that were attempted to be classified, which, arguably, is key to understanding the functions of such behaviours.
Conclusions
be achieved by attempting to classify fewer behaviours that are defined exclusively by their mechanics, but at potential loss of contextual and social information. It has also been shown that individuals may vary in the execu-tion of behaviours in a wild context, supporting previous work that has flagged discrepancies within training data sets. Future work should consider this when training a classification algorithm using only a handful of animals as this may lead to poor detection in subsequent deploy-ments. It is our hope that the results presented here may inform work in other species for classifying behaviour during lactation in other phocid seals.
Methods
Study animals and accelerometer deployments
This study focused on lactating adult female grey seals on the Isle of May in Scotland (56.1°N, 2.55°W), located in the outer Firth of Forth and managed by Scottish Natu-ral Heritage as a National Nature Reserve. Adult female grey seals typically begin to arrive on the island in early October to pup and mate, with peak density around mid-November and slowly declining until mid-December [106]. Adult female grey seals were sampled both early and late in their approximate 18-day lactation period [39,
106, 107]. Accelerometer attachment took place at the initial sampling event, with removal at the final handling event. Fifty-three female grey seals were equipped with small data-logging accelerometers (AXY-Depth, Tech-noSmart Europe, Italy) during the core of the lactation period (10.7 ± 2.7 days) for the 2015 and 2016 breeding seasons (n= 11 females recaptured in successive breed-ing seasons). All individuals durbreed-ing the 2015 and 2016 seasons were equipped with an accelerometer mounted on the head, while 10 individuals in the 2016 season were additionally equipped with an accelerometer on the torso, mounted roughly between the shoulder blades (Fig. 1). Tags were housed in custom-designed ballistic nylon pouches attached onto dry pelage using superglue (Loctite, formula 422; Fig. 1). Due to an unforeseen glitch in the firmware of the accelerometers, sampling rates dif-fered between seasons (50 Hz in 2015; 25 Hz in 2016). This allowed us to capture a seal’s fastest movements that last between 0.5 and 1 s (e.g. head lunges associated with intraspecific interactions).
Derivation of accelerometry features
Acceleration signals were processed to derive 33 separate feature variables measured in all three axes of movement X, Y, and Z [54, 55]. Static
accelera-tion (stX-Z), the gravitational component indicating
position and posture in each axis of movement, was calculated using a moving average filter over a 3 s
overlapping window, or 150 data points when sam-pled at 50 Hz (75 data points at 25 Hz; [17, 54–56]).
Dynamic acceleration (dyX–Z), the component due to
movement and posture dynamics of an individual, was then calculated by subtracting the static component from the raw acceleration in each axis [23, 54, 55, 57]. Partial dynamic body acceleration (PBDAx-z) was cal-culated as the absolute value of dynamic acceleration in each axis [40, 58, 59]. Overall, dynamic body accel-eration (ODBA) and vectorial dynamic body accelera-tion (VeDBA) were also calculated as,
We also included a smoothed vector of VeDBA (VeD-BAs), derived as a 3-s running mean as with static
acceleration [60, 61]. The ratio of VeDBA to PDBA
was also included to add the relative contribution of each axis of PBDA to the vector of movement [25]. The change in acceleration over time, the third derivative of position commonly referred to as jerk, was derived by taking the differential of each axis of acceleration. We also calculated the norm of jerk by taking the square root of the sum of the squared differential of accelera-tion in each dimension,
where fs is the sampling frequency in Hz and A is each axis of acceleration as outlined in [18]. Pitch and Roll in radians were derived by taking the arcsine of static acceleration in the heave (dorso-ventral movement) and sway (lateral movement) axes, respectively [54]. Once derived, these attributes were summarized by their mean over a 1-s window in order to match video observation resolution.
To characterize oscillations in dynamic body move-ment, elements of power spectral density and frequency were also calculated for each second of acceleration data using Fourier analysis using methodology laid out in [25]. A fast Fourier transform decomposes an accel-eration signal and translates it from a time domain sig-nal to a stationary frequency domain sigsig-nal whereby elements of frequency and power (amplitude) can be
extracted [62]. Traditional Fourier analysis assumes
that the signal continues indefinitely. Therefore, to avoid potential issues of spectral leakage and to sample enough of a data window to capture, cyclical behav-iours like Locomotion, spectral elements were calcu-lated over a window spanning 1 s on either side of the
ODBA=dyX
+
dyY
+
dyZ
VeDBA=
dyX2+dyY2+dyZ2
norm jerk=fs∗
current time point [62]. In order to summarize these windows, the first two maximum power spectral den-sity peaks (PSD) were extracted along with their associ-ated frequencies (Freq) in each axis of movement [25]. A summary list of feature variables can be found in Table 4.
Time-matching behaviours and training data sets
Over the deployment period, each individual was sam-pled for behaviour using a focal sampling approach for at least 3 dedicated sessions during daylight hours [1]. Videos were recorded using a digital high definition video recorder (Panasonic HC-V700 1920 × 1080 resolu-tion with 46 × zoom; Panasonic Corp.) on a tripod from at least 50 m away. Video footage for all individuals and years were decoded in real-time by the lead author (CRS) according to the ethogram of behavioural states as listed in Table 1 at a resolution of 1 s. Approximately 10% of the video footage was re-watched to check consistency in behavioural decoding, resulting in average difference in cumulative time spent in each behaviour of about 5 s per video (approximately 0.07 ± 1.8% difference in the resulting activity budget), with moderate agreement
(Cohen’s kappa = 0.57). Concurrent sections of
sum-marized attributes of acceleration data were extracted and time-matched to the 8 behavioural states to create a set of training data for each year and tag attachment type. Labelled data for 2015 head-mounted accelerom-eters totalled 45.7 h (nind= 29 individuals), while 2016 head- and torso-mounted accelerometers totalled 91.3 (nind= 24) and 65.7 h (nind= 10), respectively, averaging 7.36 ± 15.5 h of video footage for each behaviour across all years. The mean proportion of time spent in each behaviour from video footage (± standard deviation) is included in Table 1 for all study females.
Random forests
The random forest algorithm is a fairly recent develop-ment and extension of classification and regression trees [53]. Classification trees are typically built by assembling binary partitions along increasingly homogenous regions with respect to the desired classification [108]. These homogeneous splits, referred to as nodes, are continu-ously subdivided until there is no longer a decrease in the Gini impurity index, G (or in this case, it will approach zero as a single behaviour is included in the node):
where n is the number of behavioural classes and pi is the proportion of each class in a set of observations.
G=
n
i=1
pi(1−pi)
Random forest fits many of these classification trees to a data set, combining predictions from all trees to classify new data [25, 53, 108]. First, a training data set is sampled randomly with replacement, resulting in several boot-strapped samples. With each of these simulated data sets, the model grows one tree to classify the observations into different classes, or behaviours, by hierarchical decision-making down each node [53, 108]. This algorithm utilizes bootstrapped samples from the original data set to grow each individual tree, using a random selection of predic-tor variables, or in this case accelerometry features, to partition the data. Out-of-bag observations, those obser-vations not included in each bootstrapped sample, are then used to calculate model accuracies and error rates and then averaged across all trees. Random forests offer a great number of iterations, in the form of number of trees grown, and several layers of randomness in order to build a robust and powerful tool for classification of new data, while limiting overfitting and problems associated with unbalanced data sets, as we might find in a seal’s activ-ity budget where rest often dominates the activactiv-ity budget (e.g. [25, 38]). Random forests also have the advantage of allowing for the assessment of variable importance by way of subtracting the parent variable Gini index value relative to the next two subsequent Gini index val-ues for each feature variable. For this machine learning algorithm, the data were split into a 60/40% training and testing sets and grew 500 trees using the ‘randomForest’ package in R [109].
Classification and assessment of random forests
To compare model performance in each of the machine learning algorithms used in this study, Precision, Recall, and the F1 statistic were calculated from the result-ing confusion matrices as produced from each of the cross-validations used with the testing data sets. Follow-ing cross-validation, resultFollow-ing values of true positives (correctly classified positive values, TP), false positives (incorrectly classified positive values, FP), and false nega-tives (incorrectly classified values that were negative, FN) for each behavioural category were used to calculate Pre-cision, Recall, and F1 [110]. Precision, also referred to as the true positive accuracy, was defined as the proportion of positive behavioural classifications that were correct [57], and was calculated as;
Recall, also known as sensitivity, was defined as the proportion of new data pertaining to behaviours that were correctly classified as positive [57] and was calcu-lated as;
Precision= TP
The F1 statistic represents the harmonic mean of Preci-sion and Recall and was used as a metric for overall per-formance of each behavioural classification category as it computes the harmonic mean of both performance met-rics [110]. F1 was calculated as;
Values closer to 1 for all metrics stated above represent better model performance. Model creation and valida-tion were performed separately for the 2015 and 2016 season, as well as separately for head-mounted and torso-mounted accelerometers (2016 only), resulting in 3 sepa-rate random forest models. Variable importance plots for the random forest models were also examined.
Mechanics of behaviour
The repeatability of the mechanics of behaviour with respect to features that were found to be most important in random forest model building was also assessed across seasons for repeat capture females (nind= 11), something that is rarely available in non-captive individuals. Due to an unforeseen malfunction in the firmware of the accel-erometers, loggers had to sample at a lower rate in 2016 as previously mentioned. To achieve equivalent sampling rates between seasons, the 2015 accelerometry data were down-sampled by half when compared to the 2016 accel-erometry data. Generalized linear mixed effects mod-els were built to predict top feature variables that were deemed most relevant for each behaviour. Individual ID and year were included as random effects in the model. To account for the potential changes in cost-of-transport between years, individual estimated post-partum masses were added as a fixed effect R (package ‘nlme’; [111]). Variance and repeatability estimates associated with indi-vidual ID and year were calculated using the ‘rptR’ pack-age [63], calculated over 1000 bootstrapped samples. As a result of the inclusion of a fixed effect in this model, all repeatability measures are adjusted-R (adj.-R) as per [63]. Significance of repeatability was assessed through the use of a likelihood ratio test to compare to a model without the random effect within the package.
Recall= TP TP+FN
F1= 2 1
Precision+ Recall1
Additional files
Additional file 1. Random forest error plot for 2015 head-mounted accelerometers. Error plot from random forest models for classifying 6 behavioural states (x0: Rest; x2: Alert; x4: Presenting/Nursing; x5: Locomo-tion; x6: Comfort Movement; x7: Flippering pup) in 2015 head-mounted accelerometers (50 Hz) on female grey seals across 500 trees. Out-of-bag error estimates across number of trees shown dark purple line (OOB). Additional file 2. Random forest error plot for 2016 head-mounted accelerometers. Error plot from random forest models for classifying 6 behavioural states (x0: Rest; x2: Alert; x4: Presenting/Nursing; x5: Locomo-tion; x6: Comfort Movement; x7: Flippering pup) in 2016 head-mounted accelerometers (25 Hz) on female grey seals across 500 trees. Out-of-bag error estimates across number of trees shown dark purple line (OOB). Additional file 3. Random forest error plot for 2016 torso-mounted accelerometers. Error plot from random forest models for classifying 6 behavioural states (x0: Rest; x2: Alert; x4: Presenting/Nursing; x5: Locomo-tion; x6: Comfort Movement; x7: Flippering pup) in 2016 torso-mounted accelerometers (25 Hz) on female grey seals across 500 trees. Out-of-bag error estimates across number of trees shown dark purple line (OOB). Additional file 4. Summary of feature variables for grey seal behavioural states. Summary statistics for top 5 most important feature variables from the 6 behavioural states classified using random forests on head-mounted acceleration data in 2015 (50 Hz). These top 5 variables identified from highest decrease in mean Gini. Feature variables are summarized by
median as well as 1st and 3rd quartile.
Additional file 5. Full variable importance table for random forest model. Full variable importance table for the random forest model classifying 6 behavioural states in female grey seals, representing decreasing mean Gini for each feature variable. Top 10 most important feature variables
plotted in Fig. 3. Feature variable derivations can be found as a summary
in Table 4.
Abbreviations
stX, stY, stZ: static acceleration in each X-, Y-, and Z-axis; dyX, dyY, dyZ: dynamic
acceleration in each X-, Y-, and Z-axis; PBDA: partial dynamic body
accelera-tion; ODBA: overall dynamic body acceleraaccelera-tion; VeDBA, VeDBAs: vectorial dynamic body acceleration, smoothed; PSD: power spectrum density; Freq:
frequency; TP: true positives; FP: false positives; FN: false negatives; adjusted-R:
repeatability.
Authors’ contributions
CRS, SDT, and PPP conceived the study. SDT led the field work with CRS. CRS collected the data and performed the analyses with support from SDT and PPP. CRS wrote the paper with input from all co-authors. All authors read and approved the final manuscript.
Author details
1 Department of Biosciences, Durham University, Durham DH1 3LE, UK. 2
Scot-tish Oceans Institute, University of St. Andrews, St. Andrews KY16 8LB, UK.
Acknowledgements
The authors wish to thank two anonymous reviewers for the improvement of this manuscript from earlier versions. The authors would like to acknowledge S. Moss for extensive help in the design and implementation of this project as well as coordinating field operations and animal handling along with the rest of the Isle of May field crew, especially M. Bivens, K. Bennett, K. Robinson,
and H. Wood. We would also like to thank Z. Fraser and J. Wells for helping to
collect the extensive video footage over the two field seasons.
Competing interests
The authors declare that they have no competing interests.
Availability of data and materials
Consent for publication
Not applicable.
Ethics approval
All applicable international, national, and/or institutional guidelines for the care and use of animals were adhered to in this study. All animal procedures were performed under UK Home Office project license #60/4009 and con-formed to the UK Animals (Scientific Procedures) Act, 1986. All research was approved ethically by the Durham University Animal Welfare Ethical Review Board as well as by the University of St. Andrews Animal Welfare and Ethics Committee.
Funding
Funding for this work was provided by the Durham Doctoral Studentship scheme at Durham University and supported by Natural Environment Research Council’s core funding to the Sea Mammal Research Unit at the University of St. Andrews.
Publisher’s Note
Springer Nature remains neutral with regard to jurisdictional claims in pub-lished maps and institutional affiliations.
Received: 4 May 2018 Accepted: 8 October 2018
References
1. Altmann J. Observational study of behavior: sampling methods. Behav-iour. 1974;49:227–67.
2. Witter LA, Johnson CJ, Croft B, Gunn A, Gillingham MP. Behavioural trade-offs in response to external stimuli: time allocation of an Arctic ungulate during varying intensities of harassment by parasitic flies. J Anim Ecol. 2012;81:284–95.
3. Anderson SS, Harwood J. Time budgets and topography: how energy reserves and terrain determine the breeding behaviour of grey seals. Anim Behav. 1985;33:1343–8.
4. Bishop AM, Lidstone-Scott R, Pomeroy P, Twiss SD. Body slap: an
innova-tive aggressive display by breeding male gray seals (Halichoerus grypus).
Mar Mamm Sci. 2014;30:579–93.
5. Culloch RM, Pomeroy PP, Twiss SD. The difference between night and
day: the nocturnal and diurnal activity budget of gray seals (Halichoerus
grypus) during the breeding season. Mar Mamm Sci. 2016;32:400–8. 6. Anderson SS. Day and night activity of Grey seal bulls. Mamm Rev.
1978;8:43–6.
7. Briffa M, Greenaway J. High in situ repeatability of behaviour indicates
animal personality in the beadlet anemone Actinia equina (Cnidaria).
PLoS ONE. 2011;6:e21963.
8. McGhee KE, Travis J. Repeatable behavioural type and stable domi-nance rank in the bluefin killifish. Anim Behav. 2010;79:497–507. 9. Twiss SD, Franklin J. Individually consistent behavioural patterns in
wild, breeding male grey seals (Halichoerus grypus). Aquat Mamm.
2010;36:234–8.
10. Arthur B, Hindell M, Bester MN, Oosthuizen WC, Wege M, Lea MA, et al. South for the winter? Within-dive foraging effort reveals the trade-offs between divergent foraging strategies in a free-ranging predator. Funct Ecol. 2016;30:1623–37.
11. Yeates LC, Williams TM, Fink TL. Diving and foraging energetics of
the smallest marine mammal, the sea otter (Enhydra lutris). J Exp Biol.
2007;210:1960–70.
12. Davis RW, Fuiman LA, Madden KM, Williams TM. Classification and behavior of free-ranging Weddell seal dives based on three-dimen-sional movements and video-recorded observations. Deep Sea Res Part II Top Stud Oceanogr. 2013;88–89:65–77.
13. Battaile BC, Sakamoto KQ, Nordstrom CA, Rosen DAS, Trites AW. Acceler-ometers identify new behaviors and show little difference in the activity
budgets of lactating northern fur seals (Callorhinus ursinus) between
breeding islands and foraging habitats in the eastern Bering Sea. PLoS ONE. 2015;10:e0118761.
14. Jeanniard-du-dot T, Guinet C, Arnould JPY, Speakman JR, Trites AW. Accelerometers can measure total and activity-specific energy expen-ditures in free-ranging marine mammals only if linked to time-activity budgets. Funct Ecol. 2016;31:377–86.
15. McClintock BT, Russell DJF, Matthiopoulos J, King R. Combining indi-vidual animal movement and ancillary biotelemetry data to investigate population-level activity budgets. Ecology. 2013;94:838–49.
16. Jeanniard-du-dot T, Trites AW, Arnould JPY, Speakman JR, Guinet C. Flipper strokes can predict energy expenditure and locomotion costs in free-ranging northern and Antarctic fur seals. Sci Rep. 2016;6:33912. 17. Skinner JP, Norberg SE, Andrews RD. Head striking during fish capture
attempts by Steller sea lions and the potential for using head surge acceleration to predict feeding behavior. Endanger Species Res. 2010;10:61–9.
18. Ydesen KS, Wisniewska DM, Hansen JD, Beedholm K, Johnson M, Madsen PT. What a jerk: prey engulfment revealed by high-rate,
super-cranial accelerometry on a harbour seal (Phoca vitulina). J Exp Biol.
2014;217:2239–43.
19. Watanabe YY, Takahashi A. Linking animal-borne video to accel-erometers reveals prey capture variability. Proc Natl Acad Sci USA. 2013;110:2199–204.
20. Viviant M, Trites AW, Rosen DAS, Monestiez P, Guinet C. Prey capture attempts can be detected in Steller sea lions and other marine preda-tors using accelerometers. Polar Biol. 2010;33:713–9.
21. Moreau M, Siebert S, Buerkert A, Schlecht E. Use of a tri-axial acceler-ometer for automated recording and classification of goats’ grazing behaviour. Appl Anim Behav Sci. 2009;119:158–70.
22. Soltis J, Wilson RP, Douglas-Hamilton I, Vollrath F, King LE, Savage A. Accelerometers in collars identify behavioral states in captive African
elephants Loxodonta africana. Endanger Species Res. 2012;18:255–63.
23. McClune DW, Marks NJ, Wilson RP, Houghton JDR, Montgomery IW, McGowan NE, et al. Tri-axial accelerometers quantify behaviour in the
Eurasian badger (Meles meles): towards an automated interpretation of
field data. Anim Biotelem. 2014;2:5.
24. Lush L, Ellwood S, Markham A, Ward AI, Wheeler P. Use of tri-axial accel-erometers to assess terrestrial mammal behaviour in the wild. J Zool. 2016;298:257–65.
25. Fehlmann G, O’Riain MJ, Hopkins PW, O’Sullivan J, Holton MD, Shepard ELC, et al. Identification of behaviours from accelerometer data in a wild
social primate. Anim Biotelem. 2017;5:6. https ://doi.org/10.1186/s4031
7-017-0121-3.
26. Pagano AM, Rode KD, Cutting A, Owen MA, Jensen S, Ware JV, et al. Using tri-axial accelerometers to identify wild polar bear behaviors. Endanger Species Res. 2017;32:19–33.
27. Hokkanen AH, Hänninen L, Tiusanen J, Pastell M. Predicting sleep and lying time of calves with a support vector machine classifier using accelerometer data. Appl Anim Behav Sci. 2011;134:10–5. 28. Grünewälder S, Broekhuis F, Macdonald DW, Wilson AM, McNutt JW,
Shawe-Taylor J, et al. Movement activity based classification of animal
behaviour with an application to data from cheetah (Acinonyx jubatus).
PLoS ONE. 2012;7:1–11.
29. Joseph J, Torney C, Kings M, Thornton A, Madden J. Applications of machine learning in animal behaviour studies. Anim Behav. 2017;124:203–20.
30. Ladds MA, Thompson AP, Kadar J-P, Slip DJ, Hocking DP, Harcourt RG. Super machine learning: improving accuracy and reducing variance of behaviour classification from accelerometry. Anim Biotelem. 2017;5:8.
https ://doi.org/10.1186/s4031 7-017-0123-1.
31. Brown DD, Kays R, Wikelski M, Wilson RP, Klimley AP. Observing the unwatchable through acceleration logging of animal behavior. Anim Biotelem. 2013;1:1–16.
32. Nathan R, Spiegel O, Fortmann-Roe S, Harel R, Wikelski M, Getz WM. Using tri-axial acceleration data to identify behavioral modes of free-ranging animals: general concepts and tools illustrated for griffon vultures. J Exp Biol. 2012;215:986–96.
33. Nishizawa H, Noda T, Yasuda T, Okuyama J, Arai N, Kobayashi M. Decision tree classification of behaviors in the nesting process of
green turtles (Chelonia mydas) from tri-axial acceleration data. J Ethol.
2013;31:315–22.