doi:10.5194/nhess-12-403-2012
© Author(s) 2012. CC Attribution 3.0 License.
and Earth
System Sciences
Instability indices and forecasting thunderstorms: the case of
30 April 2009
S. Tajbakhsh1, P. Ghafarian2, and F. Sahraian3
1Islamic Republic of Iran Meteorological Organization, Tehran, Iran
2Department of Meteorology, Science and Research Branch, Islamic Azad University, Tehran, Iran 3Atmospheric Science and Meteorological Research Center, Tehran, Iran
Correspondence to: P. Ghafarian (p [email protected])
Received: 15 September 2010 – Revised: 27 November 2011 – Accepted: 16 December 2011 – Published: 17 February 2012
Abstract. In this paper, one meteorological case study for
two Iranian airports are presented. Attempts have been made to study the predefined threshold amounts of some instability indices such as vertical velocity and relative humidity. Two important output variables from a numerical weather predic-tion model have been used to survey thunderstorms. The climatological state of thunder days in Iran has been deter-mined to aid in choosing the airports for the case studies. The synoptic pattern, atmospheric thermodynamics and out-put from a numerical weather prediction model have been studied to evaluate the occurrence of storms and to verify the threshold instability indices that are based on Gordon and Albert (2000) and Miller (1972).
Using data from the Statistics and Data Center of the Iran Meteorological Organization, 195 synoptic stations were used to study the climatological pattern of thunderstorm days in Iran during a 15-yr period (1991–2005). Synoptic weather maps and thermodynamic diagrams have been drawn using data from synoptic stations and radiosonde data. A 15-km resolution version of the WRF numerical model has been implemented for the Middle East region with the assistance of global data from University Corporation for Atmospheric Research (UCAR).
The Tabriz airport weather station has been selected for further study due to its high frequency of thunderstorms (more than 35 thunderstorm days per year) and the existence of an upper air station. Despite the fact that storms occur less often at the Tehran weather station, the station has been cho-sen as the second case study site due to its large amount of air traffic. Using these two case studies (Tehran at 00:00 UTC, 31 April 2009 and Tabriz at 12:00 UTC, 31 April 2009), the results of this research show that the threshold amounts of
30◦C for KI,−2◦C for LI and−3◦C for SI suggests the oc-currence and non-ococ-currence of thunderstorms at the Tehran and Tabriz stations, respectively. The WRF model output of vertical velocity and relative humidity are the two most important indices for examining storm occurrence, and they have a numerical threshold of 1 m s−1and 80 %, respectively. These results are comparable to other studies that have exam-ined thunderstorm occurrence.
1 Introduction
404 S. Tajbakhsh et al.: Instability indices and forecasting thunderstorms
levels over the Balearic Islands and an upper-level trough over mainland Spain.
Vertical velocity, relative humidity and wind shear, which can be retrieved from Numerical Weather Prediction (NWP) model output, are very useful products for diagnosing the structure of thunderstorms. Colquhoun (1987, 1998) intro-duced the threshold values of these variables that are needed for thunderstorm occurrence, and he explained thunderstorm occurrence in terms of a decision tree and has shown that a vertical velocity larger than 0.5 m s−1at 800 hPa and a rela-tive humidity larger than 75 % are suitable threshold values for thunderstorm occurrence.
Systematic methods to diagnose the atmosphere’s poten-tial to produce severe convective weather can be of great help to forecasters. The most notable of these systematic approaches, the methods developed by Gordon and Al-bert (2000) and Miller (1972), applied in this paper. The checklists and reference guides developed by Gordon and Albert, and Miller are specifically designed to aid in the di-agnosis of severe convective conditions.
Instability is a critical factor in the development of severe weather, and severe weather instability indices can be a use-ful tool when applied correctly to a given convective weather situation. Severe weather indices only indicate the potential for convection. A lifted index with a value of 0◦C is suffi-cient for severe weather development only if the dynamics are very strong. When the lifting index is−8◦C or less, severe weather can occur with very weak upper-air support (Hales, 1996). Some of the most common indices that are applied in the study of thunderstorms are used in this paper: the K Index (George, 1960), the Lifted Index (Galway, 1956), the Showalter Stability Index (Showalter, 1953), Total To-tals (Miller, 1972), the Severe Weather Threat Index (Miller, 1972), Convective Available Potential Energy (CAPE) and Convective Inhibition (CIN). A brief history of the applica-tion of these indices is described below.
In 1960, George introduced the relationship between KI and thunderstorm probability. According to his research, thunderstorms will occur with a 50 % probability if the KI value is 26◦C or more.
In 1956, Galway showed the critical values of LI for insta-bility and argued that a negative LI indicates that the bound-ary layer is unstable with respect to the middle troposphere. This instability represents an environment in which convec-tion can occur. Galway declared that LI values between−3 and−5◦C represent marginal instability. Showalter (1953) presented the threshold values of SI for thunderstorms, indi-cating that SI values from 0 to−4◦C are suitable for mod-erate thunderstorms. The Total Totals and SWEAT indices were described by Miller in 1972. A SWEAT index be-tween 300 and 400 indicates moderate thunderstorm activity, while a TT index between 50 and 55◦C shows the possi-bility of severe thunderstorm activity. Generally, tornadoes are possible with thunderstorms when the SWEAT index reaches more than 400 (Henz, 2009). CAPE values less than
300 J kg−1 show little or no convective potential, and CIN values greater than 200 J kg−1are sufficient to prevent con-vection (Knutsvig, 2009). Haklander et al. (2003) examined 32 different indices and parameters, especially in the Nether-lands, to gain statistical information on these parameters and compare their ability to forecast thunderstorms. Haklander and Delton (2003) have estimated the probability of a thun-derstorm as a function of various thunthun-derstorm predictors. They found that the thunderstorm probability depends on the following parameters (in order of importance): latent insta-bility (especially near the surface), potential instainsta-bility and conditional instability.
In the remaining sections of this paper, the synoptic con-ditions associated with thunderstorm events are reviewed for the two case studies. In addition, NWP model output and the threshold values of important thermodynamic instability indices for these two case studies are presented. Section 2 de-scribes the synoptic and upper-air data that are necessary to draw the synoptic, thermodynamic and climatological charts. Also in this section, the WRF model is described in more detail. The climatology of thunderstorm days is used to de-scribe the level of thunderstorm occurrence in Iran. This cli-matology has been analysed for a period of 15 yr, and the stations with the most and least thunderstorm days have been noted. The climatology of thunderstorm days in Iran is pre-sented in Sect. 3. In Sect. 4, two case studies are analysed using threshold values from NWP model output and thermo-dynamic indices for thunderstorm forecasting, and the simi-larity with other studies is shown. The verification results are discussed in Sect. 5. Finally, a discussion of the potential for these indices to improve forecasts is given in Sect. 6, along with possibilities for future improvements.
2 Data
Table 1. Parameterization of WRF model configuration.
Fully compressible no hydrostatic dynamics
15-km horizontal grid increment over Iran and 28 vertical levels Radiative upper-boundary condition that mitigates noise result-ing from reflectresult-ing gravity waves
Kain–Fritsch version 2 (Kain, 2004) cumulus parameterisation: month-long sensitivity tests showed this scheme produced the most realistic precipitation patterns and amounts compared to satellite-derived estimates
Lin et al. (1983) microphysics, which predicts the mixing ratio of four hydrometeor species (cloud droplets, cloud ice, rain, and snow)
Mellor-Yamada-Janjic PBL scheme (Janjic, 2002a,b). A set of multiday sensitivity experiments showed that this scheme is suitable over Iran.
Noah land surface model with four soil layers (Chen and Dud-hia, 2001a, b)
Cloud effects on radiative transfer, Goddard scheme for short-wave and Rapid Radiative Transfer Model (Mlawer et al., 1997) for longwave
WRF regional model were used in this analysis. Table 1 shows the parameterisations that were chosen for producing the best behaviour of the atmosphere within the boundary layer and for maximising the numerical stability. Azadi et al. (2009) show that this parameterisation configuration pro-vides good results over Iran.
3 The climatology of thunderstorm days in Iran
A thunderstorm occurs in response to synoptic-scale and mesoscale forcing. To develop a thunderstorm it usually needs warm and moist air at low levels, cool and dry air at up-per levels and a synoptic-scale disturbance. Under these con-ditions, thunderstorm formation is probable. In fact, thunder-storm development requires large instability, vertical forcing, water vapour convergence at low levels and a high convec-tive available energy; the synoptic-scale and mesoscale fea-tures described above favour these conditions. Several cli-matological studies have examined thunderstorms and their associated phenomena such as hail, heavy precipitation and severe winds. A study by Whiteman (2003) that considered the influence of orography on thunderstorms describes some of these climatological issues very well. Iran is located in a dry to semi-dry climate zone; therefore, moisture is gener-ally not plentiful, and a large number of thunder days are not expected. During the warm season, the Azores high pressure dominates over Iran via the Mediterranean Sea. The Azores high covers the area south of the Alborz Mountains, and sta-ble conditions cover all of Iran. During the cold season,
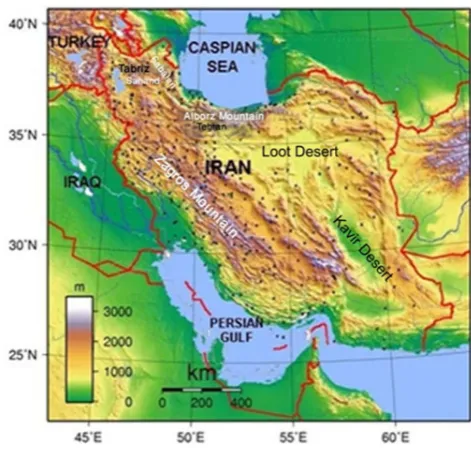
Fig. 1. Geographical position of Iran.
the westerlies are dominant over Iran. The westerlies steer Mediterranean disturbances toward Iran, causing instability and precipitation. Gheibi et al. (2003) presented temporal and spatial distributions of thunderstorms in Iran and showed that the annual distribution of thunderstorms is concentrated over the northwestern part of Iran. Thunderstorms usually occur during the spring and summer in Iran (Alijani, 2009), and for this reason, we selected our case studies in April. As noted earlier, the two airports (Tehran and Tabriz) are se-lected for further study due to their relatively large number of thunderstorm days and air traffic. Tehran is located on the southern slopes of the Alborz Mountains (35.7◦N, 51.4◦E). The city has a dry climate with warm summers and relatively cold winters. Although the Alborz Mountains are far from the Tehran station (approximately 70 km), the lifting effect of the mountains may intensify the vertical motion due to frontal convergence (Fig. 1). The Tabriz station (38.6◦N, 46.3◦E) is located in northwestern Iran. The Sabalan Moun-tains are located east of the city of Tabriz, while the Sahand Mountains are located south of the city (Fig. 1). Due to the orographic conditions, Tabriz has a cold and moist climate. Its topography provides favourable conditions for thunder-storm formation. Warm air rising and cold air sinking (con-vection) play a key role in the formation of severe thunder-storms. If the warm air at the surface is forced to rise, it will continue to rise because it is less dense than the surrounding air. In addition, it will transfer heat from the land surface to the upper levels of the atmosphere through the convection process. The orographic conditions cause thunderstorm for-mation by forcing air upward along the side of a mountain or large hill.
406 S. Tajbakhsh et al.: Instability indices and forecasting thunderstorms
13
Fig. 1. Geographical position of Iran
Fig. 2. Monthly average of 15 years period (1991-2005) thunder storm days for Tabriz (dark gray line) and Tehran (light gray line).
0 1 2 3 4 5 6 7 8 9 10
Jan. Feb. Mar. Apr. May Jun. Jul. Agu. Sep. Oct. Nov Dec.
N
o
. o
f TS
d
ay
s
Month
TABRIZ TEHRAN
Fig. 2. Monthly average of 15 yr period (1991–2005) thunder storm
days for Tabriz (dark gray line) and Tehran (light gray line).
stations have similar distributions that confirm the study per-formed by Alijani (2009). Figure 2 shows that there is a max-imum of thunderstorm days in May. Thunderstorm days de-crease during the summer and reach a small peak in October. The number of thunderstorm days peaks at approximately 9 and 4.5 days for Tabriz and Tehran, respectively.
A climatological study of thunderstorm events can help to identify airport stations with more thunder days. The pat-tern of thunderstorm days in Iran is shown in Fig. 3, which shows that thunderstorms are not common in Iran. Addition-ally, Fig. 3 shows that the minimum number of stormy days occurs at the Jask station (one of Iran’s southern islands in the Oman sea) with an average of 1.7 days annually and that the maximum number of stormy days occurs at the Makoo station in northwestern Iran with an average of 52 days an-nually. Examining Fig. 3 in the context of the climatological, meteorological and orographic conditions described above, a more detailed picture of Iran’s thunderstorm climatology can be seen. For example, the maximum in thunderstorm days in northwestern Iran can be attributed to the orographic fea-tures found in that region. In contrast, the central, eastern and southeastern parts of Iran have the minimum number of thunderstorm days due to the presence of the Loot and Kavir deserts, which have very little moisture. The highest num-ber of thunderstorm days occurs in the western half of the country, particularly in the northwestern part of the country where storms occur more than 20 days of the year. Stations with more than 30 thunder days, including Makoo, Safi-Abad Dezfool, Jolfa, Tabriz, Ahar, Sarab, Zanjan and Khoy, are mostly located in northwestern Iran. Stations with more than 45 stormy days are marked in Fig. 3. Additionally, more than 70 stations have less than 10 thunderstorm days annually. These stations are mostly located in the central and south-eastern portions of the country. There are approximately 16 days per year with thunderstorms at the Tehran station in Tehran. It is clear that the prediction of thunderstorm days is not a priority at airports with either a relatively small num-ber of thunderstorm days or a small numnum-ber of flights. For
14
Fig. 3. Climatology of thunderstorm days (annual) in Iran in the period of 1991 to 2005.
Fig. 4a. Surface chart include isobars with 2.5 mb intervals on 30 April 2009 at 00 UTC. Fig. 3. Climatology of thunderstorm days (annual) in Iran during
the period 1991 to 2005.
this reason, we study some of the most important indicators for identifying and predicting storms at the Tabriz Airport because of its large number of days with thunderstorms and at the Tehran Airport because of its large number of flights.
4 Case study of a thunderstorm event on 30 April 2009
In considering the relationship between synoptic features and thunderstorm probability, the most important empirical in-dices to consider for severe weather conditions (instability indices) are KI, LI, SI, TT and SWEAT. These instability in-dices were calculated for the Tabriz and Tehran stations at 00:00 UTC, 30 April 2009 and 12:00 UTC, 30 April 2009, respectively. The Tabriz thunderstorm event was observed to be less than 8 km from the station. WRF model output of ver-tical velocity, relative humidity and temperature were used to predict the thunderstorms. Gordon and Albert (2000) present two checklists for identifying and forecasting thunderstorms using NWP model output and instability indices. These crite-ria are based on studies by various researchers that took place during and after the 1970s.
4.1 Synoptic conditions
On 30 April 2009, a cold front passed over the northern half of Iran and produced a moderate thunderstorm with rain showers in parts of Iran including the Tabriz airport station at 00:00 UTC and the Tehran airport station at 12:00 UTC. The synoptic patterns and thermodynamic diagrams for this system were reviewed in detail.
Fig. 4. (a) Surface chart include isobars with 2.5 mb intervals on
30 April 2009 at 00:00 UTC. (b) Surface chart include isobars with 2.5 mb intervals on 30 April 2009 at 12:00 UTC.
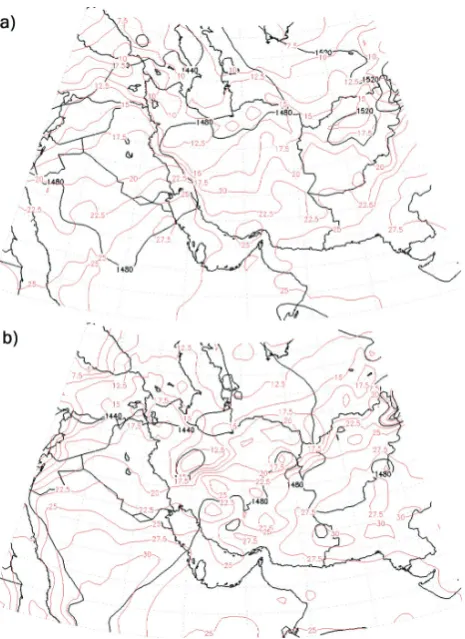
low pressure centre over the northwestern portion of Iran. A pressure gradient was present on the west coast of the Caspian Sea and on the southern slopes of the central Al-borz Mountains while there was a centre of high pres-sure (1015 hPa) in the western part of Iran (Fig. 4a). By 12:00 UTC, the pattern changed as the polar low deepened in the north and the Siberian high weakened (Fig. 4b). These conditions produced a pressure gradient in the southwest-ern portion of the Alborz Mountains. The surface pres-sure was 1011 hPa (1009 hPa) at 00:00 UTC and 1009 hPa (1005 hPa) at 12:00 UTC, while the dewpoint temperature was ∼10◦C (6◦C) at the Tehran (Tabriz) station at both times. At 00:00 UTC, the Tabriz station was affected by a ridge of high pressure, but the Tehran station was not yet affected. The 850-hPa chart shows an approaching low pres-sure trough in the northwestern strip of Iran at 00:00 UTC (Fig. 5a). Twelve hours later (Fig. 5b), the region was charac-terised by a thermal trough that extended from the northwest to the southern slopes of the central Alborz Mountains. This pattern provided appropriate conditions for warm advection in the mid-western parts of Iran and cold advection along the slopes of the Alborz Mountains. At 500 hPa, shallow
Fig. 5. (a) 850 hPa chart include contours with 40 m and isotherms
with 2.5◦C intervals, respectively, on 30 April 2009 at 00:00 UTC.
(b) 850 hPa chart include contours with 40 m and isotherms with
2.5◦C intervals, respectively, on 30 April 2009 at 12:00 UTC.
408 S. Tajbakhsh et al.: Instability indices and forecasting thunderstorms
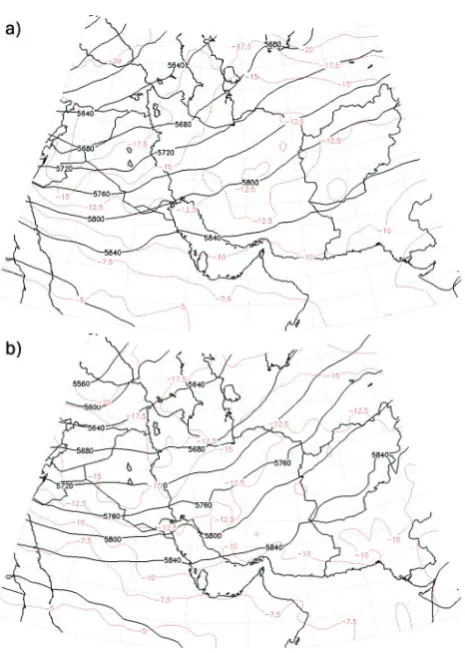
Fig. 6. (a) 500 hPa chart include contours with 40 m and isotherms
with 2.5◦C intervals, respectively, on 30 April 2009 at 00:00 UTC.
(b) 500 hPa chart include contours with 40 m and isotherms with
2.5◦C intervals, respectively, on 30 April 2009 at 12:00 UTC.
Table 2. Instability indices for Tehran and Tabriz stations on
30 April 2009.
Tehran station Tabriz station 30 April 2009 at 12:00 UTC 30 April 2009 at 00:00 UTC
value Index value Index
−2.95 LI 2.29 LI
−2.3 SI 2.17 SI
36.8 KI 26.4 KI
54.6 TT 49 TT
256 SWEAT 94.6 SWEAT
313.6 CAPE – CAPE
−17 CIN – CIN
4.2 Thermodynamic diagrams
To study the status of thunderstorm development more precisely, thermodynamic diagrams from the Tehran (12:00 UTC) and Tabriz (00:00 UTC) stations were reviewed. Atmospheric instability indices including
Fig. 7. (a) 300 hPa chart on 30 April 2009 at 00:00 UTC.
(b) 300 hPa chart on 30 April 2009 at 12:00 UTC.
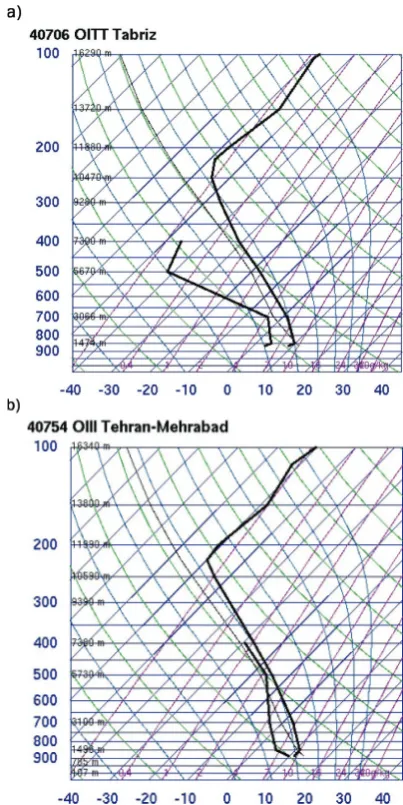
SI, LI, KI, SWEAT, TT, CAPE and CIN were calculated (Table 2). Because the Tabriz event did not occur exactly over the station at 00:00 UTC, the thermodynamic diagram shown in Fig. 8a does not contain considerable instability. There is no significant observed jet stream in the 200 to 300 hPa layer, and the values of the instability indices indi-cate a non-storm environment, which is shown in Table 2. Due to the lack of significant instability, we did not calculate CAPE or CIN at this station and time. By 12:00 UTC, Tehran had experienced a relatively significant storm; hence, the dewpoint and temperature profiles indicate unstable con-ditions (strong convergence of the temperature and humidity profiles) and a 60 knot wind velocity in the 200 to 300 hPa layer (Fig. 8b). Based on the criteria for thunderstorm occurrence from Galway (1956) and George (1960), the LI, KI and SI indices in Tehran at 12:00 UTC are acceptable for thunderstorm formation.
4.3 NWP model output
Table 3. Gordon severe weather check list for Tehran and Tabriz stations on 30 March 2009.
Severe weather parameters Indicators Answer Y/N
(Tabriz)
Answer Y/N (Tehran)
Low level moisture and temperature
Depth of low level moisture now (or expected) to be greater than 3000 ft? √ √
Surface dew point>14◦C? – –
Distinct low level surface temperature axis present? Location/Time?
Will the 850 hPa max temperature ridge be over or west of the 850 hPa moisture axis?
over over
Low level jet
Is a low level jet present or expected to develop? Location/Time? – –
What is the Highest 850 hPa jet speed 14 knots 11 knots
850 hPa moisture convergences expected? Location/Time? – –
Upper Level Support Will there be a 300/250 hPa jet>65 knots? – –
Lifting mechanism
Are any lifting mechanisms such as fronts or outflow boundaries present? List them along with their location.
√ √
Will lifting mechanisms be able to overcome capping inversion? √ √
CIN<50 J kg−1? √ –
Vertical wind shear Winds show significant veering (0–3 km shear values>35 kts)? – – Is there (or will there be) speed shear>25 kts and/or directional shear>30
degrees between 850 and 500 hPa?
√
–
Instability
Is/will the Lifted Index be<0? √ –
Is/will the K Index be>30? √ –
C Will CAPE>800 J kg−1? – –
Will there be high mid level lapse rates (700–500 hPa) 6.5◦C km−1? (6.8◦C Km−1) √
Will there be warm advection at 850 hPa? √ –
Will a significant capping inversion remain in place? – √
700 mb Dry Intrusion Is there or will there be a dry intrusion of air at or near the 700 mb level? (Dew point depression>6◦C)
– –
Upper Vertical Motion Is large scale forcing indicated by modelQvector and omega fields? √ √ Satellite Imagery/ Cloud Indicators Are there lines of cumulus or mid clouds (altocumulus castellanus–ACCAS) on
the morning satellite imagery? Is there significant mid level drying present on water vapor imagery?
√ √
Surface Pressure Falls Is there or will there be strong surface pressure falls?
√ √
Will there be a corresponding pressure rise moving toward the fall area? (The larger the absolute value of this rise-fall couplet, the larger the potential for severe weather in the pressure fall area)
– –
relative humidity patterns at the 700 hPa level. These pat-terns were reviewed to identify characteristics of the thun-derstorm events at 00:00 UTC on 30 April 2009 at the Tabriz station and 12:00 UTC at the Tehran station. Figure 9a rep-resents the vertical velocity profile (VVP) at 00:00 UTC, and it shows a weak downdraft at 700 hPa over the Tabriz sta-tion, while above this level, there is a weak updraft with VVP values of 0.3 m s−1. There is nearly zero VVP in the 700- to 800-hPa layer. Figure 9a closely corresponds with the observed values by showing that at 00:00 UTC the thun-derstorm was not active in Tabriz. Figure 9b shows a ver-tical cross-section of VVP. Regions of upward motion were observed in the 700 to 800 hPa layer, and the values were
between 0.5 and 1 m s−1, which are in agreement with the results from Colquhoun (1987, 1998). Figure 10 shows val-ues of humidity and temperature at 700 hPa. Figure 10a (Fig. 10b) shows that the temperature at the Tabriz (Tehran) station is∼2◦C (4◦C) with a relative humidity of less than 60 % (90 %).
4.4 The Gordon and Miller checklists
410 S. Tajbakhsh et al.: Instability indices and forecasting thunderstorms
Fig. 8. (a) Thermodynamic diagrams on 30 April 2009 for
Tabriz station at 00:00 UTC. (b) Thermodynamic diagrams on 30 April 2009 for Tehran at 12:00 UTC.
predict and identify thunderstorms and their severity. As the table shows, of the 10 important parameters used to forecast thunderstorms and severe weather, approximately 6 of these parameters show a positive response for the Tehran station. In fact, answers to the questions related to parameters 4, 5, 6, 8, 9 and 10 are positive. Hence, based on the Gordon criteria, the event can be categorised into the organised thunderstorm group due to the number of positive responses. To evaluate the severity of the event at the Tehran station at 12:00 UTC on 30 April 2009, we used the Miller checklist. The sur-face pressure map (Fig. 4b) and the thermodynamic diagrams (Fig. 8b) show that the parameters in the Miller checklist (Ta-ble 3) have the following values at the Tehran station: the sur-face pressure is more than 1010 hPa, the dewpoint is greater than 13◦C and the change in the surface pressure within the
Fig. 9. (a) Vertical cross-section of vertical velocity (m s−1), on
30 April 2009 for Tabriz station. (b) Vertical cross-section of verti-cal velocity (m s−1), on 30 April 2009 for Tehran.
Fig. 10. (a) Temperature and relative humidity at 700 hPa on
30 April 2009 for Tabriz station. (b) Temperature and relative hu-midity at 700 hPa on 30 April 2009 for Tehran.
5 Discussion
In our case studies, the synoptic charts present a weak pres-sure gradient over Tehran and Tabriz. Prespres-sure gradients play a main role in providing convergence and updrafts. Conver-gence is one of the trigger mechanisms needed for providing upward motions, which are part of the foundation for thun-derstorm formation. Even a very moist atmosphere cannot produce strong thunderstorm development without a conver-gence mechanism. In our cases, the role of the orographic features clearly aids in preparing conditions for ascent. For example, despite the weak pressure gradient, the topographic conditions helped to form stormy weather at the Tehran and Tabriz airports. The Sahand and Sabalan Mountains around the city of Tabriz and the Alborz Mountains north of Tehran (Fig. 1) have produced lifting for thunderstorm formation.
The climatology of thunderstorm days in Iran shows that statistically only a few stations have more than 50 days with thunderstorms and that a slightly larger number of stations have more than 30 days annually with thunderstorms. Be-cause of this climatology, the country can be considered as a region with a limited number of thunderstorm events. De-spite the fact that most of these stations are not airport sta-tions, the thunderstorm events are still considered important because of the risks to flight operations associated with thun-derstorms. Therefore, we chose to investigate two impor-tant regions for our case study: the Tehran station due to its high number of flights (more than 400 aircraft landing and taking off daily) and the Tabriz station due to its rela-tively high number of thunder days. The synoptic patterns in this case study indicate relatively favourable conditions for instability in Tehran. A surface pressure gradient, tem-perature advection at 850 hPa and the presence of cold air in the upper levels provided suitable conditions for instabil-ity in the lower layers of the atmosphere. The thermody-namic diagrams for the Tabriz station show a shallow radia-tion inversion at 00:00 UTC that is indicative of stability at very low levels. There was also no considerable moisture at the station. In contrast, at 12:00 UTC in the Tehran region, no lower-level temperature inversion was observed, and the moisture content was higher than at the Tabriz station. Be-cause the moisture content that is observed at Tehran is still not significantly large, the thunderstorm intensity was mod-erate to light. Two of the most important causes of severe weather conditions are high humidity in the lower levels and rising air; hence, these two parameters are the most impor-tant NWP model output variables for thunderstorm forecast-ing. In our study, humidity of more than 90 % and a ver-tical velocity equal to 1 m s−1 at 700 hPa produced a rela-tively severe thunderstorm in Tehran. Atmospheric instabil-ity indices including KI and SI confirmed a weak to mod-erate thunderstorm in Tehran, while no thunderstorm was forecast for Tabriz. These results are verified with observa-tions. Haklander and Delden (2003) determined the thresh-old values for important instability indices for the Nether-lands using statistical methods and 32 different parameters to determine the ability of those threshold values to forecast thunderstorms. They found the following threshold values: KI≥21◦C, LIsfc≤1.6◦C, SHOW≤4.2◦C, TT≥46.7◦C, CAPE≥173 J Kg−1 and SWEAT≥134. A comparison of the values of these indices with the two case studies in Iran (Table 3) confirms the occurrence and non-occurrence of thunderstorms for the Tehran and Tabriz stations, respec-tively.
412 S. Tajbakhsh et al.: Instability indices and forecasting thunderstorms
Table 4. Miller severe weather checklist.
No. Parameter Weak Moderate Strong
1 Surface Pressure >1010 mb 1010 to 1005 mb <1005 mb 2 Surface Dew Point <55◦F 55–64◦F 65◦ 3 12 h Surface Pres Change 0 to−3 −4 to−7 −8
4 850 mb Temp Axis East of Moist Axis Over Moist Axis West of Moist Axis
5 850 mb Jet <25 kts 25–35 kts >35 kts 6 850 mb Dew Point 8◦C 8–12◦C >12◦C 7 700 mb Dry Intrusion N/A or Weak 700 mb winds Winds from dry to moist intrude
at<40◦and are 15 kts
Winds intrude at an 40◦and are 25 kts
8 700 mb Temp No Change Line
Winds cross line 20◦ Winds cross line>20◦and 40◦ Winds cross line>40◦
9 500 mb Height Change <30 m 30 and 59 m 60 m 10 500 mb Wind Speed 35 kts 36–49 kts 50 kts
11 500 mb Vorticity Advection Neutral or NVA PVA-Contours Cross Vorticity Pattern 30◦
PVA-Contours Cross Vorticity Pattern>30◦
12 850–500 mb Wind Shear (a) Speed Shear (b) Directional Shear
15–25 kts 20–30◦
26–35 kts 30–60◦
>35 kts
>60◦ 13 300–200 mb Jet 65 kts 66–85 kts >85 kts 14 Mean R.H. 70–80 % or 40–50 % 50–70 % 50–70 %
15 TT <50 50–55 >55
16 LI >−2 −3 to−5 −6
17 CAPE 800–1500 J kg−1 1500–2500 J kg−1 >2500 J kg−1
18 SWEAT <300 300–500 >500
19 WBZ >11 000 ft
<5000 ft
9000–11 000 ft 5000–7000 ft
7000–9000 ft
20 Helicity (0–3 km) 150–300 m2s−2 300–450 m2s−2 >450 m2s−2
21 SI −1 to +2 −1 to−3 <−3
be classified as a weak thunderstorm. In contrast, the event that occurred at the Tabriz station was not placed into the organised class of thunderstorms found in the Gordon check-list. Therefore, according to the Miller checklist, there was no need to review the severity of the thunderstorm because it was very weak. In fact, the Gordon and Miller check-lists provide synoptic and mesoscale methods, respectively, to study thunderstorm events using specific criteria that con-sider all related parameters. If NWP models were config-ured to answer the questions on the checklists, they could be considered a good guide for forecasting thunderstorms and determining their severity.
6 Conclusions
Atmospheric instability is a critical factor in determining if thunderstorm development will commence. Certain pa-rameters, including vertical motion and low-level moisture content, are used to review and evaluate the atmospheric
values in these checklists have already been determined for North America, we found that using these checklists can also be a suitable approach for forecasting thunderstorms in Iran. Certainly, for these checklists to be used in an operational forecasting environment, additional statistical analyses will need to be performed that include local and regional factors such as terrain and elevation for the particular location of in-terest.
Acknowledgements. The authors are grateful to the Editor and
the anonymous reviewers for the precious remarks and comments which led to improve the initial version of this paper.
Edited by: M.-C. Llasat
Reviewed by: three anonymous referees
References
Alijani, B.: Iran Climate, Payam nour pres., Iran, 2009.
Azadi, M., Kaffash, N., and Abdollahzadeh, I.: Probabilistic pre-cipitation forecasting using ensemble forecasting system over Iran., 8th Conference on Numerical Weather Prediction, At-mospheric Science and Meteorological Research Center (AS-MERC), Tehran, Iran, 2009.
Chen, F. and Dudhia, J.: Coupling an advanced land-surface/ hy-drology model with the Penn State/NCAR MM5 modeling sys-tem, Part I: Model implementation and sensitivity. Mon. Weather Rev., 129, 569–585, 2001a.
Chen, F. and Dudhia, J.: Coupling an advanced land-surface/hydrology model with the Penn State/NCAR MM5 mod-eling system, Part II: Model validation, Mon. Weather Rev., 129, 587–604, 2001b.
Colquhoun, J. R.: A decision tree method of forecasting thunder-storms, severe thunderstorms and tornadoes, Weather Forecast., 2, 337–345, 1987.
Colquhoun, J. R.: A decision tree method of forecasting thun-derstorms, severe thunderstorms and tornadoes revisited, Proc. Fifth Australian Severe Thunderstorm Conf., Avoca Beach, New South Wales, Australia, Australian Bureau of Meteorology, 135– 141, 1998.
Doswell III, C. A., Lemon, L. R., and Maddox, R. A.: Forecaster training – a review and analysis, Bull. Amer. Meteor. Soc., 62, 983–988, 1981.
Easterling, D. R.: Climatological patterns of thunderstorm activity in south-eastern USA, Int. J. Climatol., 11, 213–221, 2007. Fawbush, E. J. and Miller, R. C.: A method of forecasting hailstone
size at the earth’s surface, Bull. Amer. Meteor. Soc., 34, 235– 244, 1953.
Galway, J. G.: The lifted index as a predictor of latent instability, Bull. Amer. Meteor. Soc., 37, 518–529, 1956.
George, J. J.: Weather forecasting for aeronautics, Academic press, 673 pp., 1960.
Gheiby, A., Sen, N., Puranik, D., and Karekar, R.: Thunderstorm identification from AMSU-B data using an artificial neural net-work, Meteorol. Appl., 10, 329–336, 2003.
Gordon, J. and Albert, D.: A comprehensive severe weather fore-cast checklist and reference guide, Noaa technical service publi-cation, TSp 10, NWS central region, 2000.
Hales, E.: Severe weather forecasting, Personal SPC notes, Severe Weather Forecast., 1996.
Haklander, A. J. and Delton, A. Van.:Thunderstorm predictors and their forecast skill for the Netherlands, Atmos. Res., 67–68, 273– 299, 2003.
Henz, D.: Soundings and Adiabatic Diagrams for Severe Weather Prediction and Analysis, AOS, 453, 2009.
Jacobs, A. J. M. and Maat, N.: Numerical guidance methods for decision support in aviation meteorological forecasting, Weather Forecast., 20, 82–100, 2005.
Janjic, Z. I.: A Nonhydrostatic Model Based on a New Approach, EGS XVIII, Nice France, 21–26 April 2002, 2002a.
Janjic, Z. I.: Nonsingular Implementation of the Mellor–Yamada Level 2.5 Scheme in the NCEP Meso model, NCEP Office Note, 437, 61 pp., 2002b.
Kain, J. S.: The Kain–Fritsch convective parameterization: An up-date, J. Appl. Meteor., 43, 170–181, 2004.
Knutsvig, R.: “Severe Weather Indices”, University of North Dakota, available at: http://www.geocities.com/weatherguyry/ swx2.html, 2009.
Lin, Y.-L., Farley, R. D., and Orville, H. D.: Bulk parameterization of the snow field in a cloud model, J. Clim. Appl. Meteor., 22, 1065–1092, 1983.
Maddox, R. A. and Doswell III, C. A.: An examination of jet stream configurations, 500 mb vorticity advection patterns, and low-level thermal advection patterns during periods of intense convection, Mon. Weather Rev., 110, 184–197, 1982.
Miller, R. C.: Notes on analysis and severe storm forecasting proce-dures of the Air Force Global Weather Center, AWS Tech. Report 200 (Rev.), Headquarters Air Weather Service, Scott AFB, 106 pp., 1972.
Mlawer, E. J., Taubman, S. J., Brown, P. D., Iacono, M. J., and Clough, S. A.: Radiative transfer for inhomogeneous atmo-spheres: RRTM, a validated k-correlated model for the long-wave, J. Geophys. Res., 102, 16663–16682, 1997.
Moore, J. T., Glass, F. H., Graves, C. E., Rochette, S. M., and Singer, M. J.: The Environment of Warm-Season Elevated Thunderstorms Associated with Heavy Rainfall over the Central United States, Weather Forecast., 18, 861–878, 2003.
Ramis, C., Romero, R., and Homar, V.: The severe thunderstorm of 4 October 2007 in Mallorca: an observational study, Nat. Haz-ards Earth Syst. Sci., 9, 1237–1245, doi:10.5194/nhess-9-1237-2009, 2009.
Showalter, A. K.: A stability index for thunderstorm forecasting, Bull. Amer. Meteor. Soc., 34, 240–252, 1953.