www.nat-hazards-earth-syst-sci.net/7/765/2007/ © Author(s) 2007. This work is licensed under a Creative Commons License.
and Earth
System Sciences
Elements at risk as a framework for assessing the vulnerability of
communities to landslides
M. Papathoma-K¨ohle1, B. Neuh¨auser1, K. Ratzinger1, H. Wenzel1, and D. Dominey-Howes2 1VCE, Hadikgasse 60, A-1140, Vienna, Austria
2Natural Hazards Research Laboratory, School of Safety Science, Univ. of New South Wales, Sydney, NSW 2052, Australia Received: 21 September 2007 – Revised: 19 November 2007 – Accepted: 19 November 2007 – Published: 5 December 2007
Abstract. The assessment of the vulnerability of
commu-nities prone to landslide related disasters is a topic that is growing in importance. Few studies discuss this issue and limited research has been carried out on the relationship be-tween types of landslide and their potential impact on build-ings and infrastructure. We outline a framework to undertake an assessment of the vulnerability of buildings to landslide utilising a similar framework used for assessing the vulner-ability of buildings to tsunami damage. The framework is based on the development of an “elements at risk database” that takes into consideration the characteristics and use of the buildings, their importance for the local economy and the characteristics of the inhabitants (population density, age and so forth). The attributes that affect vulnerability are im-ported and examined within a GIS database which is used to visualise the physical, human and economic vulnerabil-ity. The results may have important implications for disaster management and emergency planning, and the database can be used by various end-users and stakeholders such as in-surance companies, local authorities and the emergency ser-vices. The approach presented here can be integrated in to a wider more detailed “Framework for Landslide Risk and Vulnerability Assessment for Communities”. We illustrate the potential of this framework and present preliminary re-sults from Lichtenstein, Baden W¨urttemberg, Germany.
1 Introduction
Globally, landslides are responsible for significant loss of life and injury to people and their livestock as well as loss of and damage to lifelines, critical infrastructure, agricul-tural lands, housing and public and private infrastructure and assets (JRC, 2003; Bl¨ochl and Braun, 2005; USGS, 2001; Correspondence to: M. Papathoma-K¨ohle
UNU, 2006). Landslides are the expression of slope insta-bility and they belong to a wider group of processes called mass movements (Glade and Crozier, 2005). Landslides are often categorised in terms of material (earth, rock, debris) and moving process (fall, slide, topple) (Glade and Crozier, 2005). In this paper, based on the dominant type of landslide in the study area we are focusing on, the prominent form of landslide processes which include translation slides and flows and rotational slides.
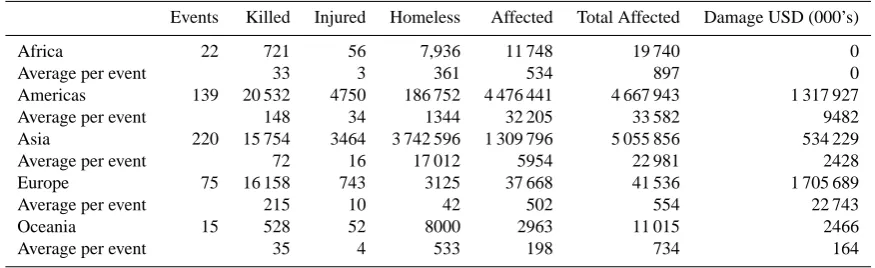
The effects of landslides can be very significant and vary according to geographic location. For example, landslides in Europe cause significant economic losses, whereas, in Asia and Latin America, they cause great loss of life. Accord-ing to the OFDA/CRED International Disaster Database, be-tween 1903 and 2004, 75 landslide events were recorded in Europe resulting in the loss of 16 158 lives (an average of 215 people per event), left 3125 homeless and resulted in dam-ages in excess of US$1.7 billion (Table 1) (UNU, 2006). It is highly possible that climate change in combination with wide-scale development on steep slopes has increased the impact of landslide events and the disasters they may cause globally (UNU, 2006). Climate change can affect the occur-rence of landslides in two ways: increasing rainfall intensity and frequency, and changes in soil temperature which can lead to reduced slope cohesion and stability (UNU, 2006). Other phenomena that can trigger landslides include earth-quakes, volcanic eruptions and inappropriate human activi-ties such as mining and poorly planned developments (UNU, 2006).
Table 1. Landslides worldwide: 1903-2004.
Events Killed Injured Homeless Affected Total Affected Damage USD (000’s)
Africa 22 721 56 7,936 11 748 19 740 0
Average per event 33 3 361 534 897 0
Americas 139 20 532 4750 186 752 4 476 441 4 667 943 1 317 927
Average per event 148 34 1344 32 205 33 582 9482
Asia 220 15 754 3464 3 742 596 1 309 796 5 055 856 534 229
Average per event 72 16 17 012 5954 22 981 2428
Europe 75 16 158 743 3125 37 668 41 536 1 705 689
Average per event 215 10 42 502 554 22 743
Oceania 15 528 52 8000 2963 11 015 2466
Average per event 35 4 533 198 734 164
Source: OFDA/CRED International Disaster Database, Universite Catholique de Louvain, Belgium
– even those of small magnitude (Bl¨ochl and Braun, 2005). Landslides may have very significant impacts on buildings and are very expensive in terms of the costs of rehabilitation, securing the structures and ongoing maintenance. Interest-ingly, the impact of landslide processes is often underesti-mated and overlooked because they frequently occur in com-bination with other events such as floods, earthquakes and volcanic eruptions (USGS, 2001; Bl¨ochl and Braun, 2005; JRC, 2003).
Helmer and Hilhorst (2006) have suggested that climate change may be connected to an increase in the number of natural disasters worldwide and the primary message for dis-aster management should be on the reduction of vulnera-bility to such extreme natural processes. Consequently, an enhancement of capacity-building and resilience is essential (Helmer and Hilhorst, 2006). Further, any changes in the fre-quency and intensity of and exposure to landslides requires a vulnerability assessment framework that takes into consider-ation the natural, built and human environments. This is im-portant since a proper understanding of vulnerability can lead to more effective emergency management and in the devel-opment of mitigation and preparedness activities all of which are designed to reduce the loss of life and economic costs.
2 Existing methods for vulnerability assessment and the need for a new method
Before a description of our framework is provided we outline the basic concepts of landslide hazard, risk and vulnerability. UNDRO (1979) (cited by Glade, 2003) defined risk around is various elements through the following equation:
R=H×E×V (1)
Where:
R: Risk, referring to the expected number of lives lost, per-sons injured and damage to property or disruption of economic activity due to a particular event.
H: Natural hazard, defined as the probability of occurrence of a potentially damaging event within a specified time and given area.
E: Elements at risk, including population, buildings and engineering structures, infrastructure areas and lines, public service utilities and economic activities.
V: Vulnerability related to the (potential) results from event occurrence expressed with qualitative, semi-quantitative or semi-quantitative methods in terms of loss, disadvantage or gain, damage, injury or loss of life. In the field of landslide research, most studies have fo-cused on the landslide hazard part of this equation and have resulted in the generation of landslide hazard maps which include “hazard zones”. Few have concentrated on the risk and vulnerability elements. A number of studies have tried to examine both risk and community vulnerability and a very limited number have examined vulnerability specifically.
Hollenstein (2005) conducted a review of existing vul-nerability assessment methods associated with different haz-ard/disaster types and concluded that studies dealing with landslide vulnerability are very limited. Hollenstein (2005) recorded more than 100 related to earthquake vulnerability, more than 100 regarding wind related vulnerability models but less than twenty involving gravitational hazards such as landslides, debris flows, snow avalanches and floods. Hollen-stein (2005) suggests that one potential reason for this lack of vulnerability research is that gravitational processes are usually accurately delimited and the most common strategy of the authorities and other stakeholders is to simply avoid areas likely to be affected. A further reason might be that the institutions responsible for the management of these hazards have enough empirical knowledge so that they do not need theoretical models (Hollenstein, 2005).
They used general information about the houses within their “at risk” areas based on the material of the buildings and the existence of large windows on the mountain side. However, no detailed investigation of building types was carried out. The vulnerability of the people in structures was assumed by multiplying the vulnerability of buildings with the vulnera-bility of people. The vulneravulnera-bility of buildings and people was determined based upon the landslide processes and their magnitude. As outputs they provided an “elements at risk map” based on number of residents and employees and a to-tal risk map. Vulnerability to landslides is also discussed by Glade and Crozier (2005) who determine the vulnerabil-ity of people according to their location (open space, vehicle or building). Gomes (2003) included a vulnerability assess-ment eleassess-ment for landslides within a Quantitative Risk Anal-ysis (QRA) framework based on a weighting of elements at risk that gives the highest weighting to human life. Gomes’ criteria included the presence, frequency and absolute num-ber of human lives, infrastructure (public, residential etc.) and productive function and activities (industry, agriculture, etc.). Although vulnerability was considered in the work of Gomes (2003), its inclusion was the means of producing a risk map so there was no final map demonstrating explicitly the vulnerability pattern.
An interesting study has been carried out by the Depart-ment of Hydrology and Meteorology of Nepal (Shrestha, 20051). The study includes both the physical and social vul-nerability to landslides and floods. The physical vulnerabil-ity was calculated and mapped on the basis of a combination between physical exposure (population, households, agricul-tural land, road length) and hazard. The social vulnerability assessment considered factors such as telephone lines, hos-pitals, banks etc., per number of inhabitants and economic diversity. The study points out the significance of vulnera-bility assessment since it proves that although the hazard has decreased the vulnerability has risen due to higher physical exposure and lower adaptive capabilities (Shrestha, 20051).
Lastly, a QRA undertaken by the Geotechnical Engineer-ing Office (GEO) is also of note. Their QRA was part of “Slope Safety” – a long term program aimed at identifying the quickest possible method to reduce landslide risk to the community of Hong Kong. The QRA includes a “Conse-quence Analysis” which considers the vulnerability of the elements at risk by assessing the conditional probability of the consequences occurring given the occurrence of a hazard. The result of the application of the QRA technique in Hong Kong was a reduction of the overall landslide risk from sub-standard man-made slopes to less than 5% in 23 years (1977– 2000) (http://hkss.cedd.gov.hk/hkss/eng/studies/qra/).
1Shrestha, A.: Vulnerability assessment of weather disasters in
Syangja District, Nepal: A case study in Putalibazaar Municipal-ity, Advances Institute on Vulnerability to Global Environmental Change, submitted, 2005.
From this short review of the literature related to landslide hazard, risk and vulnerability, it is apparent that there is no common approach used for the assessment of vulnerability for communities prone to landslide related disasters that can be used as a tool for effective emergency and disaster man-agement. Given this lack of conformity and the gap in land-slide vulnerability research identified by Hollenstein (2005), we present a framework for assessing the vulnerability of buildings structures to landslides. Our framework utilises a similar framework already developed for tsunami (Papath-oma, 2003). For the purposes of demonstration, the frame-work will be applied to a landslide prone area using prelim-inary data for the village of Lichtenstein in the Swabian Alb region of Germany, where a previous landslide susceptibil-ity assessment study has been conducted (Neuh¨auser, 2005). This assessment indicated the landslide susceptibility zones of a wider area in the Swabian Alb. The aim of the present study is to present a framework that is able to identify the vul-nerability of buildings located within the landslide suscepti-bility zones. Due to difficulties with the availasuscepti-bility of data and for ease of demonstration, we only assess the vulnerabil-ity of buildings within the “medium” and “high” susceptibil-ity zones of Neuh¨auser (2005) rather than a comprehensive “vulnerability map” of the entire Swabian Alb.
Adger (2006) suggests that key parameters affecting vul-nerability are the stress to which a system is exposed, its sen-sitivity and its adaptive capacity. According to Adger (2006), there are two major research traditions in vulnerability: the analysis of vulnerability as lack of entitlements and the anal-ysis of vulnerability to natural hazards. The basis of the sec-ond tradition is the physical elements of exposure, probabil-ity and impacts of hazards. In the present work we focus on this approach by using a model based on first principles of physical and engineering elements.
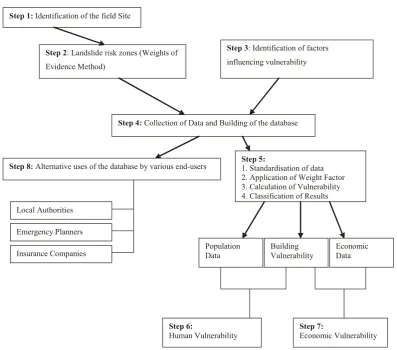
METHODOLOGY
Step 1:Identification of the field Site
Step 2: Landslide risk zones (Weights of
Evidence Method)
Step 3: Identification of factors
influencing vulnerability
Step 4:Collection of Data and Building of the database
Step 5:
1. Standardisation of data 2. Application of Weight Factor 3. Calculation of Vulnerability 4. Classification of Results Step 8:Alternative uses of the database by various end-users
Population Data
Building Vulnerability
Economic Data
Step 6:
Human Vulnerability
Step 7:
Economic Vulnerability Local Authorities
Emergency Planners
Insurance Companies
Fig. 1. The steps of the vulnerability assessment methodology.
is assigned to every factor that influences the vulnerability and for every building within the study area a vulnerability value is calculated. Subsequently, the human vulnerability can be calculated on the basis of the building vulnerability and the population density. At this point it is important to mention that the calculation of the population density during the day/night and summer/winter is important as it is tak-ing into consideration the temporal dimension of the vulner-ability which may be especially important in an area of high tourist activity.
The results are presented in a map that can be used as the basis for emergency management decision-making. The GIS database produced is a useful tool for various stakeholders of the community such as local authorities, rescue teams, in-dividuals and insurance companies. The specific framework was first developed for tsunami related disasters (Papathoma, 2003) and has been applied to two coastal areas in Greece that are susceptible to tsunami flooding (Papathoma et al., 2003; Papathoma and Dominey Howes, 2003). In Fig. 1 the methodological steps are shown. The framework is based on the development of a database (Step 4, Fig. 1) containing the
factors that affect the physical, social and economic vulner-ability of a community and they can result either in a build-ing/human/economic vulnerability map (Steps 5, 6, 7) or the utilisation of the database by various end-users (Step 8). Re-cently, it was evaluated using evidence from the 2004 Indian Ocean tsunami (Dominey-Howes and Papathoma, 2007).
3 The proposed framework and the Swabian Alb
In the following paragraphs the method developed by Pap-athoma (2003) is modified for landslides and is applied to the area of Lichtenstein (Baden W¨urttemberg, South Germany) using some basic data to test its capacity to generate infor-mation about vulnerability.
3.1 Identification of the field site
type of landslide affecting the area can be described as slump earth-flow (Bibus and Terhorst, 2001). Generally, the land-slides in “Albtrauf” (anticlinal escarpment) belong to one of the following categories:
– Recently active areas that can be recognised by
dam-age to vegetation, the soil and roads. They are mostly classified as translation-slides and flows; and
– Slope terrace, “steps”, and ridges that are created by
ro-tational slips, where high flat areas of the “Alb” that are located next to the cliff have slipped. Nearly all these ar-eas are now stable. Some recent activities can be found only at very steep areas of the slope.
The landslide risk is however, often underestimated in these regions and the need for drastic and expensive landslide mea-sures, such as slope stability structures is not considered nec-essary. We feel that a large scale vulnerability assessment could help the local authorities concentrate their efforts and resources towards specific buildings/areas and to have a low cost risk/vulnerability assessment of the communities under danger. Lastly, the majority of existing landslide vulnerabil-ity assessment studies relate to developing rather than devel-oped countries. The framework presented here is designed for a developed country and does not take into consideration factors such as poverty, high crime rates and so forth. that are not relevant to a study area in a European country like Ger-many. In the following paragraphs we apply our approach to a village in the Swabian Alb that is threatened by landslides. In a study by Bl¨ochl and Braun (2005) the houses of the area around Lichtenstein-Unterhausen are classified as mainly semi-detached residential. The risk of landslides is obvious as some of them have already cracks in masonry (Fig. 2), damage to electricity and water supply, subsidence and alike. Interestingly, all the houses are insured following a regulation that was introduced in 1994 that suggested that all the buildings should be privately insured and according to a survey based on questionnaires people seem to be aware of landslides as a hazard capable of affecting them and their property (Bl¨ochl and Braun, 2005). However, owners do not take into consideration the landslide potential when they choose a house location and only 39% of owners have taken preventive measures such as geological engineering consul-tations, construction of walls and reinforced foundations.
A study undertaken by Neuh¨auser (2005) within the framework of the LESSLOSS project used the Weights of Evidence Method in order to identify landslide susceptible areas in part of the Swabian Alb region of Germany (Fig. 3). The susceptibility map is the result of the calculation of the probability of landslide occurrence in the future, based on the assumption that future landslides will occur under simi-lar circumstances to the past. From Fig. 3 it can be seen that landslide susceptible areas coincide with inhabited areas and one of them is the village of Lichtenstein where the present case study was carried out.
Fig. 2. Residential house in Reutlingen (Swabian Alb) damaged by a landslide (Bl¨ochl and Braun, 2005).
Based on the work of Neuh¨auser (2005) a landslide sus-ceptibility map of Lichtenstein-Unterhausen has been pro-duced (Fig. 4). Figure 4 indicates that in the area of Lichtenstein-Unterhausen a significant number of buildings are located within the low, medium and high landslide sus-ceptibility zones. Figure 4 shows that there are some clus-ters of buildings especially in the centre and south of the vil-lage that are included within the high landslide susceptibility zones. The buildings within these zones cannot be consid-ered equally vulnerable since vulnerability is dynamic and it depends on many factors. The pattern of the vulnerability within these zones is what the present study will focus on.
Using Google Earth air photography, at least 1271 buildings were recognised and digitized for the area of Lichtenstein-Unterhausen. The absolute number and the percentage of the buildings that lie within very high, high, medium and low susceptibility areas are shown in Table 2. These numbers concern the exposure within the landslide susceptibility zones. The next step will be to quantify the vulnerability of these structures. It will be possible to see the buildings vulnerability pattern when the database is pop-ulated with the required data. The specific data is not always available from the authorities and when they are they are of-ten costly. The alternative is a house-to house survey which in this case will not be particularly time consuming but as far as the transferability of the framework is concerned this is definitely a negative point.
3.2 Identification of parameters that may contribute to vul-nerability
Fig. 3. Landslide Susceptibility map of part of the Swabian Alb based on the Weights of Evidence Method (Neuh¨auser, 2005).
Table 2. The buildings of Lichtenstein.
Absolute number Percentage
Total buildings 1271 –
Low Landslide Susceptibility Area 155 12%
Medium Landslide Susceptibility Area 10 0.8%
High Landslide Susceptibility Area 98 7.8%
Very High Landslide Susceptibility Area 129 10%
Total number of buildings within landslide susceptibility zones 392 31%
completely destroyed, partially damaged or it can just expe-rience excessive deformation (inclination without damage) (EPFL, 2002). Many factors play a role in this impact such as the material of a building, its age, its height/size and its foundations. A post-event survey after a catastrophic land-slide in Italy showed that from all the destroyed buildings none of them were constructed of concrete, 60% were made of stone and 40% of masonry (EPFL, 2002).
Another factor that affects the physical vulnerability of a building during a landslide is its location (http://www.
As it has been previously mentioned, disastrous events have direct and indirect losses. An indirect loss of the land-slide can be the loss of the house content. Although this is also dependent on the landslide volume and speed it is also connected to the nature of the wall of the building which is facing the slope. The presence of large glass windows can increase the vulnerability, as far as content loss is concerned, whereas the absolute absence of openings (windows, doors, etc.) will decrease this type of vulnerability. Therefore, data concerning the built environment would be essential. For ex-ample:
Data concerning the build environment:
– Material and age of the buildings
– Existence of surrounding wall
– Existence of large windows toward the mountain slope.
– Number of floors
– Roads/railway lines
– Lifelines
Moreover, according to the Federal Emergency Manage-ment Agency (FEMA) of the US governManage-ment, there are some warning signs that the house owners might notice before a landslide occurs such as:
– doors and windows stick or jam;
– new cracks appear in the plaster, tiles, bricks or
founda-tions;
– outside walls/walks/stairs pilling away from the
build-ing;
– slow developing widening cracks on the ground/paved
areas/streets/driveways;
– underground utility lines break;
– waterbreaks through the ground surface in new
loca-tions;
– fences, retaining walls, utility poles, or trees tilt or
move; and
– unusual sounds are heard (tree cracking sounds)
pave-ments are collapsing and fallen rocks are found at road-sides (http://www.fema.gov/hazard/landslide/ls before. shtm).
Lastly, in order to assess the social vulnerability of the community data concerning the population are very impor-tant and include:
– number of households per building;
– land use/building use;
Fig. 4. The landslide susceptibility zones in Lichtenstein.
– empty houses (if any);
– temporary high density of population (theatres/ski
re-sorts/tourist buildings etc.); and
– buildings with particularly vulnerable populations
(hos-pitals, elderly nursing homes, kindergartens, schools, jails).
Other data that are of interest and could also play a role in the vulnerability assessment include:
– existence of slope support structures/other mitigation
measures;
– buildings of high economic importance; and
– buildings without private insurance.
Table 3. The various fields comprising the GIS database.
Field Description of filed Description of categories Code
Material Material of which the building is made Concrete Masonry Other (poor)
1 2 3
Surround Surrounding walls or protection especially on the side of the slope
No/low surrounding wall Medium wall
Strong high wall
3 2 1
Floors One floor
More than one floor
2 1
Slope side Description of the side of the building facing the slope
Only wall Small windows Large widows
1 2 3
Eco imp Importance for the local economy (factories, main local employers)
High Low
2 1
Use Residential
Commercial Service
1 2 3
households Number of households Absolute number –
Employees Number of employees Absolute number –
Population density during the year
Difference in density for buildings with special use (e.g. winter resorts etc.)
High pop. Density in the summer High pop. Density in the winter
1 2
Population density during the day
Difference in population density during day (schools) and night (hotels, theatres).
High pop. Density during the day High pop. Density during the night
1 2
Vul pop Yes
No
2 1
Insurance Private Insurance Yes
No
1 2
Warning Presence of warning signs of landslides Yes No
2 1
The data collected for each building can be divided into three categories:
1. quantitative (population, population density, number of households);
2. qualitative (condition, building surroundings, etc.) and; 3. descriptive (e.g., building use).
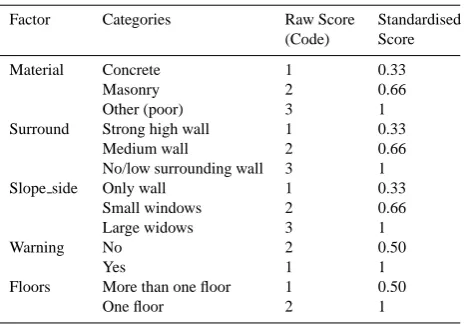
The data that will be used in the weighted linear combina-tion are the quantitative ones. Standardisacombina-tion is the method used in order to rescale the data to a common numerical basis by simple linear transformation (Voogd, 1983). In this study the standardisation method used is the transformation to raw data to scores from 0 to 1 by using the following formula:
Standardized score I = raw score I/maximum raw score (Voogd, 1983)
The standardised data are outlined in Table 4.
3.4 The database within a landslide risk and vulnerability framework
As assessing vulnerability is an important part of disaster management, a framework that includes vulnerability and risk assessment taking into consideration the direct and the indirect impacts of a specific natural hazard is necessary for communities at risk. In the present study a framework for community planning for coastal hazards proposed by John Heinz III Center (2000) is used as a base for a landslide risk and vulnerability framework.
Table 4. The standardised scores.
Factor Categories Raw Score (Code) Standardised Score Material Concrete Masonry Other (poor) 1 2 3 0.33 0.66 1 Surround Strong high wall
Medium wall
No/low surrounding wall 1 2 3 0.33 0.66 1 Slope side Only wall
Small windows Large widows 1 2 3 0.33 0.66 1 Warning No Yes 2 1 0.50 1 Floors More than one floor
One floor
1 2
0.50 1
consideration. According to the John Heinz Center (2000), damage assessments are currently based on insured losses only. However, there are additional costs that affect the com-munity such as business interruption, effects on the local economy (e.g., tourism), social costs, disturbance of natu-ral ecosystems and so on. This framework is recommended to local planners and decision makers in order to help in the strengthening of community mitigation programs. The John Heinz Center framework proposes that risk and vulnerability result from a combination of natural and societal conditions. It also includes an evaluation of the current strategies and makes recommendations for new ones that consider the im-pact on individual stakeholder groups as well as on society.
The John Heinz Center framework is organised around the following principles:
– in order to characterise potential losses from disasters of
different magnitudes, linking risk assessment and vul-nerability is essential;
– evaluation of alternative mitigation and preparedness
strategies should take into consideration direct and in-direct economic, business, social and environmental costs; and
– the alternative strategies and policies have to recognise
the relevance of the status quo without being restricted by the current policies.
Although the framework was prepared for coastal weather hazards it has the potential to be applied to a broad range of hazard types.
From the framework it is clear that there is a need for a database containing the information required as far as nat-ural and societal conditions are concerned as well as char-acteristics of the build environment or the community that could lead to direct or indirect losses following a disastrous event. The database of elements at risk proposed here can
Table 5. The weighting of the factors.
Factor Weight
Material 5
Surround 4
Slope side 3
Warning 2
Floors 1
be used in order to assess the different types of vulnerability to a community under threat (physical, social and economic vulnerability) and it can be integrated within such a frame-work. The scale and the unit of the vulnerability assessment study should be in such a scale so that it can be efficiently used by local authorities and other stakeholders. A Land-slide Risk and Vulnerability Framework based on the Heinz Center Risk and Vulnerability Framework is presented in the following paragraphs.
3.5 Preliminary results
3.5.1 Building vulnerability (V b)
The data needed and shown in Table 3 may be provided by the local authorities, the individual property owners by filling in a questionnaire or collected on site by researchers and are entered in to the GIS database. The weighting of the factors can be chosen by each user according to his priorities and the final purpose of his assessment. In our work, we weight the factors as shown in Table 5.
Finally, the vulnerability of each building in the inundation zone is calculated.
V b=(5×a)+(4×b)+(3×c)+(2×d)+(1×e) (2) Wherea,b,c,d,ethe standardised scores that are:
a: related to the material of the building; b: related to the surroundings of the building;
c: related to the description of the building’s side facing the slope;
d: related to the existence of warning signs; e: related to the number of floors of the building;
The lowest vulnerability can be calculated for a building that is concrete, has more than one floor and a high surround-ing wall, has no windows on the slope side and has no evi-dence of landslide warning signs. The vulnerability of this building will be:
V b=5×0.33+4×0.33+3×0.33+2×0.5+1×0.5
Fig. 5. The spatial pattern of the vulnerability of the buildings.
The highest vulnerability will be calculated for a one-floor building of poor material, with no surrounding wall, large windows on the slope side and landslide warning signs. The vulnerability of this building will be:
V b=5×1+4×1+3×1+2×1+1×1=15 (4) The value of the vulnerability of the other buildings will be between these two numbers. By following this framework, it is possible to generate a vulnerability map such as the one shown in Fig. 5. Figure 5 suggests that there are no clusters of vulnerable buildings in Lichtenstein. On the contrary, the high vulnerability buildings are dispersed randomly in the village. Consequently, the local authorities could approach the owners of the specific buildings and make some sugges-tions regarding mitigation measures.
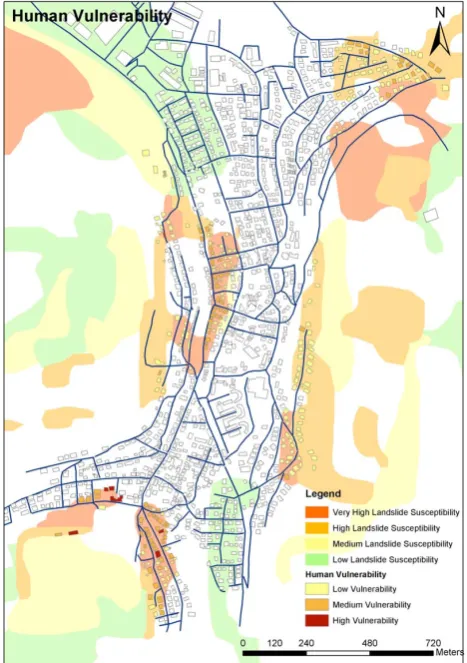
3.5.2 Human vulnerability (V h)
Following the calculation and visualisation of the vulnera-bility of the buildings (V b), the overall human vulnerability can be calculated. This may be done if the population of each house is multiplied by its vulnerability. In this way, a new item named “human vulnerability”V h is created in
Fig. 6. The spatial pattern of human vulnerability.
the attribute table of the building coverage. For example, two buildings withV b=12 (high vulnerability) have differ-ent numbers of residdiffer-ents. The first has two households (6 people) and the second one has no residents. The human vulnerability (V h) for the buildings is:
For the first building:V h=V b×Population=12×6=72 Whereas,for the second building:V h=12×0=0
A pattern of the population density in the landslide sus-ceptibility areas during the day/night and summer/winter can also be shown. Based on theV bmap and a rough estima-tion of households in the study area, a Human Vulnerabil-ity map is calculated (Fig. 6). As in Fig. 5, Fig. 6 does not show any clusters of high human vulnerability buildings. Due to the high resolution of the map the individual vulner-able buildings can be identified and suggestions regarding public awareness and education may be made.
3.5.3 Economic vulnerability
medium susceptibility zones, the highly vulnerable build-ings housing businesses or services that are vital for the lo-cal economy and the number of employees that work within these structures. It is important to know in advance the main employers of the community and the businesses of high lo-cal, regional or even national economic importance. The next step is to check the vulnerability of the buildings (Fig. 5) where important businesses are housed. Then we can have an estimate of the unemployment rates, loss of products and compensation rates following a landslide disaster.
4 Discussion
4.1 Alternative uses of the database
Apart from the outputs generated by our approach (the building and human vulnerability assessment maps) the database itself may be a valuable tool in the hands of different end-users.
Local authorities:
The landslide susceptibility map is anyway important for the local authorities since it enables them to identify the high landslide susceptibility areas and prohibit development within these areas through a programme of urban land use planning. However, the proposed database offers informa-tion that combined with the landslide susceptibility map can be of great importance for the local authorities.
A database produced during this study may also be useful to the Local Authorities since it provides information concerning the characteristics of individual buildings. Local Authorities can make recommendations to individuals regarding their properties. The Local Authorities can then locate buildings that need reinforcement, alterations of the ground floor, or construction of a surrounding wall. Recommendations for slope stabilisation construction or simply planting of trees in specific locations could then be made. One of the problems that rescue teams often face right after an event is blocked roads from debris. Local Authorities could use the database in order to see which roads are likely to be blocked and which buildings are going to have no access after a landslide event. Figure 7 show the areas of the road network that might be blocked after a landslide event and the rescue teams and emergency services can use this map in order to find alternative routes or to relocate buildings with highly vulnerable populations that have no access to the local road network after a landslide. Emergency/rescue teams:
One of the problems that emergency planners and rescue teams face after the occurrence of a disastrous event is poor communication. Telephone lines might not be working
prop-erly and the rescue teams do not know what the impact of the disaster is, how many victims are involved and where trapped people and casualties are located. Bad weather conditions or darkness can make the job of the rescue teams even more dif-ficult. Therefore, the time of the occurrence of a disastrous event affects its impact. By giving a code to each building ac-cording to its population density during the night/day or dur-ing the summer/winter, the population density of the whole area during different times of the day and during different times of the year can be identified and its spatial distribution investigated. Emergency planners and rescue teams are also interested in evacuation procedures. The database may be used to highlight the buildings that belong to the High Hu-man Vulnerability category and have no access to roads lead-ing away from the high landslide susceptibility areas or their distance to essential services such as fire stations. Figure 8 shows the location of buildings housing vulnerable popula-tion (in this case kindergartens and schools) and their dis-tance to essential services such as fire and police stations. In the case of Lichtenstein, there is only one building with a vulnerable population at a considerable distance from emer-gency support services. Further, none of the buildings con-taining highly vulnerable population is located within a high landslide susceptibility zone.
Other potential users of the database may include insur-ance companies (for the creation of catastrophe models), in-dividuals (property owners in the high susceptibility areas), and voluntary rescue groups.
4.2 The proposed landslide risk and vulnerability frame-work
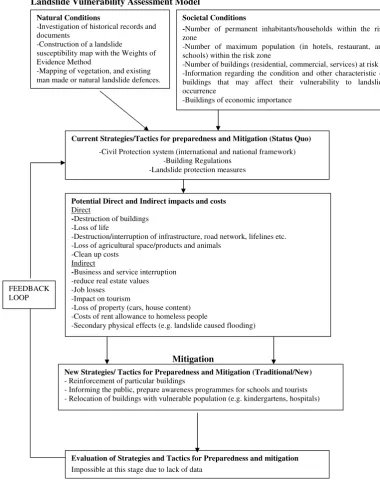
The elements at risk database can be integrated within a Risk and Vulnerability Framework for communities prone to land-slides. The proposed framework is based on a similar frame-work for coastal disasters proposed by John Heinz Center which is described in Sect. 3.4. The framework has been modified here for landslide related disasters (Fig. 9). As it is suggested by J. Heinz Centre, the risk and vulnerability result from a combination of societal and natural conditions. The database proposed in the present study can be integrated in this framework containing all the data regarding the societal (number of households/inhabitants, characteristics of build-ings) and natural conditions (landslide susceptibility map) re-lated to landslide disasters.
Fig. 7. Locations of possible road blockage.
finally, based on the results of the proposed study the exist-ing civil protection and emergency plans can be evaluated and updated (Feedback loop, Fig. 9).
4.3 Limitations of the proposed framework for landslide vulnerability assessment
There are limitations in our preliminary work that will have to be tackled in later stages of research. These include:
Identification of the area under study: According to our framework, the area under study has to be identified by a pre-existing landslide susceptibility map. These maps are not always available, especially for areas with medium or low landslide susceptibility. Moreover, the production of such maps requires many sets of data (soil, DEMs, rainfall data) that are also expensive and not always available at the re-quired scale and form.
Data availability and costs: the required data for the pro-posed vulnerability assessment method can be expensive and difficult to acquire. As suggested earlier, this may be over-come by the collection of:
Fig. 8. Map showing the location of the buildings where vulnera-ble population is located (e.g. Kindergartens) and their distance to services (fire brigade, police).
1. Air-photographs and remote sensing data (buildings lo-cations, railway and road network)
2. Local authorities (some of the buildings characteristics, lifelines, utilities)
3. Questionnaires (information regarding the warning signs of landslides, insurance income, household infor-mation etc.)
4. Fields survey (characteristics of buildings that are not available from the local authorities)
Some of the data needed are unlikely to be available due to their nature. Data concerning the financial situation of house-holds, disabilities, etc, might be protected or simply non-existent. Data concerning the types of housing and detailed cadastral maps are normally very expensive. Finally, the field survey can be time consuming depending on the size of the area under investigation.
Landslide Vulnerability Assessment Model
Natural Conditions
-Investigation of historical records and documents
-Construction of a landslide susceptibility map with the Weights of Evidence Method
-Mapping of vegetation, and existing man made or natural landslide defences.
Societal Conditions
-Number of permanent inhabitants/households within the risk zone
-Number of maximum population (in hotels, restaurant, and schools) within the risk zone
-Number of buildings (residential, commercial, services) at risk -Information regarding the condition and other characteristic of buildings that may affect their vulnerability to landslide occurrence
-Buildings of economic importance
Current Strategies/Tactics for preparedness and Mitigation (Status Quo)
-Civil Protection system (international and national framework) -Building Regulations
-Landslide protection measures
Potential Direct and Indirect impacts and costs
Direct
-Destruction of buildings -Loss of life
-Destruction/interruption of infrastructure, road network, lifelines etc. -Loss of agricultural space/products and animals
-Clean up costs Indirect
-Business and service interruption -reduce real estate values -Job losses
-Impact on tourism
-Loss of property (cars, house content) -Costs of rent allowance to homeless people
-Secondary physical effects (e.g. landslide caused flooding)
Mitigation
New Strategies/ Tactics for Preparedness and Mitigation (Traditional/New)
- Reinforcement of particular buildings
- Informing the public, prepare awareness programmes for schools and tourists - Relocation of buildings with vulnerable population (e.g. kindergartens, hospitals)
Evaluation of Strategies and Tactics for Preparedness and mitigation
Impossible at this stage due to lack of data FEEDBACK
LOOP
Fig. 9. Proposed landslide vulnerability assessment model (Framework).
also on the type of the landslide, the speed of the movement and its size. Also we have not included the protection that can be offered to some buildings from being located behind others. The buildings that are located directly by the slope should be more vulnerable in some types of mass movements (such as debris flows, mud slides, rock falls) than buildings that are located behind them. Other types of landslides given their size and nature can move buildings from their founda-tions. In this case, the location of the building, as far the
direct proximity to the slope is concerned, does not play an important role.
Sensitivity of the results to the variation of the parame-ters: The sensitivity of the results of the present study de-pends very much on the weighting of the parameters. For example, according to the present weighting two buildings with different material type are very likely to belong to dif-ferent vulnerability categories although the rest of their char-acteristics might be quite similar. On the contrary, buildings made of similar material although they might differ signif-icantly as far as the surroundings or their side towards the slope is concerned might belong to the same vulnerability class. Although this can be considered as a disadvantage of our approach, it highlights the importance of the fact that in this framework the weighting is flexible and the user can weight the factors according to their priorities. To overcome this difficulty, we recommend that in future work, a non lin-ear regression sensitivity analysis should be undertaken to determine which attribute within the database has the most significant affect on the overall vulnerability of a building.
Magnitude, Frequency and Run out: Our work does not take into consideration the magnitude, frequency and run out of potential landslides since it has been based on the suscep-tibility map developed using the weights of evidence method. This method is based on the assumption that future landslides will occur under the same conditions as past events. In this case we cannot take into consideration the frequency of the phenomenon, as we do not talk about reactivated past land-slides but potential first-time events. Consequently, informa-tion regarding their run-out and magnitude are also difficult to acquire. Knowledge of the magnitude and frequency of a landslide event is essential for landslide hazard assessment (Crozier and Glade, 1999) but this is not the purpose of our work. We recommend that future work attempt to take ac-count of these factors since they will clearly produce a more effective base scenario (landslide susceptibility map) upon which our framework may be applied.
5 Conclusions
In the present paper, after reviewing existing studies regard-ing landslide risk and vulnerability assessment we found out that not much has been done in the field of landslide vul-nerability assessment. We apply here a new framework to a landslide susceptible area based on the development of an “elements at risk database”, in order to assess the vulnerabil-ity of the buildings to landslide.
It may be asked why such a detailed study concerning the vulnerability of a community to landslides is necessary. The answer to this question includes the following:
1. The landslide hazard in the area is realistic but not very high, resulting in an underestimation of the real risk. 2. It would be impossible due to high costs to reinforce
ev-ery building located within the landslide susceptibility zones. It is of vital importance that disaster managers
and emergency planners are provided with detailed in-formation regarding the location of buildings, infras-tructural units and groups of people that are vulnerable to landslide events. This leads to cost effective mitiga-tion measures and good prioritisamitiga-tion of resources. 3. Finally, through this study the advantage of using a GIS
database of elements at risk and their characteristics as far as a specific disaster type is concerned is demon-strated. The advantage of using a GIS database rather than an inventory containing this information is that the GIS database can be updated easily, it can be used by various stakeholders according to their needs and prior-ities and that different weight factors can be applied to the data.
Based on the limitations of the framework such as the availability of a reliable landslide hazard or susceptibility map, the availability and costs of required data, alternative weighting of factors and the inclusion of landslide associated phenomena, improvements to our approach could be made. These improvements could focus on the acquisition of better quality data, the identification of more landslide prone areas and the modification of the framework to include landslide-associated phenomena. Moreover, the inclusion of magni-tude and frequency of the landslide to the assessment and a non-linear regression sensitivity analysis in order to de-termine which attribute of the database influences more the overall vulnerability of the building, could improve the out-come of our study significantly. Last but not least, one of the main advantages of the approach presented here is that it can be easily used in the future for multi-hazard risk assessment if the database is populated with data regarding the vulnera-bility of the elements at risk as far as other types of hazards are concerned.
Edited by: M. Keiler, S. Fuchs, and T. Glade
Reviewed by: A. Kaynia and another anonymous referee
References
Adger, W. N.: Vulnerability, Global Environ. Change, 16, 268–281, 2006.
Bell, R. and Glade, T.: Quantitative risk analysis for landslides-Examples from Bildudalur, NW-Iceland, Nat. Hazards Earth Syst. Sci., 4, 117–131, 2004,
http://www.nat-hazards-earth-syst-sci.net/4/117/2004/.
Bibus, E. and Terhorst, B.: Mass Movements in Southwest Ger-many: Analyses and Results from the T¨ubingen Work Group of the MABIS Project, in: Zeitschrift f¨ur Geomorphologie, edited by: Dickau R. and Schmidt, K., Supplementband 125, Gebr¨uder Borntraeger, 93–103, 2001.
Bl¨ochl, A. and Braun, B.: Economic assessment of landslide risks in the Schwabian Alb, Germany-research framework and first re-sults of homeowners and experts surveys, Nat. Hazards Earth Syst. Sci., 5, 389–396, 2005,
Crozier, M. J. and Glade, T.: Frequency and magnitude of land slid-ing: fundamental research issues, in: Magnitude and Frequency in Geomorphology, edited by: Crozier, M. J. and M¨ausbacher, R., Proceedings of the Fourth International Conference on Geo-morphology, Bologna, 1997, Vol. II, 115, 141–155, 1999. Dominey-Howes, D. and Papathoma, M.: Validating the
“Papath-oma Tsunami Vulnerability Assessment Model” (PTVAM) using field data from the 2004 Indian Ocean tsunami, Nat. Hazards, 40, 113–136, 2007.
EPFL: Ecole Polytechnique de Lausanne: Relevant Criteria to as-sess vulnerability and risk. Unpublished Deliverable (D16) of project IMIRILAND: Impact of Large Landslides in the moun-tain environment, 2002.
JRC: Lessons Learnt from landslide disasters in Europe, EUR 20558 EN, 91 pp., 2003.
Glade, T. and Crozier, M.: The nature of landslide hazard impact, in: Landslide hazard and risk, edited by: Gladem T., Andersonm M.m and Crozierm M., Wiley, Chichester, 43–74, 2005. Gomes, J.: Landslide susceptibility and risk maps of Regua (Douro
basin, NE Portugal), Proceeding of the IAG and IGU-C12 Re-gional Conference “Geomorphic hazards; towards the prevention of disasters”, Mexico City, Mexico, 2003.
Helmer, M. and Hilhorst, D.: Natural Disasters and Climate Change, Disasters, 30(1), 1–4, 2006.
Hollenstein, K.: Reconsidering the risk assessment concept: Stan-dardizing the impact description as a building block for vulner-ability assessment, Nat. Hazards Earth Syst. Sci., 5, 301–307, 2005,
http://www.nat-hazards-earth-syst-sci.net/5/301/2005/.
John Heinz III Center for Science, Economics and the Environment: The Hidden Costs of Coastal hazards, Implications for risk as-sessment and mitigation, Island Press, 219 pp., 2000.
Neuh¨auser, B.: Probabilistische Beurteilung der Rutschanf¨alligkeit zur Einsch¨atzung der Gef¨ahrdung durch Hangrutschungen am Beispiel Schw¨abische Alb (Probabilistic Assessment of Land-slide Susceptibility for Landlside Hazard Estimation in the Swabian Alb), in: Angewandte Geoinformatik 2005 – Beitr¨age zum 17. AGIT-Symposium Salzburg, edited by: Strobl, J., Blaschke, T., and Griesebner, G., Wichmann Verlag, Heidelberg, 129–137, 2005.
Papathoma, M.: Assessing tsunami vulnerability using GIS with special reference to Greece, unpublished PhD thesis, Coventry University, 290 pp., 2003.
Papathoma, M. and Dominey-Howes, D.: Tsunami vulnerability as-sessment and its implications for coastal hazard analysis and dis-aster management planning, Gulf of Corinth, Greece, Nat. Haz-ards Earth Syst. Sci., 6, 733–744, 2003,
http://www.nat-hazards-earth-syst-sci.net/6/733/2003/.
Papathoma, M., Dominey-Howes, D., Zong, Y., and Smith, D.: Tsunami vulnerability assessment in Greece using GIS, Nat. Hazards Earth Syst. Sci., 3, 377–389, 2003,
http://www.nat-hazards-earth-syst-sci.net/3/377/2003/.
Scavia, C. and Castelli, M.: The IMIRILAND project- Impact of Large Landslides in the Mountain Environment: identification and Mitigation of Risk, in: Seismic and Landslide Risk in the European Union, edited by: Yeroyianni, M., Workshop Proceed-ings, 12–13 November 2002, 82–91, 2003.
UNU (United Nations University): Landslides, News Release MR/E01/06, 17 January 2006.
USGS: Socioeconomic and Environmental Impact of Landslides, U.S. Geological Survey Open-File report 01-0276, 39 pp., 2001. Voogd, H.: Multi Criteria Evaluation for Urban and Regional
Plan-ning, Pion Limited London, 367 pp., 1983.
Internet sources
Hong Kong Slope Safety Website of Geotechnical Engineering Office (GEO), CEDD: http://hkss.cedd.gov.hk/hkss/eng/studies/ qra/, access: November 2007.
OFDA/CRED International Disaster Database Universite Catholique de Louvain, Belgium: http://www.em-dat.net, access: August 2007.
British Columbia Knowledge Network: http://www. knowledgenetwork.ca/slide/, access: August 2007.