www.nat-hazards-earth-syst-sci.net/8/1387/2008/ © Author(s) 2008. This work is distributed under the Creative Commons Attribution 3.0 License.
and Earth
System Sciences
foF2 seismo-ionospheric effect analysis: actual data and numerical
simulations
E. V. Liperovskaya1, P.-F. Biagi2, C.-V. Meister3, and M. V. Rodkin4
1Institute of Physics of the Earth of the Russian Academy of Sciences, Bolshaya Gruzinskaya 10, 123995 Moscow, Russia 2Physics Department, University of Bari, 70126 Bari, Italy
3Project Physics of Stellar and Planetary Atmospheres, An der Sternwarte 16, 14482 Potsdam, Germany 4Geophysical Centre of the Russian Academy of Sciences, Molodejnaya 3, 117296 Moscow, Russia Received: 14 July 2008 – Accepted: 20 August 2008 – Published: 11 December 2008
Abstract. On the background of seasonal and helio-geomagnetic disturbances, disturbances of the ionization density near noon connected to earthquakes are investigated. The study is performed for some tens of earthquakes with magnitudesM>5 and depthsh<70 km, which occur at dis-tances from the vertical sounding stations “Tokyo”, “Akita”, and “Yamagawa” not larger thanR=exp(M)+150 km. The analysis is performed using data registered by the three sounding stations every hour during 30 years. Especially methods of the statistical analysis are applied to search for regularities in the lithospheric-ionospheric links before and after earthquakes. The growth of the mean ionization density
N at the F-layer electron density maximum Fof2 five-three days before earthquakes, and the decrease ofN approach-ing the eruption and durapproach-ing a few days after the earthquake is investigated in dependence on both the magnitude of the earthquakeMand the ionization densityN near the F-layer maximum. It is found that some days before earthquakes the decrease of the ionization density1N is proportional to the values ofMandN. After the earthquakes,1N depends much weaker on the magnitudeM, and it is not influenced by the ionization densityN. The variations of the ionization density three days before earthquakes do not depend onN
andM(within the same order of approximation).
Correspondence to: C.-V. Meister
1 Introduction
Almost all investigations performed up to now with respect to the lithospheric-atmospheric-ionospheric links had the aim to search for ionospheric precursors of earthquakes, and to solve the problem of the short-time prediction of earth-quakes. Thus it was found, that the ionospheric precursors in different regions on the Earth have a very difficult tem-poral and spatial structure. Maximum effects are not al-ways obtained above the epicentres, and the amplitude of the precursor does not always increase when the time ap-proaches the eruption (Pulinets and Boyarchuk, 2004; Liu et al., 2006; Liperovsky et al., 2002; Singh et al., 2004). Thus, sometimes the conclusions of the investigations con-cerning regularities of the ionospheric precursors of earth-quakes seem to be contradictory. In the present work, varia-tions of the foF2-frequency, that means the ionization density at the F2-layer maximum, some days before and some days after earthquakes are analysed using data of the Japanese ver-tical sounding stations “Tokyo”, “Akita”, and “Yamagawa”.
The main aim of the work is the search for regularities of lithospheric-ionospheric links connected to earthquakes us-ing different vertical soundus-ing stations. The interest is in the dependence of seismo-ionospheric effects on the magnitude of the earthquakes and on the ionization density at the F-layer maximum.
2 Experimental data and method of analysis
1388 E. V. Liperovskaya et al.: foF2 variation analysis: actual data and numerical simulation = 130.4◦E, 1957–1988) http://spidr.ngdc.noaa.gov/spidr/ are
used.
Earthquakes with magnitudesM>5 and depths of the epi-centers smaller than 70 km are considered. Searching for earthquake precursors, it is always of large importance to know, at which distances from the epicentres the effects are registered. Here, it is assumed that the studied phenomena of the F-layer are caused by acoustic and electromagnetic dis-turbances which are excited in the whole earthquake prepara-tion region. The dimension of the earthquake preparaprepara-tion re-gion is estimated by the Dobrovolsky formulaRD∼exp(M)
(Dobrovolsky et al., 1979). Disturbances caused by earth-quakes may propagate up into the atmosphere and iono-sphere not strongly vertically, but under a small tilding an-gle to the vertical. The maximum of the F-layer is situ-ated at an altitude of the order of 300 km. Further, it is suggested that the acoustic or electromagnetic disturbances have yet a sufficiently large amplitude, if the tangens of the angle between the propagation direction and the vertical is smaller than 0.5. Thus searching for earthquake precursors, events with distances between the epicenters and the ver-tical sounding stations less thanL=RD+150 km≈500 km
have to be taken into account. Therefore, concerning the sta-tions “Tokyo” and “Akita”, earthquakes situated at distances
R<RD+150 km=500 km are analysed. The station
“Yama-gawa” is located in the south of the Isle of Kjushju, and thus the ocean coincides with large parts of the preparation re-gions of the appearing earthquakes. Thus, in this case earth-quakes atR≤RDare studied.
First rough earthquake investigations showed for the sta-tions “Tokio”, “Akita”, and “Yamagawa”, that no seismo-ionospheric effects are obtained for events with depths larger than 70 km and distancesR larger than considered here. In the present work, the dependence of the seismo-ionospheric effects on the hypocenter and the distance between the verti-cal sounding station and the epicenter is not studied. In cases when on one and the same day more than one earthquake oc-curred, all the earthquakes of the day are considered as one event.
The day-time ionospheric F-layer forms under the influ-ence of the solar radiation with wavelengths of 14–80 nm on the neutral atmosphere. Thus, the atmospheric ionization is mainly connected with the ionization of oxygen O and nitro-gen molecules N2. The altitude and the value of the main electron density maximum of the F-layer, which is charac-terized by the critical frequency foF2, depend on the com-petition between the ionization processes by the solar radia-tion and the recombinaradia-tion. The ionizaradia-tion intensityNin the F-layer maximum satisfies the relationN=π m(foF2)2/e2, whereeis the elementary charge andmthe electron mass. For the study of the ionization density, in this work, first the hourly mean values were found, and then the average value for the hours between 11:00 LT and 16:00 LT is chosen. At this time, on the one side, the maximum plasma density of the layer is largest, and, on the other side, the area with
max-imum ionization is situated at lower altitudes than at other hours. Thus one may conclude that seismo-ionospheric ef-fects are largest during this time interval.
The ionization density of the F-layer possesses a rather dif-ficult seasonal dependence. It has two maxima, in spring and in autumn, and two minima, in winter and in summer. Be-sides, it is influenced by the 11-years and the 27-days solar activity cycles. To reduce the influence of the season and the 27-days solar cycle, the average value of the ionization den-sityN15 days(i)over the time interval of 15 days (starting with the dayi−7 and ending with the dayi+7) is subtracted from the mean value. The difference 1N (i)=N (i)−N15 days(i) depends yet on the 11 years solar activity cycle. To dimin-ish also this effect,1N (i)is normalized by the mean square value of1N (i), that means byσ (1N (i)). Thus, every day of the analysed time interval is characterized by the normal-ized function1Nnorm(i)=1N (i)/σ (1N (i)). The values of
1Nnorm(i)already weakly depend on the season, and the 27-days and 11-years solar variations. The distribution function
1Nnormis an almost normal one.
The temporal behaviour of the ionization densityNshows sometimes very large positive and (more seldom) negative modifications, which are much larger thanσ (1N (i)). There were performed separate analyses to show if these modifica-tions are indeed connected to earthquakes. During the here studied 12 418 days, there are 120 days with large modifica-tions. For these days the method of superposition of epoches is performed. For the day 0 the days with disturbances larger than 2σ (1N (i))are taken. Within the time intervals (+5, – 5) of these days, there happened 28 earthquakes withM>5 – of a total of 358 events, 12 earthquakes withM>5.5 – of a total of 138, and 3 earthquakes withM>6 – of a total of 39. Therefrom one may conclude that during the days of the strong modifications the number of earthquakes does not in-crease. Besides, the number of the days with strong modifi-cations is rather small. So, in the present work searching for general regularities, these days are excluded from the anal-ysis. It is estimated that the exclusion of the days does not change the final result of our statistics by more than 8%.
The ionospheric effects of earthquakes have to be found also on the background of solar and geomagnetic distur-bances. Thus only days with not too strong disturbances are taken into account. Of course, there do not exist generally ac-cepted criteria which disturbances should be excluded from the analysis. In the present work days with Wolf numbers
W >200 are neglected. As known, ionospheric disturbances may continue to exist for days after strong geomagnetic dis-turbances. Thus, days with6Kp>25, and the following day
in each case, are not taken into account too. Here it has to be mentioned that a large part of the strong modifications, 83 out of 120, were possibly caused by large solar activ-ity withW >200 and increased geomagnetic distrubances of
6Kp>25. For the analysis, the remaining series of the
ion-ization densityN, the differences to the 15-days mean values
Fig. 1. Results of the superposition of epoches for1N¯normfound
for 66 earthquakes of magnitudeM>5.5 registered by the station “Tokyo”. The day 0 is the day of the earthquakes.
there are series with lacks of datas. Consequently, from the initially 12 418 data to be studied, there are finally analysed only half of them.
3 Results of the superposition of epoches for different vertical sounding stations
The method of the superposition of epoches is applied for the function of the normalized values1Nnorm(i)of the differ-ences between the ionization density and its 15-days mean values. The superposition of epoches is performed for the time intervals of 21 days, that means within the interval (–10, +10), for earthquakes with magnitudesM>5.5 registered by the stations “Tokyo”, “Akita” and “Yamagawa”. So the func-tions1N¯
norm are found. For the station “Tokyo” there are considered 66 earthquakes, for “Akita” – 84 events, and for “Yamagawa” 21 events. The results of the analyses are pre-sented in Figs. 1–3. It is to be seen, that, on the average, the value of1N¯norm grows on the days (–5, –4, –3), and it decreases on the days (0, +1, +2).
The sounding station “Tokyo” is situated at the region of intersection of three tectonic plates. This seems to be the rea-son for the fact that seismo-ionospheric phenomena found during the study of data of “Tokyo” are more strong than such phenomena found using data of the stations “Akita” and “Yamagawa”. The here obtained seismo-ionospheric ef-fects seem to depend on the Earth’s core near the sounding stations. For data of “Tokyo” the increase and decrease of
¯
1Nnorm is even obtained for earthquakes with magnitudes 5.5>M>5.0 (see Fig. 4). For the related superposition of epoches, 82 events existed. Performing the analysis for such rather weak earthquakes with 5.5>M>5.0, time intervals
Fig. 2. Results of the superposition of epoches for1N¯normfound
for 84 earthquakes of magnitudeM>5.5 registered by the station “Akita”. The day 0 is the day of the earthquakes. The dash-dotted line gives the mean values over the whole time interval of the 30 analysed years. The dotted line shows 95% of the reliability of the results of the analysis. The interval of reliability is found by Monte Carlo method.
(–7, +7) around stronger earthquakes withM>5.5 are ne-glected.
The thin full lines in Figs. 1–5 give the mean value of ¯
1Nnorm. In the case of “Tokyo”, the decrease of1N¯norm af-ter the earthquakes is also considerable. Applying the super-position of epoches method, data for every day are available, in the average, for 67 events.
The reliability interval is calculated modeling the back-ground distribution with the help of a random process. It is assumed, that the earthquakes are homogeneously distributed within the observational time interval. Using a generator of random numbers, days of virtual earthquakes are chosen. The number of virtual earthquakes equals the number of real ones. Then, the superposition of epoches method is applied to the virtual earthquakes in the same way as to the real earth-quakes. This procedure is repeated for a thousand of series of virtual earthquakes.
1390 E. V. Liperovskaya et al.: foF2 variation analysis: actual data and numerical simulation
Fig. 3. Results of the superposition of epoches for1N¯
normfound
for 21 earthquakes of magnitudeM>5.5 registered by the station “Yamagawa”. The day 0 is the day of the earthquakes. The dash-dotted line gives the mean values over the whole time interval of the 30 analysed years. The dotted line shows 95% of the reliability of the results of the analysis. The interval of reliability is found by Monte Carlo method.
Fig. 4. Results of the superposition of epoches for1N¯normfound
for 82 earthquakes of magnitudeM>5.5 registered by the station “Tokyo”. Time intervals (–7, +7) near earthquakes withM>5.5 are not taken into account. The day 0 is the day of the earthquakes. The dash-dotted line gives the mean values over the whole time interval of the 30 analysed years. The dotted line shows 95% of the reliability of the results of the analysis. The interval of reliability is found by Monte Carlo method.
Fig. 5. Results of the superposition of epoches for1N¯normfound
for 172 earthquakes of magnitudeM>5.0 registered by the station “Tokyo”. Time intervals (–7, +7) near earthquakes withM>5.5 are not taken into account. The day 0 is the day of the earthquakes. The dash-dotted line gives the mean values over the whole time interval of the 30 analysed years. The dotted line shows 95% of the reliability of the results of the analysis. The interval of reliability is found by Monte Carlo method.
4 Investigation of the dependence of the variations of the ionization density of the F-layer maximum on the ionization density and the magnitude of the earth-quake some hours before the eruption
Now, for the analysis, earthquakes are taken into account, which happened in the time interval of 24 h after the daily measurements lasting from 11:00 UT till 16:00 LT, or lasting from 02:00 UT till 07:00 UT. First rough studies showed that, during time intervals of days, the mean value of the ampli-tude of the decrease of the ionization density does not depend on the time before the eruption.
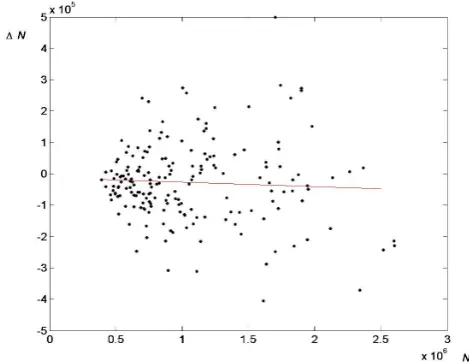
Figure 6 shows the function 1N (N ) for the selected earthquakes. One may suggest, that seven variations with|1N|>5×10⁵ are caused by non-seismic reasons, as they are obtained for all Japanese stations, for “Tokyo”, “Akita”, “Yamagawa”, and “Vakkanai”. These seven mea-surements are excluded from the analysis. Using the method of smallest squares, the regressive dependence
1N (N )=−0.04×N+1.2×10⁴is obtained. The correlation coefficient between 1N and N equals r=–0.22. As 172 earthquakes are taken into account, the confidence of the de-pendence1N (N )is larger than 95%.
Fig. 6. Dependence of the variation of ionization density1N (N ) on the ionization densityNin the F-layer maximum 24 h before the earthquakes. The red line shows the regressive dependence.
5 Investigation of the dependence of the variations of the ionization density of the F-layer maximum on the ionization density and the magnitude of the earth-quake some hours after the eruption
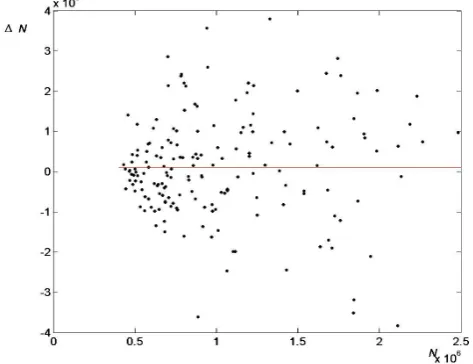
Let us consider ionospheric phenomena occurring some hours after earthquakes, that means on the day (+1). Per-forming first rough studies it was found, that during the first day after an earthquake, the mean value of the amplitude of the decrease of the ionization density does not depend on the time of the earthquake after the eruption. Figure 8 shows that the density indeed decreases on the day (+1) with the time. Investigating the dependence1N (N ), analogously to the discussion in the previous section, cases of very strong variations of the density – here with|1N|>4×105cm−3– are excluded from the analysis. As result of the analysis, one finds a correlation coefficient between1NandNofr=– 0.07. As 186 earthquakes are taken into account, the obtained effect is very weak. The mean decrease of the ionization den-sity is about –2.8×104cm−3.
Further, the dependence of the variation of the ionization density1N on the magnitude of the earthquakeM is stud-ied. Here variations1N >4×105 cm−3are neglected. For the correlation coefficient between1N andM, a value of
r=−0.11 is found. Consequently the confidence of the re-sult is about 90%. The dependence1N (N )satisfies the rela-tion1N (N )=−2.0×10³×M−2.0×10⁴. Thus, the decrease of the ionization density after the earthquake depends much more weakly on the magnitude of the event than the decrease before the earthquake.
Fig. 7. Dependence of the variation of ionization density1N (M) on the magnitude 24 h before the earthquakes. The red line shows the regressive dependence.
Fig. 8. Dependence of the variation of ionization density1N (N ) on the ionization densityNin the F-layer maximum 24 h after the earthquakes. The red line shows the mean value of the decrease of 1N.
6 Investigation of the dependence of the variations of the ionization density of the F-layer maximum on the ionization density and the magnitude of the earth-quake three days before the eruption
1392 E. V. Liperovskaya et al.: foF2 variation analysis: actual data and numerical simulation
Fig. 9. Dependence of the variation of ionization density1N (M) on the magnitude 24 h after the earthquakes. The red line shows the mean decrease of1Nafter the earthquake.
Fig. 10. Dependence of the variation of ionization density1N (N ) on the ionization densityNin the F-layer maximum during the third days before the earthquakes. The red line shows the mean value of the increase of1Non the day (–3).
on the day (–3), two cases of very strong variations of the density with|1N|>4×105cm−3are excluded from the anal-ysis. As result, one obtains a correlation coefficientrof only –0.03 between1NandN. The mean increase of the ioniza-tion density is about 1.1×104cm−3. In Fig. 10, the depen-dence1N (N )is presented.
Further, the dependence of the variation of the ionization density1N on the magnitude of the earthquakeM is stud-ied. Here variations1N >4×105cm−3are again excluded from the consideration (that means in two cases). For the
Fig. 11. Dependence of the variation of ionization density1N (M) on the magnitude three days before the earthquakes. The red line shows the mean increase of1Non the day (–3).
correlation coefficient between1N andMa valuer=–0.06 is found. As only 172 days are taken into account, the phe-nomenon seems not to be so important. From Fig. 11 follows that for earthquakes with a magnitudeM>6 no increase of
1N is found. And indeed, calculating the mean value of the increase for 6.0>M>5.0, one obtains 1.1.×104 cm−3, which is about two times the mean value for all earthquakes considered.
7 Discussion of the results and conclusions
In the present work, the temporal behaviour of the ioniza-tion density in the F2-layer maximum is studied on the basis of measurements by the vertical sounding stations “Tokyo”, “Akita” and “Yamagawa” during 30 years. As result, some regressive relations for the dependence of the variations of the ionization density on the ionization density in the F-layer maximum and on the growth rate of the earthquakes are found. Different regularities of the ionization density before and after earthquakes are described. As result follows that, in connection to earthquakes, different lithospheric-ionospheric links exist. A first coupling mechanism seems to be realized some days before earthquakes. Another coupling mechanism occurs especially during the fifth to third day before the erup-tions. And a third mechanism takes place some hours after the earthquakes. The first and second mechanisms seem to be completely different, while the first and third mechanisms seem to be somewhat similar, or to have at least similar phys-ical consequences.
decreases some hours before the earthquakes. With a con-fidence of about 90%, the dependence of the decrease on the magnitude of the earthquakes may be described by a lin-ear function. And this decrease also depends almost linlin-early (with a realization probability of 95%) on the ionization den-sity of the ionosphere.
For the decrease of the ionization density a few days after earthquakes also a dependence on the magnitude of the earth-quake was obtained. The confidence of the here proposed an-alytical formula seems to be of the order of 90%. No direct dependence on the ionization density could be shown for the decrease of the ionization density after the earthquakes.
For the growth of the ionization density about three days before earthquakes, no reliable linear dependence on the magnitude or the ionization density could be found. There seems to exist a non-linear indirect dependence of the ion-ization density on the magnitude. The growth of the ioniza-tion density is obtained before erupioniza-tions with a magnitude 6>M>5, and it is not found for magnitudesM>6. May be, in cases of earthquakes withM>6 three days before the erup-tion already the other physical mechanism is active, which causes a decrease of the density.
The authors of the present paper hope that the depen-dencies between the variations of the ionization density of the F-layer and the ionization density itself as well as between the variations and the magnitude of the earthquake obtained will be proven and refined in future analysing also data of other vertical sounding stations besides “Tokyo”, “Akita”, and “Yamagawa”. This approach will help to verify proposed theoretical models of the physical processes of lithosphere-ionosphere coupling.
Edited by: M. Contadakis
Reviewed by: V. Bogdanov and another anonymous referee
References
Dobrovolsky, I. R., Zubkov, S. I., and Myachkin, V.I.: Estimation of the size of the earthquake preparation zones, Pageoph., 117, 1025–1044, 1979.
Liperovskaya, E. V., Bogdanov, V. V., Biagi, P.-F., Meister, C.-V., Liperovsky, V. A., and Rodkin, M. V.: Day-time variations of foF2 connected to strong earthquakes, EGU 2008-A-02292, XY0382, 2008.
Liperovsky, V. A., Meister, C.-V., Popov, K. V., Liper-ovskaya, E. V., Molchanov, O. A., and Silina, A. S.: On the time scales of some seismo-ionospheric effects, Seismo-Electromagnetics: Lithosphere-atmosphere-ionosphere coupling, edited by: Hayakawa, M. and Molchanov, O. A., Tokyo, TERRAPUB, 325–327, 2002.
Liu, J. Y., Chen, Y. I., Chuo, Y. J., and Chen, C. S.: A statistical investigation of preearthquake ionospheric anomaly, J. Geophys. Res., 111, A05304, doi:10.1029/2005JA011333, 2006.
Pulinets, S. A. and Boyarchuk, K. A.: Ionospheric precursors of earthquakes, Springer, Berlin, Heidelberg, New York, 2004. Singh, B., Kushwah, V., Singh, O. P., Lakshmi, D. R., and Reddy,