Two-dimensional modeling of the electrical breakdown in
rare gases
F. Ghaleb1, A. Belasri1
1Laboratoire de Physique des Plasmas, Matériaux Conducteur et leur Application U.S.T.O MB
Faculté des Sciences, Département de Physique El M’Naour B.P.1505 Oran , Algérie
Abstract. In this work a two-dimensional numerical study of dielectric barrier discharge has been proposed in order to understand the breakdown process in rare gases. We used a fluid model which is based on the numerical solution of the two Boltzmann equations (continuity and momentum); these equations are coupled to the Poisson’s equation. This model allowed us to plot the Paschen curve, which represents the breakdown voltage as a function of pressure-distance product. The aim of the study is to optimize the applied voltage and to understand how the discharge geometry and other physical parameters such as the secondary emission coefficient affected the breakdown voltage.
1 Introduction
In the last century, more and more of the industrial applications were based on the technology of the electrical discharge as well as plasma display panels, the tubes of lighting and the arc welding [1]. The most significant question in the plasma industrial applications is the optimization of the energy consumption, which is related to the breakdown voltage [2]. However, the gas breakdown process has assumed new importance in particularly for further development these devices. Electrical breakdown in a rare gas is the process of the transition from the insulator in a conducting state, when a sufficiently intense electric field is applied between two electrode plates [3]; the value of the voltage associated with this transition names breakdown voltage or ignition voltage east corresponds to the first value of the voltage for which the discharge becomes self-sustained [4]. The gaz breakdown voltage is a state of balance between the production of electrons by secondary emission caused by the ion bombardment of the electrode and the electron loss by diffusion or absorption at the anode [5, 6]. Paschen [7] was the first scientist to study the electric breakdown of dielectric gases between metallic electrodes, and then formulate the so-called Paschen law which has been so effective in the prediction of electrical breakdown of dielectric gasses. This law establishes the dependence of the breakdown voltage as a function of the product of two parameters: pressure and inter-electrode distance [8].
The outline of this paper is as follows: the Two-dimensional fluid (2D) used in this paper is presented in Section 2. In Section 3, the salient numerical results are presented and followed by the discussion on the breakdown voltage. The conclusion of the work is summarized in Section 4.
EPJ Web of Conferences DOI: 10.1051/
C
Owned by the authors, published by EDP Sciences, 2013 ,
epjconf 201/
04003 (2013) 44
34404003
2 Fluid Model
The physical model on which is based this work is a 2D fluid model [9]. It consists of the two first moment equations for electrons and ion transport coupled with Poisson’s equation, in order to take into account the variations of the electric field [10-11]. The two Boltzmann equations (equation of continuity and momentum) and Poisson’s equation are represented by [12-13]:
, . , , , (1)
, , , , . , , (2)
. (3)
Where n is the density of charged particles (e for electrons, p for positive ions or negative). S is the source term of the equation of continuity, he reports the creation (ionization) and losses (attachments, recombination) of charged particles, , represents the average speed, E the electric field, , is always positive corresponding to the mobility of electrons and ions, , is the diffusion coefficient, and are the dielectric and vacuum permittivity respectively.
The breakdown is said to occur when the maximum total ion density reaches a given value within a given time interval. The result will obviously depend on the initial electron and ion density (supposed to be uniform in the gap). The initial density is equal to 104 cm-3 and the maximum total ion density at breakdown is 1011 cm-3[14]. The design of the 2D discharge cell is showed on “Figure1”. The dielectric covering the electrodes has a different relative permittivity. These electrodes are separated by a distance of 0.05 cm. This space is filled by various gases or mixture.
Fig.1. The geometry of the discharge cell
3 Results and discussion
3.1. Secondary emission effect
can be sufficient to extract the secondary electrons from cathode [16-17]. Several empirical expressions of the emission coefficient by cathode ionic bombardment (the number of electrons emitted by incidental ions) are given in the literature [18-19]
0.032 0.78 2
(4)
With the potential energy of the incidental particle (ion), the work function of the solid, table 1 shows the values of secondary emission coefficient ( ) in argon and helium discharges according to the used cathodes materials.
Table 1. Secondary emission coefficient
Cathode material He Ar
Ag(Silver) 0.31 0.09
Mg(Magnesium) 0.38 0.16
Al(Aluminium) 0.34 0.11
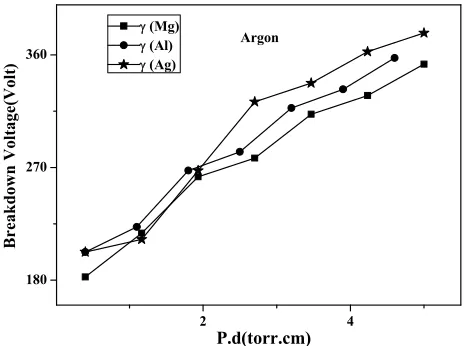
We calculated the Paschen voltage for two pure gases, argon and helium which are evoked by the two following figures.
2 4
180 270 360
Br
eak
do
w
n Voltage
(Vol
t)
P.d(torr.cm) (Mg)
(Al) (Ag)
Argon
3 6 120
160 200
B
rea
k
d
ow
n
V
ol
ta
ge(
V
ol
t)
P.d(torr.cm) (Ag)
(Al) (Mg)
Helium
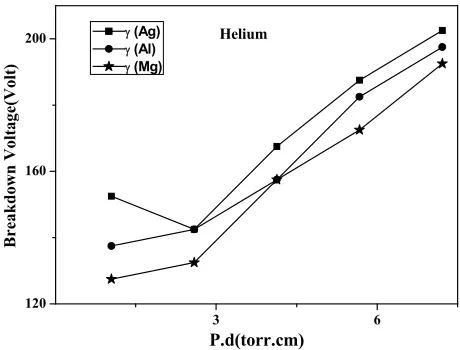
Fig.3. Dependence of the breakdown voltage on the pressure-gap spacing product in helium. Square, circle symbol correspond to the silver, magnesium material, and the results of aluminium cathode are
obtained by star symbols
Figure 2 shows the Paschen curves for Ar gas obtained by simulation 2D fluid, using the three cathodes. The breakdown voltage (Vb) for the three cathodes occurs at the value of (p.d) varies from 0.5 to 5 torr.cm. The minimum breakdown voltage (Vbmin) was found to depend upon the type of the cathode material. This can be related to the difference in the work function of the different cathodes. However, the breakdown voltage increases gradually when increasing p.d, which can be attributed to the decrease in the ionization cross-section. Therefore, electrons need more energy to breakdown the discharge gap; resulting in an increase of Vb. we measured the breakdown voltage in Ar discharge using the secondary emission coefficient of Ag and Al cathode. The minimum breakdown voltage (Vbmin) was found to be 202 Volt at (p.dmin) = 0.3 torr.cm, while in the minimum breakdown (Vbmin) was found to be 182 Volt at (p.dmin) = 0.4 torr.cm for the type of cathode Mg. Figure 3 shows the typical Paschen curves for helium discharge using the three cathodes. The minimum breakdown voltage, (Vbmin), for the three cathodes, occurs at a value of (p.dmin) = 1 torr.cm. (Vbmin) has been found for He discharge at 127, 137 Volt and 152 Volt for magnesium and aluminium and silver cathodes, respectively. One can notice that the breakdown voltage increases for the larger work functions of the cathode materials. That wants to say a secondary emission coefficient smaller.
3.2. Dielectric barrier effect
2 4 6 240
280 320
r=12 r=10 r= 5 r= 3
Br
eakd
own Voltage
(V
olt)
P.d(torr.cm)
Xe10%-Ne
Fig.4. Plots of measured breakdown voltages versus product of the pressure and the width gap between electrodes in mixture Xe10%-Ne, for different values from the permittivity
2 4
200 250 300 350
P.d(torr.cm)
B
re
akdo
w
n
V
ol
tage
(
V
ol
t)
Le=7,5m Le=15m Le=22,5 m Le=26,25 m
Xe10%-Ne
Fig.5. Breakdown voltage measurements as a function of pressure and gap spacing in Xe10%-Ne. This result represent the fluid calculation, the secondary electron emission coefficient for xenon ions is set to 0.05, for neon equal to 0.5, for several values of Le (width of the dielectric barrier)
4 Conclusion
results show that the breakdown voltage is very affected by the dielectric barriers (width and permittivity).
5 References
1. W.J.M.Brok, « Modelling of transient phenomena in gas discharges » Thése de doctorat, Université Technische Eindhoven, (2005).
2. G. Petraconi, H. S. Maciel, R. S. Pessoa, G. Murakami, M. Massi, C. Otani, W. M. I. Uruchi, and B.N. Sismanoglu, Brazilian. J. Phys, 34, 4B 1662-1666 (2004).
3. Yu. P. Raizer, « Gas discharge physics », Springer-Verlag edition
4. M.J. Druyvesteyn and F.M. Penning, Reviews of Modern Phys 10(2), 87-174 (1940).
5. S. Howard Voldman, « ESD phsics and devices », Editor J. Wiley and Sons, 15 nov (2004). 6. M. Levinshtein, J. Kostamovaara, S. Vainshtein, (Review). IJHSES, 14 (4), 921-1114 (2005). 7. F. Paschen, Wied. Anal. Phys. Chem., 37 69-96 (1889).
8. Y. Ikeda, K. Suzuki, H. Fukumoto, J. P. Verboencoeur, P. J. Christenson, C. K. Bir- sall, M. Shibata, and M. Ishigaki, J. Appl. Phys. 88 6216 (2000).
9. F. Ghaleb, A. Belasri, Radiation Effects & Defects in Solids, 167, (6) 377–383 (2012) 10.T. Callegari, R. Ganter, and J.P.Bœuf, J. Appl. Phys. 88 3905 (2000)
11.C. Punset, S. Cany and J. P, Bœuf, J. Appl. Phys. 86 124(1999).
12.C. Punset, J. P, Bœuf, and L.C. Pitchford, J. Appl. Phys. 83 1884 (1998). 13.A. Belasri, W. Benstâli, and H. Haffaf, Rev. Energ. Ren. 6 35 (2003)
14.F. Ghaleb, W. Benstâali and A. Belasri, J. Materials Science and Engineering: C, 28 791-794 (2008).
15.J.P. Boeuf, J. Appl. Phys., 63 1342-1349 (1988).
16.A.V. Bodarenko, Sov. Phys. Tech. Phys., 18, 515 (1973).
17.A. Lieberman and A. Lichtenberg, « principles of plasma discharge and materials processing ». , New York: John Wiley & Sons. 600, (1994).