IJEDR1703189
International Journal of Engineering Development and Research (
www.ijedr.org
)
1287
Taguchi Based Grey Relational Analyses for Multi
Objective Optimization of Response Variables in
CNC Lathe Turning of Aluminium 7075 Alloy
1Navneet Saini, 2Jitender Panchal 1M Tech student, 2Assistant Professor
1Department of Mechanical Engineering, MIET, Ambala, India
________________________________________________________________________________________________________ Abstract: High speed turning has emerged as a key manufacturing technology in machining of different metals and alloys. Turning at high speed is performed on the order of five to ten times the conventional cutting speed. It is advantageous in many ways like reduction in cutting forces and temperature, low power consumption, improvement in surface finish, high MRR, better dimensional accuracy and better part quality [1, 2]. In order to achieve the quality output, it is necessary to set the process parameters (like speed, feed, depth of cut, nose radius) in such a way that it gives optimum combination of MRR and Surface roughness at the same time during the high speed machining of alloy. The study applies Taguchi's design of experiment methodology and grey relational analysis to optimize the response parameters in turning aluminum alloy AA7075-T6 material, a high strength aluminum alloy used for aerospace application using coated carbide insert under dry environment condition and having four type insert nose radius such as 0.2, 0.4, 0.8, 1.2 mm. Experiment have been carried out based on L16 standard orthogonal array design with four process parameters namely cutting speed, feed rate ,Depth of cut and nose radius for surface roughness and Material removal rate[3, 4].The data was analyzed using Grey Relational Analysis (GRA) coupled with Principal Component Analysis (PCA). Analysis of Mean was used to obtain the best set of input parameters. The Grey Relational Grade (GRG) was obtained by Regression analysis at the value of input parameters suggested by optimization technique. The experimental results were validated by comparing the experimental value of GRG with that of the predicted value and the comparison shows a good relationship between them.
Key words- Nose radius, MRR, surface roughness, grey relational analysis, Taguchi approach
________________________________________________________________________________________________________
I.INTRODUCTION
The increase of consumer needs for better quality metal cutting related products in terms of more precise tolerance and better surface finish has driven the metal cutting industry to continuously improve quality control of the metal cutting processes. Surface roughness quality is an important requirement of the finished work pieces in the machining operations. This parameter is of great importance in automotive, aerospace, die and mould manufacturing application.[3]. At the same time, higher material removal rate (MRR) is desired by the industries to cope up with mass production without sacrificing product quality in short span of time. Higher MRR is achieved by optimizing the process parameters like cutting speed, feed and depth of cut. However, very high cutting speed induces the larger power which may exceed the power available in the machine tool. Also it is disadvantageous to both the tool and the product as it causes dimensional inaccuracies by thermal deformation, the machined surface is also affected due to thermal defects and built-up-edge formation and damages the tool sharpness and causes vibration [2]. So, it is necessary to select appropriate process parameters for the effectiveness, efficiency and overall economy of manufacturing by machining to achieve these objectives (higher MRR and product quality). Optimization is the science of getting excellent results subjected to several resource constraints. In the present world scenario, optimization is of the utmost importance for organizations and researchers to meet the growing demand for improved product quality along with lesser production costs and faster production [4]. To cope up with global manufacturing industries, high functional work piece are required in view of the machining operation is considered as important manufacturing process that contributes in economic and best quality manufacturing. Surface roughness and material removal rate plays a very vital role in deciding the productivity in global manufacturing. Surface roughness is one of the important quality control parameter for evaluating of production process, Efficiently turned component improves many functional attributes like desired tolerance, lesser tool wear, fatigue strength, load bearing capacity, corrosion strength and contact friction etc. To achieve all the mentioned attributes, opting for CNC machine tool is the best choice for increasing the productivity in terms of reduced machining time and increased profit. But to minimize surface roughness optimum selection of turning process parameter is very important factor. Therefore Taguchi is used for finding out the optimum set of turning process parameter [5]. The present study uses cutting speed, feed, and depth of cut and nose radius as the machining parameters and the objective is to optimize these parameters so as to find the minimum surface roughness and maximum material removal rate (MRR).
II. Experimental details and methodology A. Experimental set up
IJEDR1703189
International Journal of Engineering Development and Research (
www.ijedr.org
)
1288
the operations such as motor starting & stopping, coolant on & off, tool changing, pallet changing etc. and other miscellaneous functions..Some sensors like proximity switch, limit switch, pressure switch, flow switch and float switch etc. are used as feedback devices to monitor the miscellaneous operations. Thus all operations or CNC machine are monitored continuously with appropriate feedback devices.Table 1: CNC specification
Make M TAB Chennai
Maximum turning diameter 100 mm
Maximum turning length 32 mm
Chuck size 120 mm
Spindle speed 150-3000 rpm
Spindle motor power 0-100 mm/min
The machining is done on a 2 axis CNC lathe of M TAB Company and the work piece was mounted on a magnetic chuck and then machining program was entered in the CNC according to the selected input parameters. A simulation check is done for each run to avoid errors in programming and machining. The turning process is carried out according to the experimental chart designed using orthogonal array.
Figure 1: CNC Lathe Machine
In addition to CNC machine a surface roughness tester SJ-201 was used to directly measure the average surface roughness (Ra) value after performing the turning operation at each work piece at different combination of control parameters designed by Taguchi methodology of DOE.
Figure 2: Surface roughness tester SJ-201
B. Selection of cutting tools
The cutting tool selected for present work is coated carbide inserts with four level of Nose radius
Level 1 Level 2 Level 3 Level 4
0.2 mm 0.4 mm 0.8 mm 1.2mm
C. Selection of work piece material
The work piece material used for current work is Aluminium alloy AA 7075-T6, a high strength aluminum alloy used for aerospace application A total of sixteen circular bars of diameter 25.4 mm and machining length 40mm were turned at different combination of control parameters according to the array designed.
AL 7075-T6 rod
The table shows the mechanical properties of AL 7075 T6 which indicates the various properties and working conditions in which the present material can be used
Table2: Mechanical properties of AL 7075-T6
Tensile strength (MPA) 618.0
Yield strength (MPA) 564.0
Elongation % 11.0
Density (gm/cm3) 2.81
IJEDR1703189
International Journal of Engineering Development and Research (
www.ijedr.org
)
1289
In CNC machine, the turning operation can be easily done by rotating the work piece in the spindle located at the head stock. This can be done by loading the work piece at the magnetic chuck located at the headstock. High precision single point cutting tool (insert) fixed in a tool holder is held rigidly at a tool post and is fed past a rotating work piece in a direction parallel to the axis of the rotation of the work piece at a constant rate, and unwanted material is removed in the form of chips. A tool holder fixed at the tool post has such a arrangement where inserts of different nose radius can be fixed and removed easily. Spindle speed, feed rate and depth of cut can be controlled by feeding specific values in the program stored in the computer memory [5, 6]. The values of each control parameter (Speed, Feed rate, DOC and Nose Radius) were changed according to the design of experiment to obtain different values of response variables (MRR and Ra).III. Experimentation and analysis
The number of input parameters/control factors and their levels involved in a study helps to decide the design of experiment (DOE) to be adopted according to which the experiments are conducted. In the present experiment L16 array is designed by using Taguchi technique and then further process is advanced accordingly. In addition, the robustness of the selected design is also ensured. A design is called robust when it has minimum effect of the noise/uncontrollable factors on the response variables. Details of experiment and analysis technique used in the present study for multi-response optimization is described in the following sections A. Selection of Control Parameters
In the present study four control/input parameters namely, Spindle speed (V), Feed rate (F), Depth of cut (D) and Nose radius (N) are selected. Each parameter has four levels. The parameters and their levels were selected based on the literature review and the rationale behind their selection and their levels are given in this section:
Speed: Speed refers to the rotating speed of the spindle and the work piece. When it is stated in revolutions per minute (rpm) it tells
their rotating speed. In the present study input parameter is taken as spindle speed for optimization purpose [7, 8]. Feed rate: Feed always refers to the cutting tool, and it is the rate at which the tool advances along its cutting path [7, 8].
Fm= f. N mm/min. (1)
Here Fm is the feed in mm/minute, f is the feed in mm/rev and N is the spindle speed in RPM. [10]
Depth of cut: It is the thickness of the layer being removed (in a single pass) from the work piece or the distance from the uncut surface of the work to the cut surface, expressed in mm [7, 8].
D-d =2 x DOC in mm (2) Here D and d represent initial and final diameter (in mm) of the job respectively.
Nose radius: It is the rounded tip on the cutting edge of a single point tool. A zero degree nose radius creates a sharp point of the cutting tool. its value normally varies from 0.4mm to 1.6mm, depending upon several factors like depth of cut, amount of feed, type of cutting, type of tool (solid or with insert) etc [1 ,8].
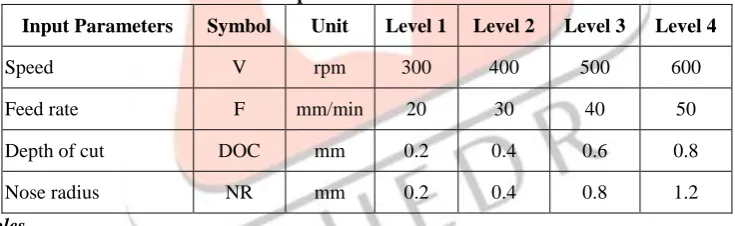
Table 3: Control/Input Parameters and their Levels
Input Parameters Symbol Unit Level 1 Level 2 Level 3 Level 4
Speed V rpm 300 400 500 600
Feed rate F mm/min 20 30 40 50
Depth of cut DOC mm 0.2 0.4 0.6 0.8
Nose radius NR mm 0.2 0.4 0.8 1.2
B. Response variables
Two response variables namely, material removal rate (MRR) and surface roughness (Ra) were measured. The objective was to maximize material removal rate (MRR) and to minimise the surface roughness (Ra).Selected response variables along with their abbreviations and units are given in Table 3.
Table 4: Response Variables
S. No. Response Variables Abbreviation Unit
1. Material removal rate MRR mm3/min
2. Surface roughness Ra µm
Material removal rate:
The material removal rate (MRR) is the volume of material removed per unit time is expressed in mm3/min. In turning operation, for each revolution of the work piece, a ring-shaped layer of material is removed, whose cross- sectional area is product of the distance the tool travels in one revolution (feed) and depth of cut [7,8].
MRR =Initial weight−Final weight
Density x time (3)
Where initial and final weight (in grams) of specimen were measured using digital weighing machine and density of AL 7075 was taken as 2.81 g/cm3 and time taken for turning was also noted using stop watch.
IJEDR1703189
International Journal of Engineering Development and Research (
www.ijedr.org
)
1290
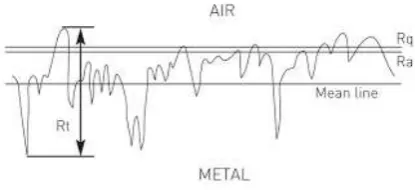
Figure 3: Surface roughness parametersC. Selection of Orthogonal Array- Taguchi Method
An orthogonal array (OA) proposed by Taguchi can be used to investigate the effect of input parameters of a system or process on the response variables with lesser number of experiments. OA is selected on the basis of number of input parameters and their levels involved in the experimentation. The number of parameters and their levels, helps us to deicide the minimum number of experimental runs required for investigation which is obtained from the relation (L-1) P + 1, where L is the number of levels and P is the number of input parameters. In the present study, since L = 4 and P = 4, therefore, minimum number of experiments required to be performed is (4-1) x 4 + 1 = 13. Therefore, in the present study L16 orthogonal array was selected as shown in Table 4 [11]. Standard statistical software such as Minitab can be used to select standard OA and to perform the data analysis and in the present study Minitab 17 was used for this purpose.
Table 5: Showing Taguchi Orthogonal array RUN
NO.
Speed Feed DOC NR MRR Mean
Surface roughness
1 300 20 0.2 0.2 355.8 1.29
2 300 30 0.4 0.4 1070.2 1.43
3 300 50 0.6 0.8 2669.0 1.51
4 300 40 0.8 1.2 2846.9 1.16
5 400 20 0.4 0.8 711.7 1.72
6 400 30 0.2 1.2 535.1 0.55
7 400 40 0.8 0.2 2846.9 1.66
8 400 50 0.6 0.4 2669.0 1.59
9 500 20 0.6 1.2 1067.6 0.57
10 500 30 0.8 0.8 2140.5 0.95
11 500 40 0.2 0.4 711.7 1.21
12 500 50 0.4 0.2 1779.3 2.15
13 600 20 0.8 0.4 1423.4 1.17
14 600 30 0.6 0.2 1605.4 1.14
15 600 40 0.4 1.2 1423.4 0.74
16 600 50 0.2 0.8 889.6 1.07
D. Analysis of S/N Ratio
For MRR larger-the-better criterion was used as the objective was to maximize it and S/N ratio was calculated using Eq. (1). Similarly, for surface roughness (Ra) smaller-the-better criterion was used as the objective was to minimize it and S/N ratio was computed using Eq. (2).
The S/N ratio for larger-the better characteristic is expressed as:
= −10𝑙𝑜𝑔 [1 𝑟∑
1 𝑦𝑖2 𝑟
𝑖=1
] (4)
Similarly, the S/N ratio for smaller-the-better characteristic is given as:
= −10𝑙𝑜𝑔 [1 𝑟∑ 𝑦𝑖
2 𝑟
𝑖=1
] (5)
where yi is the mean of the measured values of the response variable of ith experiment and r is the number of experiments at a particular level of control factor in an orthogonal array. The negative sign ensures that the largest value gives an optimum value of the response variable.
Table 6: Showing orthogonal array and S/N ratio for MRR and Surface roughness RUN NO. Speed Feed DOC NR S/N ratio for
MRR
S/N ratio for RA
1 300 20 0.2 0.2 51.02 -2.21
2 300 30 0.4 0.4 60.58 -3.10
3 300 50 0.6 0.8 68.52 -3.57
4 300 40 0.8 1.2 69.08 -1.28
IJEDR1703189
International Journal of Engineering Development and Research (
www.ijedr.org
)
1291
6 400 30 0.2 1.2 54.56 5.19
7 400 40 0.8 0.2 69.08 -4.40
8 400 50 0.6 0.4 68.52 -4.02
9 500 20 0.6 1.2 60.56 4.88
10 500 30 0.8 0.8 66.61 0.44
11 500 40 0.2 0.4 57.04 -1.65
12 500 50 0.4 0.2 65.00 -6.64
13 600 20 0.8 0.4 63.06 -1.36
14 600 30 0.6 0.2 64.11 -1.13
15 600 40 0.4 1.2 63.06 2.61
16 600 50 0.2 0.8 58.98 -0.58
E .Multi objective optimization technique
As two response parameters are considered to be optimized simultaneously so we have adopted a multi objective optimization technique. In present experimental work we are taking grey and Taguchi for optimization of process parameters and then based on its grade it is finally optimized by Taguchi technique.
F. Grey relational technique
Grey relational technique is a method to convert two or more quality parameters in to single quality parameter so that multi objective can be converted in to a single objective quality parameter and optimization technique like Taguchi used for single objective optimization can be utilized. This is done by obtaining grey relational grade from grey relational analysis. It is characterized by less data and multifactor analysis, where these two characteristics can overcome the disadvantage of statistical regression analysis. Grey relational grade is used as a performance characteristic in this single objective optimization technique. This step by step procedure of grey relational analysis with result is shown below [15].
G. Methodology of Grey Relational Analysis
The procedure of GRA follows the steps described below. Normalization of S/N ratios:
The first step in Taguchi based grey relational analysis is normalization of the S/N ratio to prepare initial data for the analysis where the original sequence is transferred to a comparable sequence. Normalization of the S/N ratio transforms the data in the range between zero and unity which is also known as the grey relational generation .In this investigation larger the better criterion is used for MRR and “smaller the-better” criterion is used for normalization of surface roughness by using the equations which are mentioned in Eq. 1 and 2 respectively [1, 2].
Larger the better
𝑢𝑖(𝑝) =
𝑧𝑖(𝑝)−𝑚𝑖𝑛 𝑧𝑖(𝑝)
𝑚𝑎𝑥 𝑧𝑖(𝑝)−𝑚𝑖𝑛 𝑧𝑖(𝑝) (6) Smaller the better
𝑢𝑖(𝑝) =
𝑚𝑎𝑥 𝑧𝑖(𝑝)−𝑧𝑖(𝑝)
𝑚𝑎𝑥 𝑧𝑖(𝑝)−𝑚𝑖𝑛 𝑧𝑖(𝑝) (7) Where, ui(p) is the value obtained by grey relational generation, min zi(p) is the smallest value of S/N ratio, zi(p) for the pth response
and max zi(p) is the largest value of zi(p) for the pth response. The normalized data is given in Table(10) Determination of Deviation sequence
The deviation sequence ∆oi is the absolute difference between the reference sequence yo(p) and yi(p) the comparability sequence
after normalization [1]. It is determined using Eq. 3 as: Calculate ∆oi = |yo(p) – yi(p)| as shown in table
Determination of Grey Relational Coefficient
GRC for all the sequences expresses the relationship between the ideal (best) and actual normalized S/N ratio If the two sequences agree at all points, then their grey relational [1, 2].
Co-efficient is 1. The grey relational coefficient GRC can be expressed by Eq. 3.
𝑥𝑖(𝑝) =
∆min+𝛹∆𝑚𝑎𝑥
IJEDR1703189
International Journal of Engineering Development and Research (
www.ijedr.org
)
1292
Where, ∆oi = |yo(p) – yi(p)| = difference of absolute yo(p) and yi(p). 𝛹 is distinguishing coefficient whose value lies in the range of 0 to 1 i.e. 0< 𝛹<1 but it is generally taken as 0.5. In the present study, the value of 𝛹 is also taken as 0.5. ∆min is the smallest valueof ∆oi and ∆max is the largest value of ∆oi. The grey relational coefficient for each response variable is given in Table (10)Determination of Grey Relational Grade
The overall evaluation of the multiple performance characteristics is based on the Grey Relational Grade (GRG). The next step of grey relational analysis is the calculation of grey relational grade on which the overall evaluation of the multiple-performance characteristic is based and it is calculated using Eq. (4) given below [1, 2]:
δ𝑖= ∑n𝑝=1𝑤p𝑥𝑖(𝑝) (9)
Where, n is the number of response variables, wp is the weighing factor for each grey relational coefficient. The total sum of weighing factors for all the response variables should be unity. The weighing factor assigned to each response variable is determined using principal component analysis (PCA) as discussed in the next section.
Principal Component Analysis (PCA)
Principal component analysis (PCA) was first introduced by Karl Pearson in 1901 as an analogue of the principal axis theorem in mechanics. Principal Component Analysis (PCA) is a technique which uses mathematical principles to transform a number of possibly correlated variables into a smaller number of uncorrelated variables called principal components. The origins of PCA lie in multivariate data analysis. PCA is one of the most important results from applied linear algebra which reduces the original data set, which may have large number of variables in just a few variables (the principal components) [17,18].
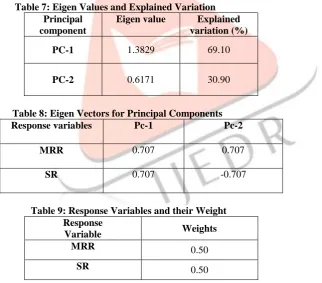
From Table 7, it can be seen that the variance contribution for the first principal component is as high as 69.10% and for the second principal component it is only 30.90%. Hence the squares of its corresponding eigenvectors are selected as the weighting values of the related performance characteristic and are shown in Table 9. The obtained weights are used in the calculation of grey relational grades given in Table 10.
Table 7: Eigen Values and Explained Variation Principal
component
Eigen value Explained variation (%)
PC-1 1.3829 69.10
PC-2 0.6171 30.90
Table 8: Eigen Vectors for Principal Components
Response variables Pc-1 Pc-2
MRR 0.707 0.707
SR 0.707 -0.707
Table 9: Response Variables and their Weight Response
Variable Weights
MRR 0.50
SR 0.50
Grey relational ordering
An order of 1 is allotted to greatest grey relational grade. Grey relational grades are calculated using Eq. (4) and grey relational order was figured out in table 10. From table 10, we come to know that the control parameter’s setting of 4(experiment 4) had the greatest grey relational grade and this indicates that experiment 4 was the optimal turning factors setting for surface roughness and MRR simultaneously among the chosen sixteen experiments. The larger better S/N quality characteristics was considered for grey relational grade, since higher multiple performance characteristics was our target [1, 2].
IJEDR1703189
International Journal of Engineering Development and Research (
www.ijedr.org
)
1293
Table 10: Showing all set of parameters calculated in multi objective grey relational Taguchi analysis Speed Feed DOC NR Ui(p)FOR MRR
Ui(p)
FOR RA
∆oi for
MRR ∆oi
for RA
GRC
𝐱𝐢(𝐩)
FOR MRR
GRC
𝐱𝐢(𝐩)
FOR RA
GRG RANK
300 20 0.2 0.2 0.00 0.55 1.00 0.45 0.33 0.53 0.43 14
300 30 0.4 0.4 0.48 0.62 0.52 0.38 0.49 0.57 0.53 9
300 50 0.6 0.8 0.78 0.65 0.22 0.35 0.69 0.59 0.64 5
300 40 0.8 1.2 1.00 0.48 0.00 0.52 1.00 0.49 0.75 1
400 20 0.4 0.8 0.30 0.74 0.70 0.26 0.42 0.66 0.54 8
400 30 0.2 1.2 0.18 0.00 0.82 1.00 0.38 0.33 0.36 16
400 40 0.8 0.2 0.90 0.71 0.10 0.29 0.84 0.64 0.74 2
400 50 0.6 0.4 0.88 0.69 0.13 0.31 0.80 0.61 0.71 4
500 20 0.6 1.2 0.48 0.02 0.52 0.98 0.49 0.34 0.41 15
500 30 0.8 0.8 0.78 0.35 0.22 0.65 0.69 0.44 0.57 6
500 40 0.2 0.4 0.30 0.51 0.70 0.49 0.42 0.50 0.46 12
500 50 0.4 0.2 0.70 0.88 0.30 0.12 0.62 0.81 0.72 3
600 20 0.8 0.4 0.60 0.49 0.40 0.51 0.56 0.49 0.52 10
600 30 0.6 0.2 0.65 0.47 0.35 0.53 0.59 0.49 0.55 7
600 40 0.4 1.2 0.60 0.19 0.40 0.81 0.56 0.38 0.47 11
600 50 0.2 0.8 0.40 0.43 0.60 0.57 0.45 0.47 0.44 13
IV. Results and discussions
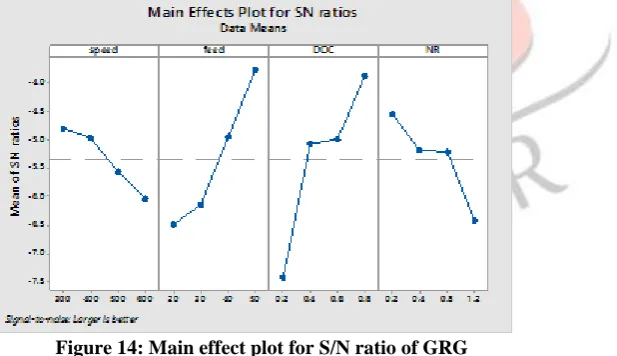
A. Taguchi Analysis: GRG versus Speed, Feed, DOC, NR
It is clear from figure that as spindle speed increases S/N ratio decreases. But in case of feed rate and DOC increase in the se parameters S/N ratio also increases it can also be seen that with the increase in nose radius S/N ratio decreases. It can be estimated from the figure that spindle speed at level 1, feed rate at level 4, DOC at level 4 and nose radius at level 1 means V1-F4-D4-N1 will provide the optimum combination of output parameters (MRR and surface roughness) simultaneously.
Figure 14: Main effect plot for S/N ratio of GRG
Based on the value of rank shown in Table 11, It can be concluded from the response table that control parameters affecting the response variables follows the order in descending order as given DOC > Feed rate > Nose radius > Speed
Table 11: Response Table for Signal to Noise Ratios (Larger the better)
Level Speed Feed DOC NR
1 0.5875 0.4775 0.4275 0.6075
2 0.5875 0.5000 0.5650 0.5575
3 0.5400 0.5775 0.5750 0.5525
4 0.5000 0.6600 0.6475 0.4975
Delta 0.0875 0.1825 0.2200 0.1100
Rank 4 2 1 3
B. Analysis of Variance for GRG
IJEDR1703189
International Journal of Engineering Development and Research (
www.ijedr.org
)
1294
Table 12: Analysis of Variance for GRGSource DF Adj SS Adj MS F-Value P-Value % contribution
Speed 3 0.021425 0.007142 6.26 0.083 9.21 Feed 3 0.082225 0.027408 24.01 0.013 35.35 DOC 3 0.101225 0.033742 29.55 0.010 43.52
NR 3 0.024275 0.008092 7.09 0.071 10.43
Error 3 0.003425 0.001142 Total 15 0.232575
C. Analysis of Mean
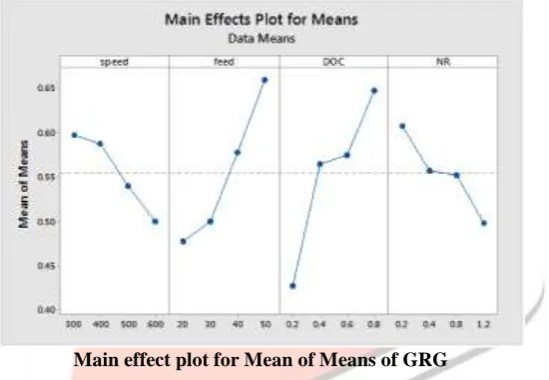
The optimal level of the process parameters was determined through the analysis of means (ANOM). As we are optimizing the process parameters under multi objective optimization therefore, the optimum values of input parameters can be seen from ANOM graph as shown below we have to take the higher values of input parameters unde r larger the better criteria adopted for optimization of GRG so optimum set of input parameters can be taken as 300 rpm speed, 50 mm/min feed, 0.8 mm depth of cut and 0.2 mm nose radius.
Main effect plot for Mean of Means of GRG
Based on the value of rank shown in Table below, It can be concluded from the response table that control parameters affecting the response variables follows the order in descending order as given DOC > Feed rate > Nose radius > Speed
Table 13: Response table for Means
Level Speed Feed DOC NR
1 0.5875 0.4775 0.4275 0.6075
2 0.5875 0.5000 0.5650 0.5575
3 0.5400 0.5775 0.5750 0.5525
4 0.5000 0.6600 0.6475 0.4975
Delta 0.0875 0.1825 0.2200 0.1100
Rank 4 2 1 3
D. Prediction of Taguchi result
The optimized Taguchi result (GRG) was predicted by the Minitab 17 software at the optimum set of input parameters which is illustrated in table below. It was observed that spindle speed of 300 rpm, feed rate of 50 mm/min, DOC of 0.8 mm and nose radius of 0.2 mm will provide optimum combination of MRR and surface roughness simultaneously.
Table 14: Factor level for prediction speed(rpm) Feed
rate(mm/min)
DOC (mm) Nose radius(mm)
S/N ratio GRG
300 50 0.8 0.2 -1.50149 0.84125
E. Regression Analysis
IJEDR1703189
International Journal of Engineering Development and Research (
www.ijedr.org
)
1295
the experimental values of grey relational grades at optimum input parameter settings, the regression analysis was done and the regression equations were obtained using the data given in Table 10 by using MINITAB 17 software.Regression Equation
GRG = 0.3690 − 0.000310speed + 0.00625 feed + 0.3350 DOC − 0.0953 NR F. Confirmatory test result
The final step is to confirm the validity of the optimization technique and verify the improvement of the performance characteristics with predicted optimum level setting. That means experimental value of GRG at spindle speed of 300 rpm, feed rate of 50 mm/min, DOC of 0.8 mm and nose radius 0f 0.2 mm was calculated using regression analysis and then compared with the predicted value of GRG suggested by Taguchi with the help of Minitab 17 software. We found the value of experimental GRG with the help of regression equation which is 0.83744 and predicted value of GRG to be 0.84125.
G. Comparison of result
Analyzing experiment result we found that experimental value of GRG obtained by regression analysis at optimum input parameter settings and the values predicted by Taguchi method are very close which revealed good relation between them and confirms that control parameters at V1-F4-D4-N1 will provide the optimum combination of response variables (MRR and surface roughness) simultaneously. The estimated or predicted GRG (£predicted) at the optimum level of the machining parameter can also be calculated by equation
£predicted = £m + ∑(£i − £m)
q
i=1
(10)
Where £m is the total mean of the grey relational grade £i is the mean of GRG at the optimum level of ith parameter, and q is the number of machining parameters that significantly affect GRG.
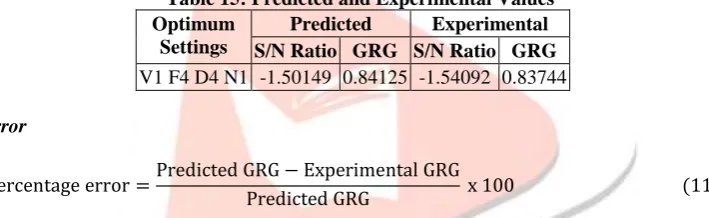
Table 15: Predicted and Experimental Values Optimum
Settings
Predicted Experimental S/N Ratio GRG S/N Ratio GRG V1 F4 D4 N1 -1.50149 0.84125 -1.54092 0.83744 H. Calculation of Error
Percentage error =Predicted GRG − Experimental GRG
Predicted GRG x 100 (11)
From the above formula it can be estimated that percentage error between experimental GRG and predicted GRG is 0.45% which is within the limits of acceptable level of 5% error. Therefore, it confirms that the results obtained by the above method are acceptable and well within the limits
I. Experimentation at the optimum Input parameters
After the confirmation of experimental and predicted values of GRG to be close enough to each other we can perform the experiment at the combination of input parameters suggested by the optimization results obtained by the Taguchi and grey relational analysis and these set of parameters can be used as optimum parameters to get the best possible combination of MRR and surface roughness at the same time. So we perform the experiment at 300 rpm speed, 50 mm/min feed rate, 0.8 mm depth of cut and 0.2 mm nose radius insert and calculated the value of MRR and surface roughness given below
Table 16: Shows value of Response variables at Input Parameters suggested by Taguchi Optimum input
parameters
MRR (mm3/min) Surface roughness (µm)
V1-F4-D4-N1 3558.71 1.24
V. Conclusion
A. Conclusions under Multi objective optimization
Multi-objective Optimization for High Speed Turning of Al 7075 using Grey Relational Analysis is discussed in this paper. Based on the analysis following conclusions can be made.
Grey Relational Analysis is very effective technique for optimization of machining processes which involves multiple responses.
It can be concluded from the response table that control parameters affecting the response variable (GRG) follows the order in descending order as given Depth of cut > Feed rate > Nose radius > Speed
The recommended cutting parameters for high speed turning of Al 7075 are 300 rpm Speed, 50 mm/min feed rate, 0.8 mm DOC and 0.2 mm NR, with coated carbide insert and under dry machining conditions.
IJEDR1703189
International Journal of Engineering Development and Research (
www.ijedr.org
)
1296
B. Scope for future workIn the present experimentation work machining of AL 7075 alloy was done under dry machining condition (without the use of lubricant) to obtain optimum set of control parameters (speed, feed rate, depth of cut and nose radius) for MRR and surface roughness under multi objective optimization.
It is suggested to conduct the same work under wet machining conditions (with the use of lubricant) to obtain optimum set of control parameters (speed, feed rate, depth of cut and nose radius) for MRR and surface roughness under multi objective optimization. The results obtained under dry machining and wet machining can be compared and can be utilized for machining of AL 7075 alloy in industrial application.
References
[1] S.J. Raykara, D.M. D'Addonab, A.M. Manea,“Multi-objective optimization of high speed turning of Al 7075 using grey relational analysis”,9th CIRP Conference on Intelligent Computation in Manufacturing Engineering, Procedia CIRP 33 ( 2015 ) 293 – 298
[2] P. Jayaramana, L. Mahesh kumar, “Multi-response Optimization of Machining Parameters of TurningAA6063 T6 Aluminium Alloy using Grey Relational Analysis in Taguchi Method”, 12th GLOBAL CONGRESS ON MANUFACTURING AND MANAGEMENT, GCMM 2014, Procedia Engineering 97 ( 2014 ) 197 – 204
[3] Rishu Gupta, Ashutosh Diwedi, “Optimization of Surface Finish and Material Removal Rate with Different Insert Nose Radius for Turning Operation on CNC Turning Center”, International Journal of Innovative Research in Science,Engineering and Technology, Vol. 3, Issue 6, June 2014
[4] Devendra Singh, Vimanyu Chadha and Ranganath M Singari, “effect of nose radius on surface roughness during cnc turning using response surface methodology”, International Journal of Recent advances in Mechanical Engineering (IJMECH) Vol.5, No.2, May 2016
[5] Srinivas Athreya1,Dr Y.D.Venkatesh, “Application Of Taguchi Method For Optimization Of Process Parameters In Improving The Surface Roughness Of Lathe Facing Operation”, International Refereed Journal of Engineering and Science (IRJES) ISSN (Online) 2319-183X, (Print) 2319-1821 Volume 1, Issue 3 (November 2012), PP.13-19
[6] Anoop C A, Pawan Kumar, “Application of Taguchi Methods and ANOVA in GTAW Process Parameters Optimization for Aluminium Alloy 7039”, International Journal of Engineering and Innovative Technology (IJEIT) Volume 2, Issue 11, May 2013
[7] Puneet Bansal, Lokesh Upadhyay, “Effect of Turning Parameters on Tool Wear, Surface Roughness and Metal Removal Rate of Alumina Reinforced Aluminum Composite”, 3rd International Conference on Innovations in Automation and Mechatronics Engineering, ICIAME 2016, Procedia Technology 23 ( 2016 ) 304 – 310
[8] Aswathy V, Rajeev, Vijayan, “Effect of machining parameters on surface roughness, material removal rate and roundness error during the wet turning of Ti-6Al-4V alloy”, Int. Journal of Applied Sciences and Engineering Research, Vol. 4, Issue 1, 2015 [9] Rusdi Nura, D.Kurniawan, M.Y.Noordinb, S.Izman, “Optimizing power consumption for sustainable dry turning of treated
aluminum alloy”, 2nd International Materials, Industrial, and Manufacturing Engineering Conference, MIMEC2015, 4-6 February 2015, Bali Indonesia, Procedia Manufacturing 2 ( 2015 ) 558 – 562
[10] Azizah Mohamad, Azlan Mohd. Zain, Nor Bahiah Hj. Ahmad, Noordin Mohd Yusof and Farhad Najarian, “ Roundness Error Study in Deep Hole Drilling of Cold Mold Steel 718”, Indian Journal of Science andTechnology,Vol10(13), April 2017 [11] Srinivas Athreya, Dr Y.D.Venkatesh, “ Application Of Taguchi Method For Optimization Of Process Parameters In Improving
The Surface Roughness Of Lathe Facing Operation”, International Refereed Journal of Engineering and Science (IRJES) ISSN (Online) 2319-183X, (Print) 2319-1821 Volume 1, Issue 3 (November 2012), PP.13-19
[12] Rajesh Kumar Bhushan & Sudhir Kumar & S. Das, “Effect of machining parameters on surface roughness and tool wear for
7075 Al alloy SiC composite”, Int J Adv Manuf Technol (2010) 50:459–469 DOI 10.1007/s00170-010-2529-2
[13] Ranganath M. S., Vipin, Nand Kumar and Rakesh Kumar, “Experimental Analysis of Surface Roughness in CNC Turning of Aluminium Using Response Surface Methodology”, International Journal of Advance Research and Innovation, vol. 3, Issue 1, pp. 45-49, 2015
[14] Ranganath M. S, Vipin, “Experimental Investigation and Parametric Analysis of Surface Roughness in CNC Turning Using Design of Experiments”, International Journal of Modern Engineering Research, Vol. 4, Issue 9, September 2014
[15] R. Venkata Rao & V. D. Kalyankar, “Optimization of modern machining processes using advanced optimization techniques:
a review”, Int J Adv Manuf Technol DOI 10.1007/s00170-014-5894-4
[16] Mário C. Santos Jr1 & Alisson R. Machado2,3 & Wisley F. Sales3 & Marcos A. S. Barrozo4 & Emmanuel O. Ezugwu5, “Machining of aluminum alloys: a review”, Int J Adv Manuf Technol DOI 10.1007/s00170-016-8431-9
[17] J. Deng, Introduction to Grey system. J. Grey Syst. 1, 1-24, 1989.
[18] K. Pearson, “On Lines and Planes of Closest Fit to Systems of Points in Space”, Philosophical Magazine, vol. 2. No. 11, pp. 559-572, 1901.
[19] H. C. Fung and P. C. Kang, “Multi-response optimization in friction properties of PBT composites using Taguchi method and principal component analysis”, Journal of Materials Processing Technology, vol. 170, no. 3, pp. 602-610, 2005.
[20] H. S. Lu, C. K. Chang, N. C. Hwanga and C. T. Chung, “Grey relational analysis coupled with principal component analysis for optimization design of the cutting parameters in high-speed end milling”, Journal of Materials Processing Technology, vol. 209, no. 8, pp. 3808-3817, 2009. http://dx.doi.org/10.1016/j.jmatprotec