http://www.sciencepublishinggroup.com/j/jps doi: 10.11648/j.jps.20190706.13
ISSN: 2331-0723 (Print); ISSN: 2331-0731 (Online)
Screening Rice (O. Sativa L.) in Salinity Gradient to Identify
Performance During Vegetative Stage for Salinity Stressed
Environments
Andrew Abiodun Efisue
*, Ella Elizabeth Igoma
Department of Crop & Soil Science, University of Port Harcourt, Port Harcourt, Nigeria
Email address:
*
Corresponding author
To cite this article:
Andrew Abiodun Efisue, Ella Elizabeth Igoma. Screening Rice (O. Sativa L.) in Salinity Gradient to Identify Performance During Vegetative Stage for Salinity Stressed Environments. Journal of Plant Sciences. Vol. 7, No. 6, 2019, pp. 144-150. doi: 10.11648/j.jps.20190706.13
Received: October 6, 2019; Accepted: October 28, 2019; Published: November 5, 2019
Abstract:
Salinity is one of the leading abiotic factors constraint rice production and efforts are being made by scientists to mitigate their effects on rice productivity. The objectives of this study are to identify salinity tolerant rice that is eco-salinity specific to ameliorate the salinity stress. The study comprises 16 advanced breeding lines and Pokkali a universal check was used in potted experiments. Four experiments were established concurrently in two replications in a randomized complete block design. The first experiment is none stressed ECO, the second (EC2) at 2.0 dSm-1,three (EC3) and four (EC4) at 3.0 dSm-1 and at 6.0 dSm-1, respectively. The genetic materials used in this study were replicated in all the experiments. Significant variations were observed among the genotypes based on their reaction to salinity stress at different salinity gradients. Genotype like IR84105-5-B-1-B-1 is constantly showing high tillering ability across salinity concentration gradients. The most stable genotypes were IR84931-9-B-2-B-3, and IR84931-9-B-1-B-3. The biplot indicates the possibility of two mega environments, which are (EC0 and EC3) and (EC2 and EC6), respectively for salinity stress. The results from this study has identified promising genotypes IR84105-5-B-1-B-1, and IR84105-5-B-1-B-5 for high tillering ability across the gradients, which is one of the major grain yield components and the most stable genotypes were IR84931-9-B-2-B-3 and IR84931-9-B-1-B-3 across the salinity gradients, which could be deployed to these regions.Keywords:
Oryza Sativa L. Genotype, Salinity Gradients, Stress Tolerance Index, GGE Biplot1. Introduction
Generally, it is accepted that rice has contributed largely in the feeding of the world population. Rice is a major staple food in the world mainly in Asia and some part of the developing countries like Africa. The acceptance of rice as staple food in the world might be attributed to its adaptability to different ecosystems of agriculture. Rice is adaptable to good irrigation systems, swampy lowland environments and rainfed upland ecology. In Sahel region of the tropics, rice depends mainly on irrigation for effective production, it is however constraints by salinity stress. Other salinity stressed environments are the coastal regions of the world caused by the water upsurge into hinterland of the coast. The coastal land has been stratified into different salinity gradient resulting from the quantity of oceanic water received.
Farmers in this region experience poor rice production constraint by salinity stress. Therefore, developing salinity tolerant rice that is eco-salinity specific will ameliorate the salinity stress, thus increase rice production and contributes to the livelihood of farmers in these regions.
breeding in selecting the right genotypes and techniques used in the selection need to be emphasized, which may enhance identification of salinity tolerant genotypes.
Most agronomic traits, specifically, grain yield, normally demonstrate GxE interaction and therefore call for genotype’s evaluation in multi-environment trials to select stable genotypes Haruna et al., [5]. The GGE biplot is very efficient in identifying the best performed genotype in an environment and the most suitable environment for each genotype Yan et. al., [6], by enabling the visual (graphical) presentation of interaction estimates. The GGE biplots have being used by scientists as an effective technique in selecting durable and stable crop species across different environments and at different stress levels Efisue and Derera, [7] and Yan et al., [8].
Fernandez, [9], showed that stress tolerance index (STI) could be used to identify genotypes performance under stress and non-stress conditions. Thus, STI is now being used as a tool for selection criteria to identify genotypes with stress tolerance potential Krishnamurthy et al., [10] and the high value of STI indicates the superiority of genotypes under stressed condition Krishnamurthy et al., [10]. Stress tolerance index (STI) have been used by scientists for the identification of salt tolerant genotypes in different ecologies and for different stress levels Singh et al., [11]. The objective of the study is to identify genotypes performance and stability across the salinity gradient for salinity stressed environments.
2. Materials and Methods
The study comprises 16 advanced breeding lines and Pokkali a universal check was used in potted experiments (Table 1). Four experiments were established concurrently in two replications in a randomized complete block design at the University of Port Harcourt, Faculty of Agriculture Teaching and Research Farm. The experimental site has an average temperature of 28 to 30°C and annual rainfall ranging from 2000 to 2680 mm. The first experiment is none stressed (control without salt treatment) coded as ECO, the second experiment was treated with NaCl2 salt (1.236g) / L
of distill water at 2.0 dSm-1 coded as EC2. Similarly, experiment three and four were treated with NaCl2 salt
(1.688g) / L of distill water at 3.0 dSm-1 coded as EC3 and NaCl2 salt (3.375g) / L of distill water at 6.0 dSm-1 coded as
EC6, respectively. The Electrical conductivity meter by HANNA instruments model HI 9835 was used to calibrate the salinity level of the salt solution.
The genetic materials used in this study (Table 1) were replicated in all the experiments. Planting was done by dibbling four seeds per pot and thinned to two seedlings 15 d after sowing. Irrigation was applied regularly to maintain the soil capacity. Inorganic fertilizer (NPK 15: 15: 15) was applied in a basal application of 200 kg ha-1 (N2, P2O5 and
K2O) and no fertilizer application till maximum tillering
stage of the plant.
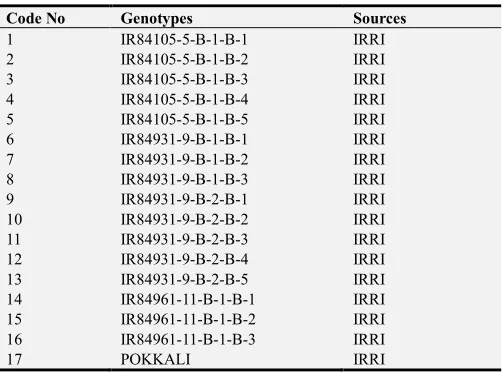
Table 1. Genetic Materials used and their Sources.
Code No Genotypes Sources
1 IR84105-5-B-1-B-1 IRRI
2 IR84105-5-B-1-B-2 IRRI
3 IR84105-5-B-1-B-3 IRRI
4 IR84105-5-B-1-B-4 IRRI
5 IR84105-5-B-1-B-5 IRRI
6 IR84931-9-B-1-B-1 IRRI
7 IR84931-9-B-1-B-2 IRRI
8 IR84931-9-B-1-B-3 IRRI
9 IR84931-9-B-2-B-1 IRRI
10 IR84931-9-B-2-B-2 IRRI
11 IR84931-9-B-2-B-3 IRRI
12 IR84931-9-B-2-B-4 IRRI
13 IR84931-9-B-2-B-5 IRRI
14 IR84961-11-B-1-B-1 IRRI
15 IR84961-11-B-1-B-2 IRRI
16 IR84961-11-B-1-B-3 IRRI
17 POKKALI IRRI
2.1. Data Collection
Data was collected at appropriate stage of the crop development. The agronomic characters were measured at weekly intervals. The ‘Standard Evaluation System (SES) for Rice’ reference manual IRRI, [12] was used for all trait measurements except where stated otherwise. Two young fully expanded leaves from the main stem were randomly selected in each pot and leaf area (LA) was determined using a leaf area meter (li-3100, Lincoln, NE USA). Leaf area index (LAI) was calculated as described by Yoshida [13] as follows: LAI = (sum of the leaf area of all leaves /unit area where the leaves have been collected). Plant height was measured in cm from the plant base to the tip of the highest leaf using meter rule and number of tillers taken at maximum tillering sate of the pant. Salinity scores were taken at 35d after seeding.
2.2. Data Analysis
All data were subjected to Analysis of variance (ANOVA) using PROC GLM of SAS (SAS Institute [14]. for mean separation. Modified salinity tolerance index Fernandez, [9] cited by (Singh et al., [11] was calculated as:
STI = Ys x Yp / Ȳp2
where STI = salinity tolerance index; Ys and Yp are the agronomic trait of the genotype under saline (stress) and non-saline (non-stress) conditions, respectively. While Ȳp = is the mean of the agronomic trait of all the genotypes evaluated under non-stress condition.
component matrices: singular value (SV) matrix, the cultivar eigenvector matrix, and the environment eigenvector matrix. Thus, the biplot was constructed based on the following model, as described by Yan [16].
Yij−G−Ej = ∑ λn εin ηin +εij
where Yij = the measured mean trait of cultivar i in environment j; G = the grand mean; Ej =the mean effect of environment j; (G+Ej) being the mean trait in environment j; λn = the SVD of nth principal component (PC), the square of which is the sum of square explained by PCn; εin =the eigenvector of cultivar i for PCn; ηjn = the eigenvector of environment j for PCn; andεij = the residual variation associated with genotype i in environment j.
3. Results
3.1. Agronomic Performance of Genotypes
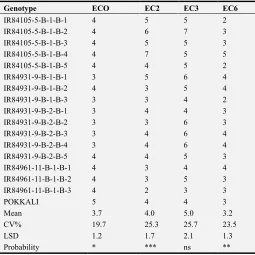
Significant variations were observed among the genotypes based on their reaction to salinity stress at different concentration levels except EC3 (3.0dSm-1). The mean salinity sore, high values were observed in EC2 and EC3, but higher significant variation at (P ≤ 0.001) was observed in EC2 among the genotypes (Table 2).
Table 2. Salinity scores of genotypes in the four experiments.
Genotype ECO EC2 EC3 EC6
IR84105-5-B-1-B-1 4 5 5 2
IR84105-5-B-1-B-2 4 6 7 3
IR84105-5-B-1-B-3 4 5 5 3
IR84105-5-B-1-B-4 4 7 5 5
IR84105-5-B-1-B-5 4 4 5 2
IR84931-9-B-1-B-1 3 5 6 4
IR84931-9-B-1-B-2 4 3 5 4
IR84931-9-B-1-B-3 3 3 4 2
IR84931-9-B-2-B-1 3 4 4 3
IR84931-9-B-2-B-2 3 3 6 3
IR84931-9-B-2-B-3 3 4 6 4
IR84931-9-B-2-B-4 3 4 6 4
IR84931-9-B-2-B-5 4 4 5 3
IR84961-11-B-1-B-1 4 3 4 4
IR84961-11-B-1-B-2 4 3 5 3
IR84961-11-B-1-B-3 4 2 3 3
POKKALI 5 4 4 3
Mean 3.7 4.0 5.0 3.2
CV% 19.7 25.3 25.7 23.5
LSD 1.2 1.7 2.1 1.3
Probability * *** ns **
*, **, and *** significant at 0.05, 0.01 and 0.001 probability level respectively, and ns = no significant observed
Tillering ability of genotypes is a measure of their promising ability for high yield. Significant variations were observed in genotypes across the salinity concentration levels, while more significant variation among the genotypes was noticed in EC2 level (Table 3). Some genotypes like 1-B-1, 1-B-5 and
IR84105-5-B-1-B-2 (code No.1, 5 and 2, respectively) are constantly showing high tillering ability across salinity concentration gradients. (Table 3).
Table 3. Tillering ability of genotypes in the four experiments.
Genotype EC0 EC2 EC3 EC6
IR84105-5-B-1-B-1 7 5 5 9
IR84105-5-B-1-B-2 6 8 5 7
IR84105-5-B-1-B-3 6 5 4 7
IR84105-5-B-1-B-4 4 6 7 7
IR84105-5-B-1-B-5 7 7 5 7
IR84931-9-B-1-B-1 5 6 4 6
IR84931-9-B-1-B-2 6 7 4 6
IR84931-9-B-1-B-3 5 5 5 6
IR84931-9-B-2-B-1 3 4 5 5
IR84931-9-B-2-B-2 6 6 7 5
IR84931-9-B-2-B-3 6 5 6 7
IR84931-9-B-2-B-4 5 6 6 4
IR84931-9-B-2-B-5 4 6 6 3
IR84961-11-B-1-B-1 5 5 5 5
IR84961-11-B-1-B-2 4 3 4 4
IR84961-11-B-1-B-3 3 3 3 4
POKKALI 4 2 4 3
Mean 5.1 5.3 5.2 5.7
CV% 28.2 27.6 24.7 34.2
LSD 2.4 2.4 2.1 3.2
Probability * ** * *
* and ** significant at 0.05 and 0.01 probability level respectively
The LAI showed significance difference (P≤0.05) among the tested genotypes in non-salinity stressed condition (ECO), however, no significance variation was observed in other salinity concentration levels (Table 4).
Table 4. Leaf area index (LAI) of genotypes in the four experiments.
Genotype EC0 EC2 EC3 EC6
IR84105-5-B-1-B-1 1.9 1.5 1.9 2.0
IR84105-5-B-1-B-2 1.6 1.5 1.4 1.3
IR84105-5-B-1-B-3 2.2 1.7 1.6 1.5
IR84105-5-B-1-B-4 1.8 1.5 1.8 1.6
IR84105-5-B-1-B-5 1.8 1.8 1.9 1.8
IR84931-9-B-1-B-1 1.3 1.6 1.7 1.5
IR84931-9-B-1-B-2 1.3 1.6 1.7 1.4
IR84931-9-B-1-B-3 1.5 1.2 1.8 1.2
IR84931-9-B-2-B-1 0.8 1.4 1.8 1.3
IR84931-9-B-2-B-2 1.5 1.2 2.1 2.0
IR84931-9-B-2-B-3 1.4 1.7 2.1 1.8
IR84931-9-B-2-B-4 1.5 1.7 2.4 1.4
IR84931-9-B-2-B-5 1.4 2.0 2.0 1.4
IR84961-11-B-1-B-1 1.3 1.3 1.4 1.4
IR84961-11-B-1-B-2 0.9 1.6 1.6 1.4
IR84961-11-B-1-B-3 1.3 1.5 1.6 1.4
POKKALI 1.4 1.4 1.3 1.0
Mean 1.47 1.55 1.78 1.50
CV% 27.05 21.88 22.49 25.55
LSD 0.66 0.56 0.66 0.64
Probability * ns ns ns
* = significant at 0.05 probability level and ns = no significant observed
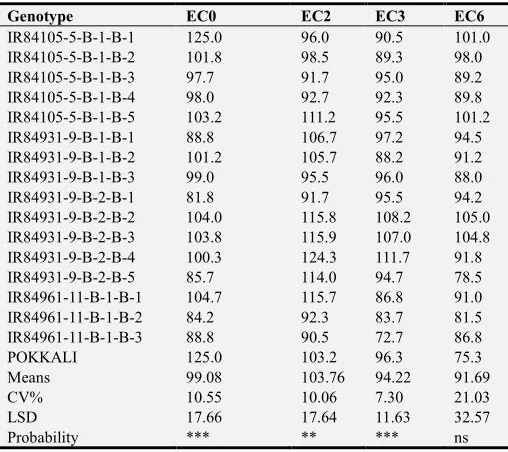
Five genotypes had mean plant height value higher than Pokkali (Check) across concentration levels, while IR84931-9-B-2-B-2 (code No. 10) is the tallest plant with mean plant value (108.3 cm) across concentration levels (Table 5).
Table 5. Plant height (cm) of genotypes in the four experiments.
Genotype EC0 EC2 EC3 EC6
IR84105-5-B-1-B-1 125.0 96.0 90.5 101.0
IR84105-5-B-1-B-2 101.8 98.5 89.3 98.0
IR84105-5-B-1-B-3 97.7 91.7 95.0 89.2
IR84105-5-B-1-B-4 98.0 92.7 92.3 89.8
IR84105-5-B-1-B-5 103.2 111.2 95.5 101.2
IR84931-9-B-1-B-1 88.8 106.7 97.2 94.5
IR84931-9-B-1-B-2 101.2 105.7 88.2 91.2
IR84931-9-B-1-B-3 99.0 95.5 96.0 88.0
IR84931-9-B-2-B-1 81.8 91.7 95.5 94.2
IR84931-9-B-2-B-2 104.0 115.8 108.2 105.0
IR84931-9-B-2-B-3 103.8 115.9 107.0 104.8
IR84931-9-B-2-B-4 100.3 124.3 111.7 91.8
IR84931-9-B-2-B-5 85.7 114.0 94.7 78.5
IR84961-11-B-1-B-1 104.7 115.7 86.8 91.0
IR84961-11-B-1-B-2 84.2 92.3 83.7 81.5
IR84961-11-B-1-B-3 88.8 90.5 72.7 86.8
POKKALI 125.0 103.2 96.3 75.3
Means 99.08 103.76 94.22 91.69
CV% 10.55 10.06 7.30 21.03
LSD 17.66 17.64 11.63 32.57
Probability *** ** *** ns
** and *** significant at 0.01 and 0.001 probability level respectively, and ns = no significant observed
3.2. Stress Tolerance Index of Genotypes
Salt tolerance index (STI) is one of the means of identifying the performance of genotype under salinity stressed with non-stressed conditions. The higher the STI value, the better the genotype performance under stressed condition. There is wide range of STI value for tillering ability among the genotypes, thus, indicating high variability among the tested genotypes. The Pokkali STI values across the concentration levels are lower than the grand mean of each concentration (Table 6). Seven genotypes had STI values higher than the gran mean (1.1) across the concentration levels, while IR84105-5-B-1-B-1 (1.8) and IR84105-5-B-1-B-5 (1.7) had the highest STI value for tillering ability across concentration levels (Table 6).
Table 6. Stress tolerance index for tillering ability.
Genotype ST1 (EC2) STI (EC3) STI (EC6)
IR84105-5-B-1-B-1 1.3 1.3 2.7
IR84105-5-B-1-B-2 1.8 1.2 1.7
IR84105-5-B-1-B-3 1.2 0.9 1.8
IR84105-5-B-1-B-4 0.9 1.1 1.2
IR84105-5-B-1-B-5 1.9 1.3 2.0
IR84931-9-B-1-B-1 1.2 0.8 1.2
IR84931-9-B-1-B-2 1.6 0.9 1.4
IR84931-9-B-1-B-3 1.0 1.0 1.1
IR84931-9-B-2-B-1 0.5 0.6 0.7
IR84931-9-B-2-B-2 1.4 1.6 1.3
IR84931-9-B-2-B-3 1.2 1.4 1.7
IR84931-9-B-2-B-4 1.2 1.2 0.9
IR84931-9-B-2-B-5 0.9 0.9 0.5
IR84961-11-B-1-B-1 1.0 1.0 0.9
Genotype ST1 (EC2) STI (EC3) STI (EC6)
IR84961-11-B-1-B-2 0.5 0.6 0.6
IR84961-11-B-1-B-3 0.3 0.3 0.6
POKKALI 0.3 0.6 0.5
Mean 1.1 1.0 1.2
STDEV 0.5 0.32 0.6
Similar trend was observed for STI for plant height (Table 7). as stated for tillering ability. However, Pokkali performed better based on plant height above the grand mean across concentration levels. It was observed that none of the genotypes performed better than Pokkali based on STI across concentration levels for plant height (Table 7).
Table 7. Stress tolerance index for Plant Height.
Genotype STI (EC2) STI (EC3) STI (EC6)
IR84105-5-B-1-B-1 1.2 1.2 1.3
IR84105-5-B-1-B-2 1.0 0.9 1.0
IR84105-5-B-1-B-3 0.9 0.9 0.9
IR84105-5-B-1-B-4 0.9 0.9 0.9
IR84105-5-B-1-B-5 1.2 1.0 1.1
IR84931-9-B-1-B-1 1.0 0.9 0.9
IR84931-9-B-1-B-2 1.1 0.9 0.9
IR84931-9-B-1-B-3 1.0 1.0 0.9
IR84931-9-B-2-B-1 0.8 0.8 0.8
IR84931-9-B-2-B-2 1.2 1.1 1.1
IR84931-9-B-2-B-3 1.2 1.1 1.1
IR84931-9-B-2-B-4 1.3 1.1 0.9
IR84931-9-B-2-B-5 1.0 0.8 0.7
IR84961-11-B-1-B-1 1.2 0.9 1.0
IR84961-11-B-1-B-2 0.8 0.7 0.7
IR84961-11-B-1-B-3 0.8 0.7 0.8
POKKALI 1.3 1.2 1.0
Means 1.05 0.96 0.93
STDEV 0.18 0.16 0.15
3.3. Stability Analysis of Genotypes Across Salinity Gradients
are (EC0 and EC3) and (EC2 and EC6), respectively for salinity stress (Figure 1)
Figure 1. Genotype stability across different salinity stress scores (for genotype codes refer to Table 1).
The first two principal components (PC1 and PC2) obtained by SVD of the centered data explained 82.9% of the total variation for salinity stress attributable to genotypes and genotype-by-environment interaction (Figure 2).
Similar trend was observed, all the salinity concentration levels (ECO, EC2, EC3 and EC6) had the same sign for the first principal component (PC1), thus indicating a good correlation between the genotype PC1 scores and genotype main effects (r = 0.75; P < 0.0001). Two salinity concentration levels (EC2 and EC3 had positive PC2 scores whereas EC0 and EC6 had negative PC2 scores (Figure 2). Stability of genotypes for tillering ability were ranked on the basis of their projection from the average tester coordinate (axis) on the average environment main effect. The greater the length of the projection of a genotype, the more unstable that genotype was (Figure 2). The most stable genotypes for tillering ability were genotypes (code 8, 11, 14, 15 and 17). The biplot indicates the possibility of two mega environments, which are (EC2 and EC3) and (EC0 and EC6), respectively for tillering ability (Figure 2).
Figure 2. Genotype stability across different salinity stresses for tillering ability (for genotype codes refer to Table 1).
4. Discussion
4.1. Agronomic Performance of Genotypes
The abiotic stress which includes salinity, drought, heat and cold, critically threatens crop production and causes significant yield loss in large agricultural areas Pareek et al, [17], Mantri et al, [18]. But soil salinity is one of the major environmental factors that hinders crop production and this effect could increase due to global climate changes and as a consequence of many human activities to the environment. The results from this study shows that environmental condition at EC6 (6.0 dSm-1) will be too high in salinity for effective rice production. There is high reduction in leaf area index (LAI) as well, reduction in plant height compared to other salinity concentration levels. Plant height is one of the indices for effective nutrient use efficiency and lodging behaviour of rice plant Efisue et al., [19]. Tillering ability is one of the yield components for rice grain yield Olubukola et. al., [20] and Peng et al., [21] at EC6 concentration levels, genotypes IR84105-5-B-1-B-1, IR84105-5-B-1-B-2 and IR84105-5-B-1-B-5 could be promising due to their performance for the aforementioned traits that could result to high grain yield. At EC3 (3.0 dSm-1), which is regarded as rice salinity threshold Mass and Hoffman, [22], genotypes IR84105-5-B-1-B-1and IR84931-9-B-2-B-2 were good for tillering ability and LAI and that may lead to high gran yield and they could be deployed into this salinity gradient environment for rice production. The results of this study also showed high genetic diversity among the genotypes as rice plant responded differently to salinity depending on type of genotypes and salinity concentration levels Ismail et al., [23] and Jampeetong and Brix, [24].
4.2. Stress Tolerance Index of Genotypes
Stress tolerance index have been used by many scientists for the identification of salt tolerant genotypes across different ecologies at different stressed levels Singh et. al., [11] and Krishnamurthy et al., [10]. Considerable variation of stress tolerance index was observed among the genotypes most especially for tillering ability and plant height. The higher the STI value, the better the genotype performance under salinity stressed condition, genotypes IR84105-5-B-1-B-1, IR84105-5-B-1-B-2 and IR84105-5-B-1-B-3 were the most promising for tillering ability and plant height across the salinity gradients. Similarly, Senguttuvel et al. [25] reported high variation of salt tolerance indices for agro-morphological traits in rice genotypes under saline condition. The use of physiological traits for screening for salt tolerance has being in use by scientists Rajanaidu et al., [26] and Yeo, [27], by selecting physiological traits that contribute to salinity tolerance as observed for tillering ability and plant height, these could be use in salinity breeding programme.
4.3. Stability Analysis of Genotypes
environments Krishnamurthy et al., [28]. Therefore, there is need to evaluate rice genotypes, especially for its interaction with the environments. Genotype x environment interaction (GxE) is the correlation between the environment and the phenotypic expression of a genotype Fan et al., [29]. Genotypes IR84931-9-B-2-B-5 (13), IR84931-9-B-1-B-3 (8) and IR84961-11-B-1-B-1 (14) where the most resistant to salinity while IR84931-9-B-1-B-3 (8) is resistant and most stable across the salinity gradients, they are promising genotypes that could be deployed to the salinity stressed environments. Genotypes IR84105-5-B-1-B-1 (1) and IR84931-9-B-2-B-3 (11), where stable but moderately susceptible to salinity stress, these could be used for salinity breeding programme
.
The two mega environments identified (ECO and EC3) and (EC2 and EC6) in Figure 2 may reduce the cost of salinity breeding as genotypes from each of the mega environment could be similar in reaction to salinity stress. The two mega environments (EC2 and EC3) and (ECO and EC6), that is, genotypes from (EC2 and EC3) my react similarly for tillering ability. Therefore, it may be cost effective for breeder who intend to increase tillering ability of new genotypes by conscious selection of genotypes form each of the environments.
5. Conclusion
Rice is becoming a major staple food for the developing countries in Sub-Sahara Africa. Sub-Sahara Africa has long straight of coastal land with varying salinity concentration levels and some other part of the world. This is therefore imperative to develop and identify resistant rice genotypes to mitigate the effects of salinity, thus enhancing rice production in this area. The results from this study has identified promising genotypes 1, IR84105-5-B-1-B-5 and IR8410IR84105-5-B-1-B-5-IR84105-5-B-1-B-5-B-1-B-2 for high tillering ability across the gradients, which is one of the major grain yield components and the most stable genotypes were IR84931-9-B-2-B-3, IR84931-9-B-1-B-3 and IR84105-5-B-1-B-1 across the salinity gradients, which could be deployed to these regions. Two mega environments were identified for salinity reactions and two for tillering ability, which could enhance rice improvement.
References
[1] Andrew Abiodun Efisue, Ella Elizabeth Igoma. 2019. Screening Oryza Sativa L. for Salinity Tolerance During Vegetative Stage for the Coastal Region of Niger-Delta Nigeria. Journal of Plant Sciences. Vol. 7, No. 1, 2019, pp. 21-26. doi: 10.11648/j.jps.20190701.14.
[2] Thi My Linh Hoang, Thach Ngoc Tran, Thuy Kieu Tien Nguyen, Brett Williams, Penelope Wurm, Sean Bellairs and Sagadevan Mundree 2016. Improvement of Salinity Stress Tolerance in Rice: Challenges and Opportunities Agronomy 2016, 6, 54; 1-23 doi: 10.3390/agronomy6040054.
[3] Miller, G. A. D.; Suzuki, N.; Ciftci-Yilmaz, S.; Mittler, R. O. N.
2010. Reactive oxygen species homeostasis and signalling during drought and salinity stresses. Plant Cell Environ. 33, 453-467. [4] Williams, B. and Dickman, M. Plant programmed cell death:
2008. Can’t live with it; can’t live without it. Mol. Plant Pathol. 9, 531-544.
[5] Haruna, A., Adu, G. B., Buah, S. S., Kanton, R. A., Kudzo, A. I., Seidu, A. M. and Kwadwo, O. A. (2017). Analysis of genotype by environment interaction for grain yield of intermediate maturing drought tolerant top-cross maize hybrids under rain-fed conditions. Cogent Food & Agriculture 3 (1), 1333243.
[6] Yan, W., Hunt, L. A., Sheng, Q. and Szlavnics, Z. 2000. Cultivar evaluation and mega-environment investigation based on the GGE biplot. Crop Science 40, 597-605.
[7] Efisue, Andrew A. and Derera, John 2012: Genotypic Response in Rice During the Vegetative Phase under Water Stress and Non-stress Conditions, Journal of Crop Improvement, 26: 6, 816-834.
[8] Yan, W., P. L. Cornelius, J. Crossa, and L. A. Hunt. 2001. Two types of GGE biplots for analyzing multi-environment trial data. Crop Sci. 41: 656-663.
[9] Fernandez G. C. J. 1992: Effective selection criteria for as-sessing plant stress tolerance. In: Proc. Int. Symp. Adaptation of Vegetables and other Food Crops in Temperature and Water Stress, Taiwan, August 13−16, 1992: 257−270.
[10] Krishnamurty S. L., Sarma S. K, Gautam R. K. and Kumar, V. 2014. Path and associated analysis and stress indeces for salinity tolerance traits in promising rice (O. sativa L.) genotypes. Cereal Res. Commun. 4: 474.
[11] Sanjay Singh, R. S. Sengar, Neeraj Kulshreshtha, D. Datta, R. S. Tomar, V. P. Rao, Deepa Garg & Ashish Ojha1 2015. Journal of Agricultural Science; Vol. 7, No. 3; 49-57.
[12] International Rice Research Institute IRRI. 1996. Standard evaluation system for rice. Los Baanos, Philippines:Yoshida, S. 1981. Fundamentals of rice crop science. The International Rice Research Institute (IRRI). Los Banos, Laguna, Philippines. pp 269.
[13] Yoshida, S. 1981. Fundamentals of rice crop science. TheInternational Rice Research Institute (IRRI). Los Banos, Laguna, Philippines. pp 269.
[14] SAS Institute Inc. 2003. SAS/STAT user’s guide, version 9.1. Cary, NC: SAS Institute Inc.
[15] Cornelius, P. L., J. Crosssa, and M. S. Seyedsadr. 1996. Statistical test and estimates of multivariate models for genotype-by-environment interaction. In Genotypeby-environment interaction, edited by M. S. Kang, and H. G. Gauch, 199-234. Boca Raton, FL: CRC Press.
[16] Yan, W. 2002. Singular-value portioning in biplot analysis of multi-environment trial data. Agron. J. 94: 990-996.
[17] Pareek A, Sopory S K, Bohnert H J, Govindjee. 2010. Abiotic Stress Adaptation in Plants: Physiological, Molecular and Genomic Foundation. Berlin: Springer.
[19] Andrew A. Efisue, Bianca C. Umunna, and Joseph A. Orluchukwu (2014). Effects of yield components on yield potential of some lowland rice (Oyza sativa L.) in coastal region of southern Nigeria. J. Plant Breed. Crop Sci. 6 (9): 119-127.
[20] Olubukola G. A., Chinyere C. N., Richard O. A. and Julius O. F., 2017. Screening for yield related characters in some landrace accessions of Oryza sativa linn. In Nigeria. Journal of Plant Sciences., 12: 52-58.
[21] Peng S, Khush GS, Cassman KG. 1994. Evolution of the new plant ideotype for increased yield potential, In: K. G. Cassman (Ed.), Breaking the Yield Barrier. IRRI, Los Banos, Philippines, pp. 5-20.
[22] Maas EV and Hoffman GJ (1997) Crop salt tolerance current assessment. J. Irrig. Drain. Div. Am. Soc. Civ.Eng. 103, 115-134.
[23] Ismail, A.; Heuer, S.; Thomson, M.; Wissuwa, M. Genetic and genomic approaches to develop rice germplasm for problem soils. Plant Mol. Biol. 2007, 65, 547-570.
[24] Jampeetong, A. and H. Brix, 2009. Effects of NaC salinity on growth, morphology, photosynthesis and proline accumulation of Salvinia natans. Aquat. Bot., 91: 181-186.
[25] Senguttuvel P., Sravan Raju N., Padmavathi G., Sundaram R. M., Madhav S., Hariprasad A. S., Kota S., Bhadana V. P, Subrahmanyam D., Subra Rao L. V., Brajendra, Ravindrababu V. 2016: Identification and quantification of salinity tolerance through salt stress indices and variability studies in rice (Oryza sativa L.). SABRAO Journal of Breeding and Genetics, 48: 172-179.
[26] Rajanaidu, N.; Zakri, A. H. Breeding for morpho-physiological traits in crop plants. In Plant Breeding and Genetic Engineering; Zakri, A. H., Ed.; SABRAO: Bangkok, Thailand, 1988; pp. 116-139.
[27] Yeo, A. R. Physiological criteria in screening and breeding. In Soil Mineral Stresses: Approaches to Crop Improvement; Yeo, A. R., Flowers, T. J., Eds.; Springer: Berlin, Germany, 1994; pp. 37-57.
[28] Krishnamurty S. L., Sarma P. C, Sarma S. K, Batra, V, Kumar, V. and Rao, L. V. S 2016. Effect of salinity and use of stress indices of morphological and physiological traits at the seedling stage in rice. Indian Journal of Experimental Biology. 54: 843-850.