R E S E A R C H A R T I C L E
Open Access
Growth and tolerance of formula with
lactoferrin in infants through one year of
age: double-blind, randomized, controlled
trial
William H. Johnston
1, Claude Ashley
2, Michael Yeiser
3, Cheryl L. Harris
4, Suzanne I. Stolz
4, Jennifer L. Wampler
4*,
Anja Wittke
5and Timothy R. Cooper
4Abstract
Background:Human milk provides necessary macronutrients (protein, carbohydrate, fat) required for infant nutrition. Lactoferrin (Lf), a multifunctional iron-binding protein predominant in human milk, shares similar protein sequence, structure, and bioactivity with bovine Lf (bLf). This large-scale pediatric nutrition study was designed to evaluate growth and tolerance in healthy infants who received study formulas with bLf at concentrations within the range of mature human milk.
Methods:In this multi-center, double-blind, parallel-designed, gender-stratified prospective study 480 infants were randomized to receive a marketed routine cow’s milk-based infant formula (Control;n= 155) or one of two investigational formulas with bLf at 0.6 g/L (LF-0.6;n= 165) or 1.0 g/L (LF-1.0;n= 160) from 14–365 days of age. Investigational formulas also had a prebiotic blend of polydextrose (PDX) and galactooligosaccharides (GOS) and adjusted arachidonic acid (ARA). The primary outcome was weight growth rate from 14–120 days of age. Anthropometric measurements were taken at 14, 30, 60, 90, 120, 180, 275, and 365 days of age. Parental recall of formula intake, tolerance, and stool characteristics was collected at each time point. Medically-confirmed adverse events were collected throughout the study period.
Results:There were no group differences in growth rate (g/day) from 14–120 days of age; 353 infants completed the study through 365 days of age (Control: 110; LF-0.6: 127; LF-1.0: 116). Few differences in growth, formula intake, and infant fussiness or gassiness were observed through 365 day of age. Group discontinuation rates and the overall group incidence of medically-confirmed adverse events were not significantly different. From 30 through 180 days of age, group differences in stool consistency (P< 0.005) were detected with softer stools for infants in the LF-0.6 and LF-1.0 groups versus Control.
Conclusion:Compared to the Control, infants who received investigational formulas with bLf and the prebiotic blend of PDX and GOS experienced a softer stooling pattern similar to that reported in breastfed infants. This study demonstrated routine infant formulas with bLf, a blend of PDX and GOS, and adjusted ARA were safe, well-tolerated, and associated with normal growth when fed to healthy term infants through 365 days of age.
Trial registration:ClinicalTrials.gov NCT01122654. Registered 10 May 2010.
* Correspondence:[email protected]
4
Clinical Research, Department of Medical Affairs, Mead Johnson Nutrition, Evansville, IN 47721, USA
Full list of author information is available at the end of the article
Background
Human milk provides the necessary protein, carbohydrate, and fat macronutrients required for infant nutritional needs. The protein component of cow’s milk-based infant formula is often patterned after mature human milk in which the ratio of whey and casein varies throughout lactation [1]. Lactoferrin (Lf ), a multifunctional iron-binding protein predominant in the whey fraction (range, mature human milk: 0.44-4.4 g/L [2]), is in-volved in cellular proliferation and differentiation, iron status maintenance, host defense against microbial in-fection, anti-inflammatory activity and immune modula-tory effects, and acts as a transcription factor (reviewed in [3]). Lf is synthesized by epithelial cells of the mammary glands and also present in other exocrine fluids [4]. Hu-man Lf and bovine Lf (bLf) proteins share ~70 % se-quence homology, are structurally similar, and in both in vitro and animal models have demonstrated comparable bioactivity (reviewed in [5]). Lf resists proteolysis in the in-fant gastrointestinal tract and uptake of both Lf and bLf has been demonstrated in vitro using an intestinal entero-cyte model (reviewed in [3]). Minor amounts of bLF (≈30–485 mg/L) are available in cow’s milk [6], and there-fore scarce in cow’s milk-based infant formula. A previous pilot study in healthy term infants demonstrated that addition of bLf (850 mg/L) to infant formula was well-tolerated, safe, and associated with a lower incidence of re-spiratory tract infections [7]. In children, dietary bLf low-ered parasite colonization (1 g/day) [8] and reduced frequency and duration of vomiting and diarrhea (100 mg/day) [9]. Growth, safety, and a decrease in invasive fungal infections have been demonstrated in preterm in-fants who received bLf (100 mg/day) [10].
Human milk oligosaccharides (HMOs) are carbohy-drates that comprise the third largest component in hu-man milk (mature milk range, 5–15 g/L) following lactose and fat [11]. Over one hundred distinct HMOs have been identified, with composition differing between women and stage of lactation, which serve as a growth substrate for beneficial bacteria, inhibit pathogen adher-ence due to anti-adhesive properties, and modulate immune and intestinal epithelial cell responses [11]. Pre-biotics, often used in infant formula to simulate the functionality of HMOs, are defined as“a selectively fer-mented ingredient that allows specific changes, both in the composition and/or activity in the gastrointestinal microbiota that confers benefits upon host well-being and health” [12]. Softer, looser stools are characteristic of both breastfed infants and infants who receive for-mula with (vs without) prebiotics [13–15]. In healthy term infants we previously demonstrated that cow’s milk-based infant formula with a prebiotic blend of polydextrose (PDX) and galactooligosacccharides (GOS) (1:1 ratio, 4 g/L) was well-tolerated, supported normal
growth, promoted a stool consistency closer to that of breastfed infants [16] and produced a bifidogenic effect [17] and softer stools [16–19] when compared to infants who received a formula without PDX and GOS. This blend of PDX (mixture of complex, slowly fermented polysaccharides) and GOS (mixture of rapidly fermented oligosaccharides) covers the molecular weight range of most HMOs and meets the definition of a prebiotic used by the European Society for Paediatric Gastroenterology Hepatology and Nutrition (ESPGHAN) and the Food and Agriculture Organization of the United Nations (FAO) [20, 21].
The present study was designed to evaluate growth and tolerance in healthy term infants receiving infant formulas with bLf at 0.6 and 1.0 g/L with weight growth rate from 14–120 days of age as the primary outcome. Concentrations used for bLf were within the reported range for Lf in mature human milk. In addition, investi-gational formulas included the prebiotic PDX and GOS blend (4 g/L) as well as an adjustment in arachidonic acid (ARA) based on updated worldwide means for hu-man milk docosahexaenoic acid (DHA) and ARA [22]. However, infant formulas may be provided up to 12 months of age even as complementary foods begin to be introduced. For this reason, we also assessed growth, tol-erance, and adverse events for participants from 14 to approximately 365 days of age to assess the use of study formulas throughout the first year of life.
Methods Study population
Healthy 12- to 16-day-old infants were recruited at 24 clinical sites in the United States. Eligible infants were singleton births at 37–42 weeks gestational age with birth weight≥2500 g and solely formula-fed at least 24 h prior to randomization. Exclusion criteria included history of underlying disease or congenital malformation likely to interfere with normal growth and development or participant evaluation; signs of acute infection includ-ing fever, diarrhea, or antibiotic use; feedinclud-ing difficulties or formula intolerance; weight at randomization <98 % of birth weight; large for gestational age born from a mother diabetic at childbirth; and immunodeficiency.
Study design
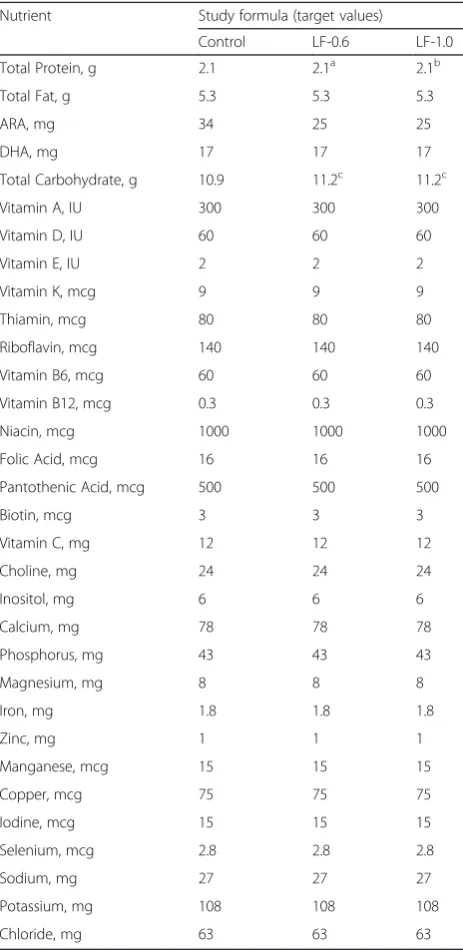
known only to the sponsor, were dispensed to parents at each study visit prior to study completion or withdrawal. Participants were randomly assigned to receive one of three study formulas (isocaloric, 20 calories/fluid oz): a routine cow’s milk-based infant formula (Control; mar-keted Enfamil®, Mead Johnson Nutrition, Evansville, IN) or one of two investigational formulas with bLf (DMV International bv) at 0.6 g/L (LF-0.6) or 1.0 g/L (LF-1.0) from 14 days of age up to 365 days of age (Table 1). All study formulas provided DHA at 17 mg/100 kcal. ARA
was provided at 34 mg/100 kcal in the Control and 25 mg/100 kcal in the investigational formulas. Each inves-tigational formula also had 4 g/L (1:1 ratio) of a blend of PDX (Litesse® Two Polydextrose; Danisco) and GOS (Vivinal® GOS Galactooligosaccharide; Friesland Foods Domo).
Ethics
Parents or guardians provided written informed consent prior to enrollment. The research protocol and informed consent forms observing the Declaration of Helsinki (in-cluding October 1996 amendment) were approved by the New England Institutional Review Board (IRB; New-ton, MA); the University of Nebraska Medical Center, IRB, Office of Regulatory Affairs (Omaha, NE); Western IRB (Olympia, WA); and the University of Louisville IRB (Louisville, KY). The study complied with good clinical practices.
Study objectives and outcomes
Anthropometric measures (body weight, length, and head circumference) were recorded at 14, 30, 60, 90, 120, 180, 275, and 365 days of age. At study enrollment, parents completed a baseline recall of tolerance (fussi-ness and gassi(fussi-ness), and stool characteristics (frequency and consistency) and provided information on partici-pant’s history of breastfeeding (0,≤7, or >7 days prior to study enrollment), family history of allergy in one or more relatives (including biological mother, father, sib-ling, and/or half-sibling) and exposure to smoking in the home. At all subsequent study visits, information on en-rollment in daycare, exposure to smoking in the home and/or daycare, and 24-h recall of formula intake (fluid oz/day), tolerance (fussiness and gassiness), and stool characteristics (frequency and consistency) was col-lected. Responses were scaled from 0–3 for amount of gas (none, slight amount, moderate amount, excessive amount); 0–4 for fussiness (not fussy, slightly fussy, moderately fussy, very fussy, extremely fussy); and 1–5 for stool consistency (hard, formed, soft, unformed or seedy, watery). The primary outcome was weight growth rate from 14–120 days of age. Secondary outcomes included anthropometrics, tolerance measures, and medically-confirmed adverse events through 365 days of age. Adverse events were coded according to specific event (e.g. otitis media, colic, etc.) and the body system involved including: Body as a Whole; Cardiovascular; Eye, Ears, Nose, and Throat; Endocrine; Gastrointestinal; Metabolic and Nutrition; Musculoskeletal; Nervous; Re-spiratory; Skin; and Urogenital. Participants received ex-clusive study formula feeding through 120 days of age. Participants who continued in the study through 365 days of age were considered to complete the study even if study formula consumption discontinued or decreased Table 1Nutrient composition per 100 kcal (20 Calories/fluid oz)
Nutrient Study formula (target values)
Control LF-0.6 LF-1.0
Total Protein, g 2.1 2.1a 2.1b
Total Fat, g 5.3 5.3 5.3
ARA, mg 34 25 25
DHA, mg 17 17 17
Total Carbohydrate, g 10.9 11.2c 11.2c
Vitamin A, IU 300 300 300
Vitamin D, IU 60 60 60
Vitamin E, IU 2 2 2
Vitamin K, mcg 9 9 9
Thiamin, mcg 80 80 80
Riboflavin, mcg 140 140 140
Vitamin B6, mcg 60 60 60
Vitamin B12, mcg 0.3 0.3 0.3
Niacin, mcg 1000 1000 1000
Folic Acid, mcg 16 16 16
Pantothenic Acid, mcg 500 500 500
Biotin, mcg 3 3 3
Vitamin C, mg 12 12 12
Choline, mg 24 24 24
Inositol, mg 6 6 6
Calcium, mg 78 78 78
Phosphorus, mg 43 43 43
Magnesium, mg 8 8 8
Iron, mg 1.8 1.8 1.8
Zinc, mg 1 1 1
Manganese, mcg 15 15 15
Copper, mcg 75 75 75
Iodine, mcg 15 15 15
Selenium, mcg 2.8 2.8 2.8
Sodium, mg 27 27 27
Potassium, mg 108 108 108
Chloride, mg 63 63 63
a
with bLF, 0.6 g/L b
with bLF, 1.0 g/L c
to fewer than 2 feedings/day after 275 days of age (ap-proximately 9-months-old).
Statistical methods
The sample size was chosen to detect a clinically rele-vant difference of 3 g/day in weight gain from 14–120 days of age (80 % power; one-tailed). Assuming a stand-ard deviation of 6 g/day for male and 5 g/day for female participants, approximately 78 males and 55 females were needed to enroll in each group with the expect-ation that 51 male and 36 female participants per study group would complete the study through 120 days of age. Analysis of variance (ANOVA) was used to assess growth rates in four pre-specified time intervals: from 14 to 30, 60, 90, or 120 days of age, calculated for each participant by linear regression of weight on age. Mean weight growth rates by gender for each investigational formula group were compared with the Control using one-tailed tests as outlined in guidance provided by the American Academy of Pediatrics (AAP) Task Force on Clinical Testing of Infant Formulas [23]. For all second-ary outcomes, overall comparisons for the three formula groups were two-tailed. Unadjusted pairwise compari-sons were performed if the overall test was statistically significant. All tests were conducted at α= 0.05. Achieved weight, length, and head circumference; length and head circumference growth rates; formula intake; and stool frequency were analyzed by ANOVA. Stool consistency, fussiness, and gas were analyzed using the
Cochran-Mantel-Haenszel (CMH) row mean score test. Incidence of adverse events as well as incidence of aller-gic manifestations, gastrointestinal infections, respiratory infections, or any infection-related adverse events were analyzed using Fisher’s exact test. All analyses were con-ducted using SAS version 9.2 (Cary, NC).
Results Participants
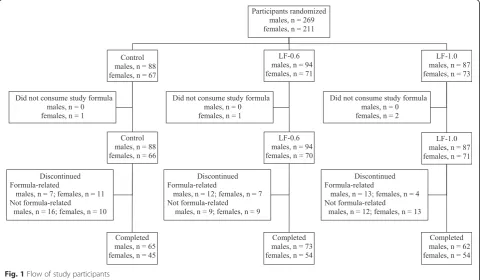
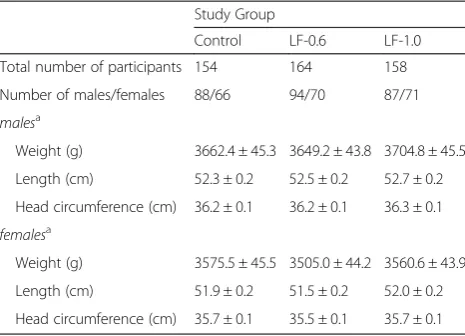
A total of 480 participants were enrolled and random-ized (Control: 155; LF-0.6: 165; LF-1.0: 160). Participants who were randomized but consumed no study formula (Control: 1; LF-0.6: 1; LF-1.0: 2) were not included in subsequent analyses (Fig. 1). No differences in body weight, length, or head circumference were observed by gender among groups at study enrollment (Table 2). Birth anthropometric measures as well as gender, race, and ethnic distribution, history of breastfeeding, family history of allergy, and exposure to smoking in the home were also similar among groups (data not shown). No group differences from 30 to 365 days of age in daycare enrollment and exposure to smoking in the home and/ or daycare were detected (data not shown). A total of 353 infants completed the study (Control: 110; LF-0.6: 127; LF-1.0: 116).
Growth
Growth rates were analyzed from 14–365 days of age. As outlined in guidance provided by the AAP Task
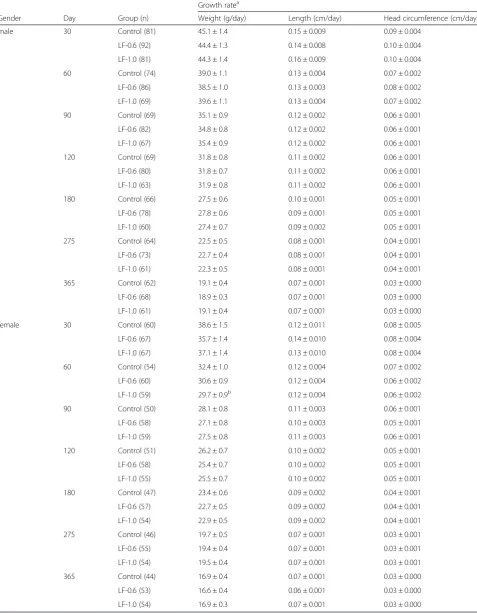
Force on Clinical Testing of Infant Formulas, rate of weight gain (g/day) is used as the most important param-eter in clinical evaluation of infant formulas with differ-ences of >3 g/day over a 3–4 month period considered clinically significant [23]. Consequently, no statistically significant group differences by gender in the primary out-come, weight growth rate from day 14–120, were detected (Table 3). No statistically significant differences were ob-served for weight, length, or head circumference growth rates by gender for any measured age range among study groups with the exception of lower weight growth rate for females in the LF-1.0 compared to the Control group from day 14–60 (29.7 ± 0.9 vs 32.4 ± 1.0 g/day; P< 0.05). This small difference within a single measured age range at less than 3 g/day was not considered clinically significant. In addition, no other statistically significant differences were observed for mean achieved weight, length, or head cir-cumference at any measured time point up to 365 days of age. Mean achieved weight for males (Fig. 2) and females (Fig. 3) plotted on the WHO weight-for-age standard growth chart [24, 25] fell approximately within the 25th and 75thpercentiles at all study time points.
Tolerance
Parent-reported mean study formula intake (fl oz/day; data not shown) increased from day 30–120 for all groups by gender, indicating normal intake for LF-0.6 and LF-1.0 groups when compared to the Control for this time period (examples: females at day 30, 25.9–26.9 fl oz/day and day 120, 33.3–34.2 fl oz/day; males at day 30, 28.2–30.0 fl oz/day and day 120, 35.0–35.7 fl oz/day). Intake for female participants by group was similar at all time points assessed. Statistically significant group differ-ences in intake were noted among males at days 180 (Control: 36.5 fl oz/day; LF-0.6: 31.9 fl /day; LF-1.0: 33.7 fl oz/day; Control vs LF-0.6, P< 0.05) and 275 only. However, by day 180, mean reported study formula
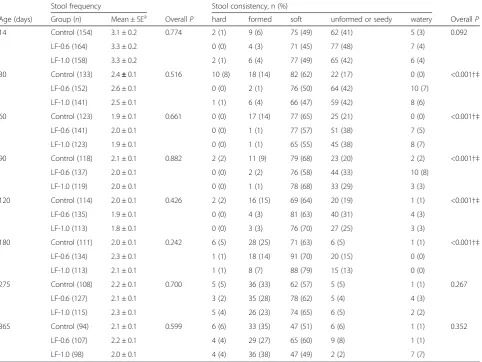
intake began to decline in general for both male and fe-male participants which could be expected as parents and caregivers likely begin to offer complementary foods to infants at approximately 4–6 months of age. Parent-reported gassiness and fussiness were similar among groups at all study time points (data not shown). Using 24-h recall, the amount of gas most commonly reported was “slight amount” or “moderate amount” up to 180 days of age and “none at all” or“slight amount” by 275 and 365 days of age. Fussiness was most often character-ized as “slightly fussy” or“not at all fussy”in all groups. No significant group differences in mean (±SE) stool fre-quency (number/day) were detected at any time point assessed (Table 4). No group differences in mean (±SE) stool consistency (with categories corresponding to 1 = hard, 2 = formed, 3 = soft, 4 = unformed or seedy, 5 = watery; Table 4) were detected at baseline. Significant differences in stool consistency were detected between Control and investigational formula groups from day 30 through 180. By category, the primary differences at these study time points were more infants with a formed and fewer infants with an unformed or seedy stool consistency in the Control compared to LF-0.6 and LF-1.0 groups. The majority of infants in all groups from day 30– 365 were reported to have a soft stool consistency. There were no significant differences among study formula groups by day 275, possibly reflecting the increased amount of complementary feeding in older children con-suming less formula.
In the overall study population (all participants up to 365 days of age) no statistically significant group differ-ences were detected for study formula discontinuation either related to study formula (Control: 18, 12 %; LF-0.6: 20, 12 %; LF-1.0: 17, 11 %) or not related to study formula (Control: 50, 32 %; LF-0.6: 42, 26 %; LF-1.0: 49, 31 %). Of the 55 participants with formula-related dis-continuation, formula intolerance as determined by the study investigator was the most common reason (Con-trol: 13; LF-0.6: 14; LF-1.0: 15) with fussiness (Con(Con-trol: 5; LF-0.6: 8; LF-1.0: 10) and gas (Control: 6; LF-0.6: 3; LF-1.0: 6) as the most common symptoms. Parental de-cision was the most common reason for discontinuation not related to study formula (Control: 13; 0.6: 7; LF-1.0: 19).
No group difference was detected in the number of participants for whom at least one medically-confirmed adverse event was reported (Control: 141, 92 %; LF-0.6: 154, 94 %; LF-1.0: 149; 94 %). There were no statistically significant group differences detected in the overall inci-dence of adverse events for the following systems: Body as a Whole; Cardiovascular; Eyes, Ear, Nose and Throat; Endocrine; Gastrointestinal (GI); Metabolic and Nutri-tion; Musculoskeletal; Nervous System; Respiratory; and Skin. Significantly fewer participants in the Control (6, 4 Table 2Infant characteristics at study entry
Study Group
Control LF-0.6 LF-1.0
Total number of participants 154 164 158
Number of males/females 88/66 94/70 87/71
malesa
Weight (g) 3662.4 ± 45.3 3649.2 ± 43.8 3704.8 ± 45.5
Length (cm) 52.3 ± 0.2 52.5 ± 0.2 52.7 ± 0.2
Head circumference (cm) 36.2 ± 0.1 36.2 ± 0.1 36.3 ± 0.1
femalesa
Weight (g) 3575.5 ± 45.5 3505.0 ± 44.2 3560.6 ± 43.9
Length (cm) 51.9 ± 0.2 51.5 ± 0.2 52.0 ± 0.2
Head circumference (cm) 35.7 ± 0.1 35.5 ± 0.1 35.7 ± 0.1
a
Table 3Weight, length, and head circumference growth rates from 14 days to 30, 60, 90, 120, 180, 275, and 365 days of age
Growth ratea
Gender Day Group (n) Weight (g/day) Length (cm/day) Head circumference (cm/day)
male 30 Control (81) 45.1 ± 1.4 0.15 ± 0.009 0.09 ± 0.004
LF-0.6 (92) 44.4 ± 1.3 0.14 ± 0.008 0.10 ± 0.004
LF-1.0 (81) 44.3 ± 1.4 0.16 ± 0.009 0.10 ± 0.004
60 Control (74) 39.0 ± 1.1 0.13 ± 0.004 0.07 ± 0.002
LF-0.6 (86) 38.5 ± 1.0 0.13 ± 0.003 0.08 ± 0.002
LF-1.0 (69) 39.6 ± 1.1 0.13 ± 0.004 0.07 ± 0.002
90 Control (69) 35.1 ± 0.9 0.12 ± 0.002 0.06 ± 0.001
LF-0.6 (82) 34.8 ± 0.8 0.12 ± 0.002 0.06 ± 0.001
LF-1.0 (67) 35.4 ± 0.9 0.12 ± 0.002 0.06 ± 0.001
120 Control (69) 31.8 ± 0.8 0.11 ± 0.002 0.06 ± 0.001
LF-0.6 (80) 31.8 ± 0.7 0.11 ± 0.002 0.06 ± 0.001
LF-1.0 (63) 31.9 ± 0.8 0.11 ± 0.002 0.06 ± 0.001
180 Control (66) 27.5 ± 0.6 0.10 ± 0.001 0.05 ± 0.001
LF-0.6 (78) 27.8 ± 0.6 0.09 ± 0.001 0.05 ± 0.001
LF-1.0 (60) 27.4 ± 0.7 0.09 ± 0.002 0.05 ± 0.001
275 Control (64) 22.5 ± 0.5 0.08 ± 0.001 0.04 ± 0.001
LF-0.6 (73) 22.7 ± 0.4 0.08 ± 0.001 0.04 ± 0.001
LF-1.0 (61) 22.3 ± 0.5 0.08 ± 0.001 0.04 ± 0.001
365 Control (62) 19.1 ± 0.4 0.07 ± 0.001 0.03 ± 0.000
LF-0.6 (68) 18.9 ± 0.3 0.07 ± 0.001 0.03 ± 0.000
LF-1.0 (61) 19.1 ± 0.4 0.07 ± 0.001 0.03 ± 0.000
female 30 Control (60) 38.6 ± 1.5 0.12 ± 0.011 0.08 ± 0.005
LF-0.6 (67) 35.7 ± 1.4 0.14 ± 0.010 0.08 ± 0.004
LF-1.0 (67) 37.1 ± 1.4 0.13 ± 0.010 0.08 ± 0.004
60 Control (54) 32.4 ± 1.0 0.12 ± 0.004 0.07 ± 0.002
LF-0.6 (60) 30.6 ± 0.9 0.12 ± 0.004 0.06 ± 0.002
LF-1.0 (59) 29.7 ± 0.9b 0.12 ± 0.004 0.06 ± 0.002
90 Control (50) 28.1 ± 0.8 0.11 ± 0.003 0.06 ± 0.001
LF-0.6 (58) 27.1 ± 0.8 0.10 ± 0.003 0.05 ± 0.001
LF-1.0 (59) 27.5 ± 0.8 0.11 ± 0.003 0.06 ± 0.001
120 Control (51) 26.2 ± 0.7 0.10 ± 0.002 0.05 ± 0.001
LF-0.6 (58) 25.4 ± 0.7 0.10 ± 0.002 0.05 ± 0.001
LF-1.0 (55) 25.5 ± 0.7 0.10 ± 0.002 0.05 ± 0.001
180 Control (47) 23.4 ± 0.6 0.09 ± 0.002 0.04 ± 0.001
LF-0.6 (57) 22.7 ± 0.5 0.09 ± 0.002 0.04 ± 0.001
LF-1.0 (54) 22.9 ± 0.5 0.09 ± 0.002 0.04 ± 0.001
275 Control (46) 19.7 ± 0.5 0.07 ± 0.001 0.03 ± 0.001
LF-0.6 (55) 19.4 ± 0.4 0.07 ± 0.001 0.03 ± 0.001
LF-1.0 (54) 19.5 ± 0.4 0.07 ± 0.001 0.03 ± 0.001
365 Control (44) 16.9 ± 0.4 0.07 ± 0.001 0.03 ± 0.000
LF-0.6 (53) 16.6 ± 0.4 0.06 ± 0.001 0.03 ± 0.000
LF-1.0 (54) 16.9 ± 0.3 0.07 ± 0.001 0.03 ± 0.000
a
Mean ± standard error (SE) b
Fig. 2Mean achieved weight for male participants with World Health Organization (WHO) reference percentiles (3rdto 97th) through 12 months (14 to 365 days) of age. Control, stars; LF-0.6, circles; LF-1.0, diamonds
%) and LF-0.6 (7, 4 %) groups versus the LF-1.0 group (17, 11 %; P< 0.05) experienced Urogenital system events. Although no significant group differences were detected for specific adverse events in this system, the incidence of penile adhesion (Control: 2, 2 %; LF-0.6: 3, 3 %; LF-1.0: 8, 9 %), commonly associated with circumci-sion in young male infants, appeared to drive the overall statistical difference. Within the GI System, the medically-confirmed incidence of diarrhea, constipation, emesis, or gas was low with no significant group differences; however gastroesophageal (GE) reflux (Control: 27, 18 %; LF-0.6: 24, 15 %; LF-1.0: 41, 26 %) was significantly lower in the LF-0.6 versus the LF-1.0 group (P< 0.05). Within the Ner-vous System the incidence of macrocephaly (defined as head circumference >98threference percentile; Control: 3, 2 %; LF-0.6: 0; LF-1.0: 0;P< 0.05) was low, albeit statisti-cally significant. No associated underlying health condi-tions were reported by study investigators for these participants and all completed the study. No group
differences were detected in the incidence of allergy- or infection-related adverse events; however, this study was not powered to detect likely subtle differences in this population of healthy term infants. A total of 41 partici-pants (Control: 14, 9 %; LF-0.6: 13, 8 %; LF-1.0: 14, 9 %) experienced serious adverse events (SAEs). With the ex-ception of one SAE in the Control group in which the par-ticipant was diagnosed with likely cow’s milk protein intolerance, all SAEs were deemed unrelated to study for-mulas as assessed by study physicians.
Discussion
Results of the current study demonstrate routine cow’s milk-based formulas with bLf at 0.6 or 1.0 g/L are asso-ciated with normal growth through 365 days of age. With one exception for female weight growth rate in the day 14–60 age range only, no statistically significant group differences were observed for weight, length, or head circumference growth rates from 14–365 days of Table 4Stool characteristics at 14, 30, 60, 90, 120, 180, 275, and 365 days of age
Stool frequency Stool consistency, n (%)
Age (days) Group (n) Mean ± SEa OverallP hard formed soft unformed or seedy watery OverallP
14 Control (154) 3.1 ± 0.2 0.774 2 (1) 9 (6) 75 (49) 62 (41) 5 (3) 0.092
LF-0.6 (164) 3.3 ± 0.2 0 (0) 4 (3) 71 (45) 77 (48) 7 (4)
LF-1.0 (158) 3.3 ± 0.2 2 (1) 6 (4) 77 (49) 65 (42) 6 (4)
30 Control (133) 2.4±0.1 0.516 10 (8) 18 (14) 82 (62) 22 (17) 0 (0) <0.001†‡
LF-0.6 (152) 2.6 ± 0.1 0 (0) 2 (1) 76 (50) 64 (42) 10 (7)
LF-1.0 (141) 2.5 ± 0.1 1 (1) 6 (4) 66 (47) 59 (42) 8 (6)
60 Control (123) 1.9 ± 0.1 0.661 0 (0) 17 (14) 77 (65) 25 (21) 0 (0) <0.001†‡
LF-0.6 (141) 2.0 ± 0.1 0 (0) 1 (1) 77 (57) 51 (38) 7 (5)
LF-1.0 (123) 1.9 ± 0.1 0 (0) 1 (1) 65 (55) 45 (38) 8 (7)
90 Control (118) 2.1 ± 0.1 0.882 2 (2) 11 (9) 79 (68) 23 (20) 2 (2) <0.001†‡
LF-0.6 (137) 2.0 ± 0.1 0 (0) 2 (2) 76 (58) 44 (33) 10 (8)
LF-1.0 (119) 2.0 ± 0.1 0 (0) 1 (1) 78 (68) 33 (29) 3 (3)
120 Control (114) 2.0 ± 0.1 0.426 2 (2) 16 (15) 69 (64) 20 (19) 1 (1) <0.001†‡
LF-0.6 (135) 1.9 ± 0.1 0 (0) 4 (3) 81 (63) 40 (31) 4 (3)
LF-1.0 (113) 1.8 ± 0.1 0 (0) 3 (3) 76 (70) 27 (25) 3 (3)
180 Control (111) 2.0 ± 0.1 0.242 6 (5) 28 (25) 71 (63) 6 (5) 1 (1) <0.001†‡
LF-0.6 (134) 2.3 ± 0.1 1 (1) 18 (14) 91 (70) 20 (15) 0 (0)
LF-1.0 (113) 2.1 ± 0.1 1 (1) 8 (7) 88 (79) 15 (13) 0 (0)
275 Control (108) 2.2 ± 0.1 0.700 5 (5) 36 (33) 62 (57) 5 (5) 1 (1) 0.267
LF-0.6 (127) 2.1 ± 0.1 3 (2) 35 (28) 78 (62) 5 (4) 4 (3)
LF-1.0 (115) 2.3 ± 0.1 5 (4) 26 (23) 74 (65) 6 (5) 2 (2)
365 Control (94) 2.1 ± 0.1 0.599 6 (6) 33 (35) 47 (51) 6 (6) 1 (1) 0.352
LF-0.6 (107) 2.2 ± 0.1 4 (4) 29 (27) 65 (60) 9 (8) 1 (1)
LF-1.0 (98) 2.0 ± 0.1 4 (4) 36 (38) 47 (49) 2 (2) 7 (7)
a
age. In addition, mean achieved weight for males and fe-males were within the 25th and 75th percentiles of the WHO weight-for-age growth chart from 14–365 days of age and no group differences for mean achieved weight, length, or head circumference were detected. Healthy growth and development have been previously demon-strated in infants receiving bLf [7, 26], however, this is the first large pediatric nutrition trial designed to evalu-ate growth in which participants received infant formula with concentrations of bLF that correspond to those re-ported for mature human milk in conjunction with a prebiotic blend of PDX and GOS.
In the current study, acceptance and tolerance of study formulas were good. No differences in overall study dis-continuation or study disdis-continuation due to study for-mula were detected. No significant group differences were detected in fussiness, gassiness, or mean stool fre-quency at any measured time point. The majority of in-fants in all groups from day 30–365 were reported to have a soft stool consistency. However, significant differ-ences in mean stool consistency were detected by day 30 and continued through day 180; more infants with a formed and fewer infants with an unformed or seedy stool consistency in the Control compared to the investi-gational formula groups were the primary differences. No group differences were observed by day 275, as noted previously, likely reflecting the increased amount of complementary feeding in older children consuming less formula. Collecting a more complete dietary recall after 120 days of age (vs formula intake only) could im-prove our understanding of the relationship of infant formula and use of complementary foods in feeding practices over the first year of life. Though a current study limitation, at least in evaluation of some secondary outcomes through 365 days of age, this represents a po-tential next step for future studies.
The primary long-chain polyunsaturated fatty acids found in human milk, DHA and ARA, are always present, albeit at various concentrations and ratios [22, 27, 28]. Previously published values for worldwide hu-man milk DHA and ARA [29, 30] provided the founda-tion for infant formulas with DHA and ARA (at ~0.3 % and ~0.6 % of total fat, respectively), associated with vis-ual and cognitive development in term infants [31–35] and enhanced growth and neural development in pre-term infants [36, 37]. Updated worldwide means for hu-man milk DHA at 0.32 % (SD 0.21 %; median 0.26 %; mode 0.20 %) and ARA at 0.47 % (SD 0.13 %; median 0.45 %; mode 0.50 %) of total fatty acids were published in the most recent comprehensive, critical review of lit-erature [22]. We previously evaluated routine, cow’s milk-based formulas with adjusted ARA and demon-strated they are well-tolerated, safe and promote normal growth from 14–120 days of age [18]. In the current
study, routine cow’s milk-based formulas with bLf and adjusted ARA were safe, well-tolerated, and associated with normal growth when fed to healthy term infants through 365 days of age.
The stool softening effect demonstrated with the PDX and GOS prebiotic blend may potentially help address occasional hard stools that could affect formula-fed in-fants [38]. In healthy, term inin-fants we previously re-ported that use of routine formulas with a prebiotic blend of PDX and GOS (4 g/L, 1:1 ratio) produced a bifidogenic effect closer to breast milk [17] and softer stools in healthy, term infants compared to formula without PDX and GOS [16–19]. Similarly, Lf may also effect change in the gastrointestinal microbiota. For ex-ample, the ratio of fecalBifidobacteriumto Enterobacte-riaceae and Clostridium increased in low-birth weight infants receiving infant formula with bLf (1 g/L) [39] and bLf promoted dose-dependent Bifidobacterium
growth in vitro [40]. A stronger bifidogenic effect has also been described for pepsin hydrolysates of bLf, sug-gesting the outcome of gastric digestion on Lf may ex-tend to that found in human milk as well as infant formula with bLf [41]. Based on modified stool consistency observed in this and previous studies, fur-ther exploration of potential synergistic effects of provid-ing infant formulas with bLf and the PDX and GOS blend on the infant fecal microbiota and other poten-tially associated health outcomes may be warranted.
Conclusions
Routine intact cow’s milk protein infant formulas with bLf at 0.6 and 1.0 g/L were associated with age-appropriate growth throughout the first year of life. This was the first large-scale pediatric nutrition trial in which formulas used concentrations of bLf that are within the range of Lf reported for mature human milk and in-cluded the prebiotic blend of PDX and GOS. Compared to infants who received the Control formula, infants who received investigational formulas with the prebiotic blend of PDX and GOS and bLf at 0.6 or 1.0 g/L experi-enced a softer stooling pattern similar to that reported in breastfed infants. Consequently, this study demon-strated that routine infant formulas with bLf, a blend of PDX and GOS, and adjusted ARA were safe, well-tolerated, and associated with normal growth when fed to healthy term infants throughout the first year of life.
Abbreviations
AAP:American Academy of Pediatrics; ANOVA: analysis of variance; ARA: arachidonic acid; bLf: bovine lactoferrin; DHA: docosahexaenoic acid; GOS: galactooligosacccharides; Lf: lactoferrin; PDX: polydextrose.
Competing interests
and AW works in Global Research and Development at Mead Johnson Nutrition.
Authors’contributions
WHJ, CA, and MY assessed study participants and collected study data. TC designed the study. CLH participated in study design and performed statistical analyses. SIS participated in study design and study management. JLW participated in study design and drafted the manuscript. AW participated in study design. All authors interpreted data, contributed to the intellectual content, reviewed and revised the manuscript, and approved the final version.
Acknowledgements
The authors wish to thank study site staff for their cooperation. The participation of parents and infants in this study is greatly acknowledged.
Author details
1Birmingham Pediatric Associates, 806 St Vincent’s Drive, Birmingham, AL
35205, USA.2Southeastern Pediatric Associates, 364 Honeysuckle Road, Dothan, AL 36305, USA.3Owensboro Pediatrics, 2200 E. Parrish Avenue,
Owensboro, KY 42303, USA.4Clinical Research, Department of Medical Affairs, Mead Johnson Nutrition, Evansville, IN 47721, USA.5Global Research and
Development, Mead Johnson Nutrition, Evansville, IN 47721, USA.
Received: 9 December 2014 Accepted: 16 October 2015
References
1. Lonnerdal B. Nutritional and physiologic significance of human milk proteins. Am J Clin Nutr. 2003;77(6):1537S–43S.
2. Rai D, Adelman AS, Zhuang W, Rai GP, Boettcher J, Lonnerdal B. Longitudinal changes in lactoferrin concentrations in human milk: a global systematic review. Crit Rev Food Sci Nutr. 2014;54(12):1539–47.
3. Lonnerdal B. Infant formula and infant nutrition: bioactive proteins of human milk and implications for composition of infant formulas. Am J Clin Nutr. 2014;99(3):712S–7S.
4. Lönnerdal B, Iyer S. Lactoferrin: Molecular structure and biological function. Ann Rev Nutr. 1995;15:93–110.
5. Ochoa TJ, Cleary TG. Effect of lactoferrin on enteric pathogens. Biochimie. 2009;91(1):30–4.
6. Cheng JB, Wang JQ, Bu DP, Liu GL, Zhang CG, Wei HY, et al. Factors affecting the lactoferrin concentration in bovine milk. J Dairy Sci. 2008;91(3):970–6.
7. King J, Cummings G, Guo N, Trivedi L, Readmond B, Keane V, et al. A double-blind, placebo-controlled, pilot study of bovine lactoferrin supplementation in bottle-fed infants. J Pediatr Gastroentrol Nutr. 2007;44:245–51.
8. Ochoa TJ, Chea-Woo E, Campos M, Pecho I, Prada A, McMahon RJ, et al. Impact of lactoferrin supplementation on growth and prevalence ofGiardia
colonization in children. Clin Infect Dis. 2008;46(12):1881–3. 9. Egashira M, Takayanagi T, Moriuchi M, Moriuchi H. Does daily intake of
bovine lactoferrin-containing products ameliorate rotaviral gastroenteritis? Acta Paediatr. 2007;96(8):1242–4.
10. Manzoni P, Stolfi I, Messner H, Cattani S, Laforgia N, Romeo MG, et al. Bovine lactoferrin prevents invasive fungal infections in very low birth weight infants: a randomized controlled trial. Pediatrics. 2012;129(1):116–23. 11. Bode L. Human milk oligosaccharides: Every baby needs a sugar mama.
Glycobiology. 2012;22(9):1147–62.
12. Roberfroid M. Prebiotics: the concept revisited. J Nutr. 2007;137(3 Suppl 2):830S–7S.
13. Boehm G, Lidestri M, Casetta P, Jelinek J, Negretti F, Stahl B, et al. Supplementation of a bovine milk formula with an oligosaccharide mixture increases counts of faecal bifidobacteria in preterm infants. Arch Dis Child Fetal Neonatal Ed. 2002;86(3):F178–181.
14. Fanaro S, Marten B, Bagna R, Vigi V, Fabris C, Pena-Quintana L, et al. Galacto-oligosaccharides are bifidogenic and safe at weaning: a double-blind randomized multicenter study. J Pediatr Gastroenterol Nutr. 2009;48(1):82–8.
15. Moro GE, Mosca F, Miniello V, Fanaro S, Jelinek J, Stahl B, et al. Effects of a new mixture of prebiotics on faecal flora and stools in term infants. Acta Paediatr Suppl. 2003;91(441):77–9.
16. Ziegler E, Vanderhoof JA, Petschow B, Mitmesser SH, Stolz SI, Harris CL, et al. Term infants fed formula supplemented with selected blends of prebiotics grow normally and have soft stools similar to those reported for breast-fed infants. J Pediatr Gastroenterol Nutr. 2007;44(3):359–64.
17. Scalabrin DM, Mitmesser SH, Welling GW, Harris CL, Marunycz JD, Walker DC, et al. New prebiotic blend of polydextrose and galacto-oligosaccharides has a bifidogenic effect in young infants. J Pediatr Gastroenterol Nutr. 2012;54(3):343–52.
18. Ashley C, Johnston WH, Harris CL, Stolz SI, Wampler JL, Berseth CL. Growth and tolerance of infants fed formula supplemented with polydextrose (PDX) and/or galactooligosaccharides (GOS): double-blind, randomized, controlled trial. Nutr J. 2012;11:38.
19. Nakamura N, Gaskins HR, Collier CT, Nava GM, Rai D, Petschow B, et al. Molecular ecological analysis of fecal bacterial populations from term infants fed formula supplemented with selected blends of prebiotics. Appl Environ Microbiol. 2009;75(4):1121–8.
20. Agostoni C, Axelsson I, Goulet O, Koletzko B, Michaelsen KF, Puntis JW, et al. Prebiotic oligosaccharides in dietetic products for infants: a commentary by the ESPGHAN Committee on Nutrition. J Pediatr Gastroenterol Nutr. 2004;39(5):465–73. 21. AGNS/FAO: FAO technical meeting on prebiotics.In Rome: 2007: Food
Quality and Standards Service, Nutrition and Consumer Protection Division, and Food and Agriculture Organization of the United Nations. http:// www.aat-taa.eu/index/en/company/download/1262610500.html 22. Brenna JT, Varamini B, Jensen RG, Diersen-Schade DA, Boettcher JA,
Arterburn LM. Docosahexaenoic and arachidonic acid concentrations in human breast milk worldwide. Am J Clin Nutr. 2007;85(6):1457–64. 23. AAP, Finberg L, Bell EF, Cooke RJ, Fomon SJ, Kleinman RE, Pencharz PB,
Reynolds JW, Schanler RJ, Forbes AL: Task Force on Clinical Testing of Infant Formulas, Committee on Nutrition, American Academy of Pediatrics: Clinical testing of infant formulas with respect to nutritional suitability for term infants. US Food and Drug Administration, Center for Food Safety and Applied Nutrition; 1988: http://www.fda.gov/Food/GuidanceRegulation/ GuidanceDocumentsRegulatoryInformation/InfantFormula/ucm170649.htm 24. Mihatsch WA, Hoegel J, Pohlandt F. Prebiotic oligosaccharides reduce stool viscosity and accelerate gastrointestinal transport in preterm infants. Acta Paediatr. 2006;95(7):843–8.
25. WHO: WHO Multicentre Growth Reference Study Group. WHO Child Growth Standards: Length/height-for-age, weight-for-age, weight-for-length, weight-for-height and body mass index-for-age: Methods and development. Geneva: World Health Organization; 2006. p. 312.
26. Hernell O, Lonnerdal B. Iron status of infants fed low-iron formula: no effect of added bovine lactoferrin or nucleotides. Am J Clin Nutr. 2002;76(4):858–64. 27. Jensen RG. Lipids in human milk. Lipids. 1999;34(12):1243–71.
28. Koletzko B. Global standard for the composition of infant formula: recommendations of an ESPGHAN coordinated international expert group. JPGN. 2005;41(5):584–99.
29. Innis SM. Human milk and formula fatty acids. J Pediatr. 1992;120(4 Pt 2):S56–61. 30. Koletzko B, Thiel I, Abiodun PO. The fatty acid composition of human milk
in Europe and Africa. J Pediatr. 1992;120(4 Pt 2):S62–70.
31. Birch EE, Hoffman DR, Uauy R, Birch DG, Prestidge C. Visual acuity and the essentiality of docosahexaenoic acid and arachidonic acid in the diet of term infants. Pediatr Res. 1998;44(2):201–9.
32. Birch EE, Garfield S, Hoffman DR, Uauy R, Birch DG. A randomized controlled trial of early dietary supply of long-chain polyunsaturated fatty acids and mental development in term infants. Dev Med Child Neurol. 2000;42(3):174–81. 33. Birch EE, Hoffman DR, Castañeda YS, Fawcett SL, Birch DG, Uauy RD. A
randomized controlled trial of long-chain polyunsaturated fatty acid supplementation of formula in term infants after weaning at 6 wk of age. Am J Clin Nutr. 2002;75(3):570–80.
34. Hoffman DR, Birch EE, Castañeda YS, Fawcett SL, Wheaton DH, Birch DG, et al. Visual function in breast-fed term infants weaned to formula with or without long-chain polyunsaturates at 4 to 6 months: A randomized clinical trial. J Pediatr. 2003;142(6):669–77.
35. Birch EE, Castaneda YS, Wheaton DH, Birch DG, Uauy RD, Hoffman DR. Visual maturation of term infants fed long-chain polyunsaturated fatty acid-supplemented or control formula for 12 mo. Am J Clin Nutr. 2005;81(4):871–9. 36. Innis SM, Adamkin DH, Hall RT, Kalhan SC, Lair C, Lim M, et al.
Docosahexaenoic acid and arachidonic acid enhance growth with no adverse effects in preterm infants fed formula. J Pediatr. 2002;140(5):547–54. 37. Clandinin MT, Van Aerde JE, Merkel KL, Harris CL, Springer MA, Hansen JW,
containing docosahexaenoic acid and arachidonic acid. J Pediatr. 2005;146(4):461–8.
38. Quinlan PT, Lockton S, Irwin J, Lucas AL. The relationship between stool hardness and stool composition in breast- and formula-fed infants. J Pediatr Gastroenterol Nutr. 1995;20(1):81–90.
39. Kawaguchi S, Hayashi T, Masano J, Okuyama K, Suzuki T, Kawase K. A study concerning the effect of lactoferrin-eriched infant formula on low birth weight infants. Perinat Med. 1989;19(4):557–62.
40. Petschow BW, Talbott RD, Batema RP. Ability of lactoferrin to promote the growth ofBifidobacterium spp.in vitro is independent of receptor binding capacity and iron saturation level. J Med Microbiol. 1999;48(6):541–9. 41. Oda H, Wakabayashi H, Yamauchi K, Sato T, Xiao JZ, Abe F, et al. Isolation of
a bifidogenic peptide from the pepsin hydrolysate of bovine lactoferrin. Appl Environ Microbiol. 2013;79(6):1843–9.
Submit your next manuscript to BioMed Central and take full advantage of:
• Convenient online submission
• Thorough peer review
• No space constraints or color figure charges
• Immediate publication on acceptance
• Inclusion in PubMed, CAS, Scopus and Google Scholar
• Research which is freely available for redistribution