A Decision Support Method for Evaluating
Database Designs
Erki Eessaar1 and Marek Soobik1
1 Department of Informatics, Tallinn University of Technology, Raja 15, 12618 Tallinn, Estonia
[email protected], [email protected]
Abstract. It is possible to produce different database designs based on the same set of requirements to a database. In this paper, we present a decision support method for comparing different database designs and for selecting one of them as the best design. Each data model is an abstract language that can be used to create many different databases. The proposed method is flexible in the sense that it can be used in case of different data models, criteria, and designs. The method is based on the Analytic Hierarchy Process and uses pairwise comparisons. We also present a case study about comparing four designs of SQL databases in case of PostgreSQL™ database management system. The results depend on the context where the designs will be used. Hence, we evaluate the designs in case of two different contexts – management of measurements data and an online transaction processing system. Keywords: database design, decision support, Analytic Hierarchy Process, object-relational database, SQL.
1.
Introduction
Database design process consists of conceptual design, logical design, and physical design according to a well-known methodology [25]. During conceptual database design, one has to capture an accurate representation of reality. During logical design, one has to describe the design of a database in terms of a data model (for instance, the underlying model of SQL database language) but without taking into account the database management system (DBMS), based on which the database will be implemented. During physical design, one has to design a database by taking into account the DBMS where the database will be implemented.
Date [8, p. 287] is in position that "Database design is still largely subjective in nature". Normalization theory [6] and the principle of orthogonal database design [10] are the main examples of the use of scientific principles in the context of relational database design.
design from a set of designs. The designs, which one can evaluate, are the results of logical or physical design. The method is a multi-criteria decision support method that helps database developers to make more informed decisions during database development and hence improve the quality of databases.
Simsion [22, p. 301] reports the results of a constrained exercise, according to which different data modelers produce "a wide range of different workable logical data models in response to a common 'conceptual' data model". Therefore, we need a method, based on which to compare the logical data models and select or reject them. Teorey, Yang, and Fry [25] suggest a relation refinement step before physical design, the goal of which is to find more efficient and adaptable database schemas without the loss of data integrity. The result of this step would be a set of alternative logical structures that should be considered during the physical design. We need a method that would help us to select the best design from this set during physical design.
In addition, this kind of method is necessary because new data models (in the sense of abstract language) provide more and more features. For instance, Soutou [23] writes that if one uses the underlying data model of the SQL-92 standard, then it is possible to use two different designs to represent one-to-many relationships. On the other hand, if one uses the underlying object-relational data model of the SQL:1999 standard, then it is possible to use twelve different designs to represent one to many relationships [23]. It complicates the work of database designers because the number of alternative designs increases and designers have to select the best design from this set. Feuerlicht, Pokorný, and Richta [12] discuss the use of object-relational features that are specified in the SQL:2003 standard. They conclude that "numerous design options exist that need to be evaluated in the context of specific application requirements" [12, p. 986]. They also note that there is a lack of database design methodologies that help designers to make informed decisions about design choices.
In our previous work [11], we proposed a set of criteria that one could use to evaluate database designs and evaluated two SQL database designs (the regular design and the universal design) in terms of different criteria. In this paper, we extend the work by proposing a generalized evaluation method and present the results of an evaluation of four different SQL database designs.
2.
Related Works
The idea of using decision support methods during database design is not new. March [16] explains the techniques of mathematical clustering, iterative grouping refinement, mathematical programming, and hierarchic aggregation, which can be used to determine efficient physical organization of data for a database. The method is usable in case of hierarchical or network data models. On the other hand, in this paper, we propose a method, which can be used in case of any data model and can be used to select the best physical as well as logical organization of data in a database.
There exist selection methods for specific types of database objects. For instance, Theodoratos and Bouzeghoub [26] propose a general algorithm for selecting a set of materialized views (snapshots) for a data warehouse so that the selected set satisfies all the given constraints and minimizes the operational cost. They use "AND/OR dag representation for multiple queries and views". [26, p. 7] On the other hand, our proposed method is not limited with a specific type of database objects (like materialized views) or specific type of databases (like data warehouses).
Svahnberg et al. [24] describe a decision support method that is based on the Analytic Hierarchy Process (AHP) [21] and can be used to compare software architecture candidates. In this paper, we apply an AHP-based method to compare database designs. Svahnberg et al. [24] use only subjective judgments of a set of professional software developers to compare alternatives in terms of criteria. On the other hand, our method proposes the use of measurements to compare alternatives in terms of criteria. The goal is to increase the objectivity of evaluation results. Park and Lim [18] present an AHP-based method for comparing user interface designs. It is similar to our method because they use the results of usability measurements to compare designs pairwise in terms of usability criteria.
Vaidya and Kumar [29] describe application of AHP in the field of selection, evaluation, benefit cost analysis, allocation, planning and development, priority and ranking, decision making, and forecasting. Some applications (like software selection or evaluation of quality of software systems) are from the field of software engineering. None of the applications is used in the context of database design. However, the research of Vaidya and Kumar [29] demonstrates that AHP is suitable and widely used decision support method that could be used to evaluate database designs as well.
used in case of logical design as well as physical design and permits the use of wider range of criteria.
3.
An Evaluation Method of Database Designs
3.1. The Analytic Hierarchy Process
The Analytic Hierarchy Process (AHP) [21] allows us to make decisions by modeling a complex problem as a hierarchical structure. The levels of this model are from top to bottom goal, objectives, and alternatives. The goal is the overall objective. Objectives correspond to criteria that one has to take into account by comparing alternatives. There can be multiple levels of criteria. Alternatives are objects, between which the choice will be made. The process consists of comparing objectives pairwise to find the relative importance of the criteria in terms of the goal. In addition, one has to compare alternatives pairwise in terms of each criterion. For the pairwise comparisons one has to use a nine-point scale [21]. Comparison of elements i and j
answers a question, which of them is more important and how much more important it is [24]. The results are combined to calculate the final score of each alternative. The alternative with the highest final score is the best in terms of the goal. For instance, the goal might be to select the most suitable software architecture for a particular context [24].
3.2. Description of the Method
In this paper, we propose an AHP-based method for evaluating database designs. It consists of the following consecutive steps.
1. Description of the goal of the evaluation.
2. Description of the context where the designs will be used.
3. Selection of alternatives (database designs or pairs of database designs and platforms). A platform is a version of a DBMS that is used to implement a database.
4. Selection of criteria, based on which the alternatives will be evaluated. 5. Selection of software measures, based on which the measurements will be
6. Specification of tasks in a database, based on which the measurements will be made. In this context each task is a problem that has to be solved in a test database to measure the alternatives. Tasks may have subtasks. Tasks have different solutions in case of different alternatives. Let e be an evaluation and A is the set of alternatives that are evaluated during e. All the measurements for evaluating alternatives in A in terms of a criterion c
must be based on the same task. Otherwise the measurement results are not comparable. In addition, all the measurements for evaluating alternatives in A in terms of a criterion c must use the same protocol to perform measurements. For instance, if we count the number of physical lines of code in case of a criterion c, then we must use the same rules to format the code in case of all the alternatives in A.
7. If there are one or more tasks that are specified as the result of the previous step, then it is necessary to implement the designs in a test database (or in more than one test database if the alternatives are pairs of designs and platforms) and generate test data. If possible, one should use a public and well-known specification that contains requirements to the test data as a basis of implementing the test database. If the specification is public, then it is easier to repeat the experiments. If the specification is well-known, then it has probably been carefully evaluated.
8. Performing the tasks and measuring the results based on the test database (or databases).
9. Pairwise comparison of the criteria and calculation of the relative importance of the criteria. This step is still subjective in nature but explicitly defined context should simplify it. If a criterion c at the level N has one or more sub-criteria c1',...,cn' at the level N+1, then it is also necessary to calculate the relative importance of the sub-criteria in terms of c.
10.Pairwise comparison of the alternatives based on each criterion that is on the lowest level of the hierarchy of criteria.
11.Calculation of the final scores of the alternatives in terms of the goal by using AHP.
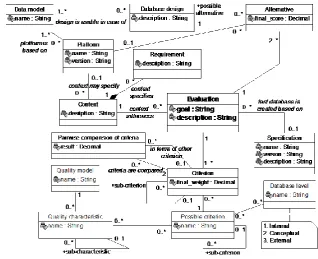
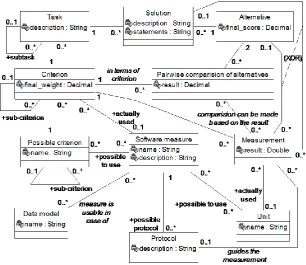
Fig. 1 and Fig. 2 present a metamodel of the method. We use UML class diagrams to present the metamodel. The method does not produce absolute judgments of the alternatives. Instead, it produces judgments that depend on a particular context, criteria, measures, tasks, solutions, and alternatives.
Fig. 1. A fragment of a metamodel of an evaluation method of database designs
Each database design is usable in case of one or more data models and platforms (versions of a DBMS). An example of data model is the underlying object-relational data model of the SQL:2003 standard [17]. We denote it as the ORSQL data model. Each platform has one or more associated data models, based on which the database languages of the platform have been created.
Fig. 2. A fragment of a metamodel of an evaluation method of database designs
Each evaluation has one or more associated criteria and at least two associated alternatives. The number of alternatives is limited by the amount of time and effort that is needed to develop them. According to Forman and Selly [13, p. 38], "humans are not capable of dealing accurately with more than about seven to nine things at a time" and therefore the number of alternatives and the number of highest-level criteria should not be bigger than nine. Criteria form a hierarchical structure. For instance, criterion "Performance of data manipulation operations" can have a sub-criterion "Performance of data manipulation operations that search data about one entity". The number of immediate sub-criteria of a criterion should also not be bigger than nine. Sets of alternatives, criteria, and measures that are actually used during an evaluation are subsets of possible alternatives (database designs or pairs of database designs and platforms), criteria, and measures.
of evaluation. It is possible that all the designs, which are considered during an evaluation, will be implemented by using the same platform. In this case, the information about the platform is a part of the context. It is also possible that the alternatives are pairs of platforms and database designs.
Some measurements do not require the creation of a test database. For instance, one can calculate the schema size of a SQL database without actually implementing the schema in a database.
Behkamal, Kahani, and Akbari [2] propose to find criteria for evaluating software systems based on quality models, like the one defined in the ISO 9126 standard. It is also possible in case of the proposed method. For instance, criteria "Access control", "Integrity constraints", and "Performance of data manipulation operations" correspond to the ISO 9126 quality model sub-characteristics "Security", "Changeability", and "Timebased efficiency", respectively. In addition, we suggest the use of database levels as a basis to systematically search and select the criteria. Each criterion corresponds to zero or more database levels, which are defined by the ANSI/SPARC architecture of DBMSs. For instance, criterion "Performance of data manipulation operations" corresponds to the internal level because it depends on the stored record types and their physical sequence, indexes etc. All these elements are described by the internal schema of a database.
During each evaluation one has to compare criteria pairwise to find their relative importance (weights) in terms of the goal. The requirements, which are associated with the context of an evaluation, determine the relative importance of the criteria in case of the evaluation. In addition, one has to perform measurements to find values of software measures in case of different alternatives. Each software measure is usable in case of zero or more data models. For instance, Piattini et al. [19] present a set of measures that are usable in case of the ORSQL data model. Let us assume that a software measure m is associated with a criterion c. The results of the measurements based on m will be used during the pairwise comparison of alternatives in terms of c. If a possible criterion has more than one associated software measure, then evaluator uses one the measures for the evaluation.
4.
Application of the Evaluation Method
In this paper, we demonstrate the use of the method by comparing four database designs, the underlying data model of which is the ORSQL data model. We implement all the designs based on open source PostgreSQL™ 8.3.6 DBMS [20]. The goal of the evaluation is to find the best design in case of two different contexts.
and Stock. The semantics of data does not affect the measurements that we plan to use during this evaluation.
4.1. Contexts
The relative importance of criteria depends on the context in which the database will be used. In this study, we evaluate designs in terms of two
hypothetical contexts.
Context 1. It describes a system that deals with the management of measurement data. The system has a small number of users – up to two users register data and up to five users perform complex statistical queries. Publication of its data may cause material or moral harm. The system must answer queries within minutes. However, if the system does not answer queries, then it does not cause remarkable consequences. All the unauthorized modifications of data must be detectable. In the future there may be additional types of measurements, the resulting data of which the system has to manage. The system must prohibit registration of seemingly incorrect data and therefore it must be as easy as possible to enforce integrity constraints at the database level.
Context 2. It describes a customer management system of a big retail company, which is an example of an online transaction processing system. The system has thousands of users. Most of the queries, which are executed in the database, help users to find information about a particular customer. Performance of data modification operations is less important. Publication of the data in the database disrupts functioning of the company or violates the privacy of people. The system must answer queries within seconds. If it does not answer queries, then it causes disruption of the functioning of the company. It must be possible to identify the source of all the data in the database. The requirements to the database are fixed for the next three years. There are relatively few business rules, based on which one has to create integrity constraints in the database.
4.2. Alternatives
Next, we explain the four database designs, which are the alternatives in our evaluation.
The regular design. According to this design one has to create a separate base table (table in short) based on each entity type (Customer, Order,
Fig. 3. An example of the use of the regular design (adapted from [28])
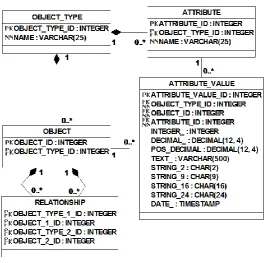
The universal design. This is a highly generic database design, according to which all the data in a database is represented in terms of Object_types,
Objects, Attributes, Attribute_values, and Relationships. For instance, Hay [14] and Blaha [3] refer to this kind of design as "Universal Data Model" and "Softcoded Values", respectively. Data about Object_types and Attributes
defines legal Attribute_values that can be associated with Objects. Table
Fig. 4. The universal design
The entity-attribute-value with classes and relationships (EAV/CR) design. It is a variation of the universal design. Each supported data type should have exactly one corresponding table for recording attribute values with this type according to the EAV/CR design [5]. This is different from the universal design where is one generic table Attribute_value that has a column for each supported data type. Fig. 5 describes some tables that are created according to the EAV/CR design. We do not present all the tables that we have created based on different data types on Fig. 5. We consider the EAV/CR design because it gives an impression of great flexibility and is a widely used variation of the universal design.
Fig. 5. The EAV/CR design
Date, Darwen, and Lorentzos [9] propose to use a similar design to record temporal data. The design also allows us to prevent the use of NULLs to present missing information [8]. If an attribute does not have a value, then there is no corresponding row in the table that is created according to the attribute. Fig. 6 describes some tables that are created according to the 6NF design.
4.3. Criteria
We wanted to evaluate the designs from different perspectives and to use measurements for that purpose. Therefore, we selected the criteria in a way that each level of the ANSI/SPARC database architecture has at least one corresponding criterion and each criterion has at least one associated software measure. Next, we present the names of the selected criteria together with their corresponding level.
1. External level: Complexity of queries, Access control. 2. Conceptual level: Schema size, Integrity constraints.
3. Internal level: Performance of data manipulation operations, Data size, Concurrency control.
We stress that the proposed criteria are not the only possible criteria to evaluate ORSQL database designs.
Next, we describe for each level its associated criteria and introduce the software measures that we will use to evaluate database designs in terms of these criteria. In case of each selected measure m – the smaller is the
measurement result in case of an alternative a, the better is a in the context of the criterion that is associated with m.
In this paper “small number of entities” means between two and five (endpoints included) and “large number of entities” means more than five.
External level. Complexity of queries. At the external level different views on a database are specified. One has to form queries to create views and hence the complexity of these queries is very important criterion at the external level. It is possible to represent queries as graphs where nodes are table aliases and arcs represent join and semijoin operations [27]. We evaluate the complexity of queries by calculating Coefficient of Network Complexity CNC=(A×A)/N where N is the number of nodes and A is the
number of arcs [15]. We decided to find the total complexity of three different types of queries: 1) query that finds data about one entity, 2) query that aggregates data about small number of entities, and 3) query that aggregates data about large number of entities. The total complexity of a set of queries Q is the sum of complexities of queries that belong to Q. We decided to calculate the total complexity to avoid the distortion of the results that is caused by the selection of queries that favor one or another design.
1. Complexity of granting SELECT privileges to all the columns that correspond to attributes of one entity type in a conceptual data model. 2. Complexity of granting SELECT privileges to the columns that correspond
to a proper subset of attributes of one entity type in a conceptual data model.
The style of writing code influences the count of physical lines. Therefore, we have to follow rules to format the code. For instance, we follow the rules that FROM and WHERE clauses start from a new line in case of a SELECT statement and the lines of code cannot be longer than 60 symbols.
Conceptual level. Schema size. We use software measure Schema Size to evaluate the designs in terms of schema size criterion. We assume that smaller Schema Size value means simpler database structure and hence better maintainability of the database. Piattini et al. [19] define Schema Size measure "as the sum of the tables size (TS) in the schema" [19, p. 7] and Table Size measure "as the sum of the total size of the simple columns (TSSC) and the total size of the complex columns" [19, p. 6]. The size of each simple column is one. All the columns are simple columns in case of the designs in this evaluation. Therefore, in this case Table Size of a base table T is equal to the total number of columns in T.
Integrity constraints. Each type of integrity constraints in SQL databases has a corresponding sub-criterion of criterion "Integrity constraints" in our hierarchical decision model. Some of these sub-criteria have additional sub-criteria.
1. Complexity of enforcing CHECK constraints. The sub-criteria:
1) Complexity of enforcing constraints that involve one attribute of one entity type and 2) Complexity of enforcing constraints that involve more than one attribute of one entity type.
2. Complexity of enforcing UNIQUE constraints. 3. Complexity of enforcing NOT NULL constraints.
4. Complexity of enforcing FOREIGN KEY constraints. The sub-criteria: 1) Number of Foreign Keys (NFK), 2) Referential Degree (RD), and 3) Depth of Referential Tree (DRT).
In case of CHECK, UNIQUE, and NOT NULL constraints, we count the physical lines of source code that are needed to implement these constraints. In case of foreign key constraints, we use three schema level measures for evaluating object-relational database designs. Measure NFK is the number of foreign keys in the database schema [1]. Measure RD is the average referential degree over all the base tables. Baroni et al. [1, p. 34] define RD measure of a single table as "number of foreign keys in a table divided by the number of attributes of the same table". Measure DRT is defined as the longest referential path between tables in the database schema [19].
Internal level. Performance of data manipulation operations (Performance of operations in short). Criterion "Performance of data manipulation operations" has five sub-criteria in our evaluation. They correspond to different types of operations that one could perform in a database.
2. Performance of a query that aggregates data about a small number of entities.
3. Performance of a query that aggregates data about a large number of entities.
4. Performance of an operation for inserting data about one entity to a database.
5. Performance of an operation for modifying data about a small number of entities.
We measure performance in milliseconds. In case of each pair of a design and a sub-criterion, we perform the same task repeatedly and calculate median of the results.
Data size. The criterion "Data size" has two sub-criteria in our evaluation. 1. Size of base tables.
2. Size of indexes.
We measure the size by using PostgreSQL™ system-defined function
pg_relation_size. The function has one parameter, the expected value of which is the name of a base table or an index. The function returns the size of the base table or index in bytes.
Concurrency control. Criterion "Concurrency control" allows us to evaluate how much effort is needed for locking data in a database to prevent concurrent data changes that cause inconsistency of data. We perform the task of changing attribute values of one entity to evaluate designs in terms of "Concurrency control". We count the physical lines of source code that are needed to implement the locking of data of one entity.
4.4. Implementation of Databases and Generation of Test Data
We implemented all the designs in different schemas of a PostgreSQL™ 8.3.6 database to prevent name conflicts of schema objects. Firstly, we created user-defined functions for generating test data to the tables of the regular design: Customer (30000), Order_ (30000), Order_line (300008), and Stock
(10000). In the brackets is the number of generated rows for a particular table. For all the tables, except Stock, we generated the same amount of test data
as required in the TPC BENCHMARK™ C document [28]. For table Stock, we
generated 10 times less data than was required in the document. TPC BENCHMARK™ C document also presents additional requirements to data that we took into account. Each warehouse must provide services to 10 districts and each district must have 3000 customers. If there is one warehouse, then there must be 1×10×3000 customers. Each customer must have one or more orders and each order must have between 5 and 15 (endpoints included) order lines. For each order, we randomly found the number of order lines by taking into account the constraint.
One can download the files with the statements that can be used to create the test database and generate test data from the following address:
http://staff.ttu.ee/~eessaar/files/Db_designs.zip
The computer, where we performed the experiments, had the following characteristics: Intel Core 2, T5600 1.83GHz, 2GB RAM, Windows XP Professional.
4.5. Relative Importance of Criteria
One can make some assumptions about the relative importance of the criteria by considering the contexts.
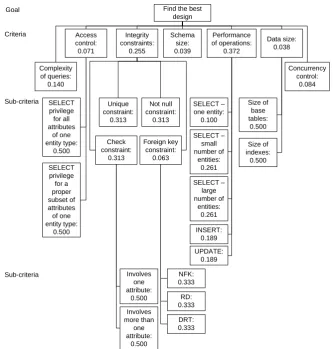
Find the best design Schema size: 0.039 Complexity of queries: 0.140 Integrity constraints: 0.255 Access control: 0.071 Performance of operations: 0.372 Data size: 0.038 Concurrency control: 0.084 Goal Criteria Unique constraint: 0.313 Not null constraint: 0.313 Foreign key constraint: 0.063 Check constraint: 0.313 Sub-criteria SELECT privilege for all attributes of one entity type: 0.500 SELECT privilege for a proper subset of attributes of one entity type: 0.500 INSERT: 0.189 SELECT – one entity: 0.100 SELECT – large number of entities: 0.261 SELECT – small number of entities: 0.261 UPDATE: 0.189 Size of base tables: 0.500 Size of indexes: 0.500 Sub-criteria RD: 0.333 NFK: 0.333 DRT: 0.333 Involves more than one attribute: 0.500 Involves one attribute: 0.500
1. Access control is more important in case of context 2 due to the requirements to confidentiality.
2. Statistical queries are more important in case of context 1. On the other hand, queries that help users to find information about a particular entity are more important in case of context 2.
3. Integrity constraints are more important in case of context 1 due to the need to prevent registration of seemingly incorrect data.
4. Performance of data manipulation operations is more important in case of
context 2 due to the requirements to availability.
5. Concurrency control is more important in case of context 2 due to the large number of concurrent users.
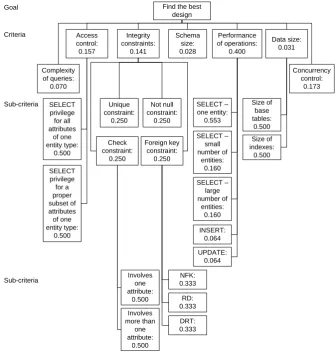
We calculated the relative importance (weights) of the criteria in case of
context 1 (see Fig. 7) and context 2 (see Fig. 8) by comparing criteria pairwise in terms of the context.
Find the best design Schema size: 0.028 Complexity of queries: 0.070 Integrity constraints: 0.141 Access control: 0.157 Performance of operations: 0.400 Data size: 0.031 Concurrency control: 0.173 Goal Criteria Unique constraint: 0.250 Not null constraint: 0.250 Foreign key constraint: 0.250 Check constraint: 0.250 Sub-criteria SELECT privilege for all attributes of one entity type: 0.500 SELECT privilege for a proper subset of attributes of one entity type:
0.500 INSERT:0.064
SELECT – one entity: 0.553 SELECT – large number of entities: 0.160 SELECT – small number of entities: 0.160 UPDATE: 0.064 Size of base tables: 0.500 Size of indexes: 0.500 Sub-criteria RD: 0.333 NFK: 0.333 DRT: 0.333 Involves more than one attribute: 0.500 Involves one attribute: 0.500
The pairwise comparison of criteria was performed by one expert. However, the proposed method does no rule out the use of more than one expert.
4.6. Evaluation of Alternatives in Terms of Criteria
In this section, we present the results of measurements that we performed to compare database designs. We present the results of measurements for all the criteria because they are needed to fully understand the final results of the study and they give detailed numerical information about the properties of the selected designs. We also explain the tasks, based on which we performed the measurements. In case of access control criterion, we present AHP comparison matrices that we created based on the measurement results. The proposed method requires the creation of such matrices in case of all the criteria but we present only some to illustrate their use.
We also performed consistency analysis of all the comparison matrices by calculating their consistency ratio. The ratio was always less than 0.10 that is positive evidence for informed judgment [21].
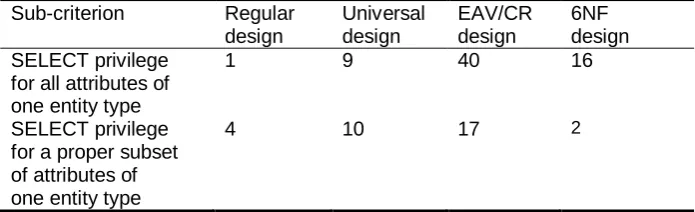
Access control. Table 1 presents the results of measurements in case of access control. We performed two tasks to evaluate the access control. 1. SELECT privilege for all attributes of one entity type. The task was to grant
to role role1 a SELECT privilege for reading data that corresponds to entity type Stock.
2. SELECT privilege for a proper subset of attributes of one entity type. The task was to grant to role role1 a SELECT privilege for reading data that corresponds to attributes C_LAST, C_ID, C_W_ID, and C_D_ID of entity type Stock.
We counted the physical lines of code that were needed to implement the access control based on the requirements that were specified in the tasks.
Table 1. Measurement results in case of access control criterion (physical lines of code)
Sub-criterion Regular
design
Universal design
EAV/CR design
6NF design SELECT privilege
for all attributes of one entity type
1 9 40 16
SELECT privilege for a proper subset of attributes of one entity type
4 10 17 2
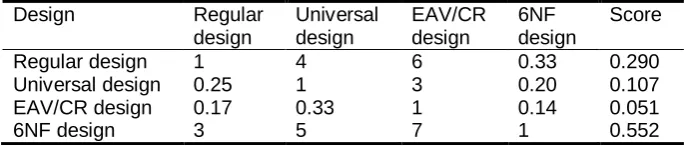
attributes of one entity type" according to Table 2. The higher is the score (column Score), the better is the design in terms of this criterion. The regular design is the best in case of sub-criterion "SELECT privilege for all attributes of one entity type" because it is possible to grant access by using one GRANT statement. In case of the 6NF design one has to use multiple grant statements and in case of the universal design and the EAV/CR design one firstly has to create views and then to grant SELECT privileges based on the views. The 6NF design is the best in case of sub-criterion "SELECT privilege for a proper subset of attributes of one entity type" because each attribute has a corresponding table. Therefore, one has to use as many GRANT statements as there are attributes in the subset. In case of other designs it is necessary to create views and to grant SELECT privileges based on the views.
Table 2. The results of pairwise comparison of designs in terms of granting SELECT privilege for all attributes of one entity type
Design Regular
design
Universal design
EAV/CR design
6NF design
Score
Regular design 1 5 8 6 0.636
Universal design 0.20 1 5 3 0.213
EAV/CR design 0.13 0.20 1 0.33 0.049
6NF design 0.17 0.33 3 1 0.103
Table 3. The results of pairwise comparison of designs in terms of granting SELECT privilege for a proper subset of attributes of one entity type
Design Regular
design
Universal design
EAV/CR design
6NF design
Score
Regular design 1 4 6 0.33 0.290
Universal design 0.25 1 3 0.20 0.107
EAV/CR design 0.17 0.33 1 0.14 0.051
6NF design 3 5 7 1 0.552
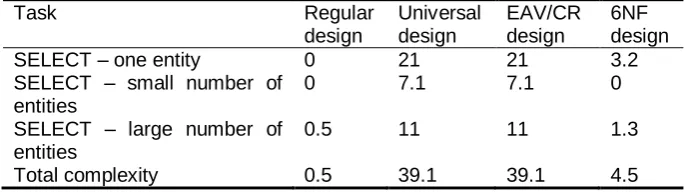
Complexity of queries. Table 4 presents the results of measurements in case of complexity of queries. We found the total complexity of three queries. The task has three subtasks.
1. SELECT – one entity. The task was to create query "Find all the data about an order, the identifier of which is 4, the associated warehouse of which has identifier 1, and the associated district of which has identifier 5".
2. SELECT – small number of entities. The task was to create query "Find the number of customers who have the last name BARCALLYESE, who use warehouse, the identifier of which is 1, and who are in district, the identifier of which is 7".
identifiers of which are between 2981 and 3001. In addition, the query must only consider stocks that 1) are associated with warehouse, the identifier of which is 1 and 2) that are associated with district, the identifier of which is 5".
Table 4. Measurement results in case of complexity of queries criterion (Coefficient of Network Complexity)
Task Regular
design
Universal design
EAV/CR design
6NF design
SELECT – one entity 0 21 21 3.2
SELECT – small number of entities
0 7.1 7.1 0
SELECT – large number of entities
0.5 11 11 1.3
Total complexity 0.5 39.1 39.1 4.5
In case of the regular design, we have to perform the smallest number of join and semijoin operations and therefore this design is the best in terms of this criterion.
Schema size. Table 5 presents the results of measurements in case of schema size. The schema size depends strongly on the context in case of the regular design and the 6NF design. On the other hand, the schema size of the universal design and the EAV/CR design changes only if database developers decide to change the set of data types, the corresponding values of which can be recorded in the database as attribute values. One has to note that this decision may depend on the context too.
Table 5. Measurement results in case of schema size criterion
Regular design Universal design EAV/CR design 6NF design
56 24 60 174
Integrity constraints. Table 6 presents the results of measurements in case of integrity constraints. Firstly, we calculated the number of foreign keys (NFK), referential degree (RD), and depth of referential tree (DRT). We performed two tasks to evaluate designs in terms of CHECK constraints. 1. CHECK (involves one attribute). The task was to implement constraint
"Credit check of each customer must be GC or BC".
2. CHECK (involves more than one attribute). The task was to implement constraint "Each order must satisfy the condition S_REMOTE_CNT <= S_ORDER_CNT".
physical lines of code that were needed to implement the constraints that were specified in the tasks.
For instance, in case of NOT NULL constraint the best design is the regular design because one can implement the integrity constraint by creating a declarative NOT NULL constraint. In case of other designs one has to use complex trigger procedures.
Table 6. Measurement results in case of integrity constraints criterion
Sub-criterion Regular
design
Universal design
EAV/CR design
6NF design
NFK 3 6 24 45
RD 0.08 0.30 0.39 0.26
DRT 3 3 3 3
CHECK (involves one attribute)
3 27 27 3
CHECK (involves more than one attribute)
3 71 65 42
UNIQUE 2 9 9 2
NOT NULL 2 102 101 73
Performance of data manipulation operations. Table 7 presents the results of measurements of performance of data manipulation operations (in milliseconds). We performed five tasks to evaluate the performance. The first three tasks were the same as in case of complexity of queries. In addition, we performed two tasks to measure the performance of database operations that modify data in a database: 1) insert a new order to the database (a new
Order_ entity) and 2) update the quantity of a stock, the identifier of which is 1, and that is in a warehouse, the identifier of which is 1.
Data size. Table 8 presents the results of measurements of data size. We found the size of base tables and indexes (in megabytes) in a test database. PostgreSQL™ creates automatically an index based on each primary key. We also created additional indexes on foreign keys if the corresponding columns where not indexed due to the primary key constraint. The regular design is the best in case of both sub-criterion.
Table 7. Measurement results in case of performance of data manipulation operations criterion (in milliseconds)
Sub-criterion Regular
design
Universal design
EAV/CR design
6NF design
SELECT – one entity 0.137 15046.219 14877.789 0.395
SELECT – small number of entities
79.474 3751.741 974.636 11.843
SELECT – large number of entities
213.064 4286.012 4086.631 339.235
INSERT 26.828 460.726 160.427 95.409
Table 8. Measurement results in case of data size criterion (in megabytes)
Sub-criterion Regular
design
Universal design
EAV/CR design
6NF design
Size of base tables 53 296 264 148
Size of indexes 18 288 288 87
Concurrency control. Table 9 presents the results of measurements in case of concurrency control. The task was to lock all the data that corresponds to one entity that has type Stock to modify the data and to prevent concurrent modification of the data. We counted the physical lines of code that were needed to implement the concurrency control task. The best design is the regular design because all the data about an entity is in one row and UPDATE statement automatically locks the entire row. In case of other designs, we had to lock data in more than one row by using explicit SELECT ... FOR UPDATE statements for that purpose. The 6NF design got the worst result due to the number of different tables that contain data about one entity.
Table 9. Measurement results in case of concurrency control criterion (physical lines of code)
Regular design Universal design EAV/CR design 6NF design
0 23 23 49
4.7. The Results of the Comparison
Table 10 and Table 11 summarize the results of evaluation of four designs.
Table 10. The results of evaluation of designs in case of context 1
Design/ Criterion
Regular design
Universal design
EAV/CR design
6NF design
Complexity of queries 0.0879 0.0087 0.0087 0.0348
Access control 0.0330 0.0114 0.0036 0.0234
Schema size 0.0086 0.0223 0.0061 0.0019
Integrity constraints 0.1411 0.0228 0.0215 0.0700
Performance of operations 0.1584 0.0173 0.0312 0.1654
Data size 0.0241 0.0026 0.0032 0.0080
Concurrency control 0.0490 0.0146 0.0146 0.0058
Relative goodness of a design
0.5021 0.0998 0.0889 0.3092
and Table 3, respectively). Therefore, the score of the regular design in case of access control in context 1 is (0.636×0.500 + 0.290×0.500)×0.071= 0.0330.
Table 11. The results of evaluation of designs in case of context 2
Design/ Criterion
Regular design
Universal design
EAV/CR design
6NF design
Complexity of queries 0.0440 0.0044 0.0044 0.0174
Access control 0.0725 0.0251 0.0079 0.0513
Schema size 0.0061 0.0158 0.0043 0.0013
Integrity constraints 0.0751 0.0166 0.0136 0.0359
Performance of operations 0.1893 0.0177 0.0280 0.1652
Data size 0.0200 0.0022 0.0026 0.0067
Concurrency control 0.1008 0.0300 0.0300 0.0119
Relative goodness of a design
0.5078 0.1117 0.0908 0.2897
Last rows of Table 10 and Table 11 present the final scores of designs in case of different contexts (row Relative goodness of a design). We found them by summarizing the scores of alternatives in case of each design. The bigger is the final score, the better is the design in terms of the goal.
5.
Conclusions
Often it is possible to use more than one database design to solve the same problem. Therefore, there should be a way to evaluate the suitability of designs.
In this work, we proposed a systematic and structured decision support method, which is based on the Analytic Hierarchy Process. It enables us to compare different database designs against each other while taking into account the requirements for the database. The comparison is based on the results of measurements.
We presented a case study of evaluating four designs of SQL databases to prove the usefulness of the proposed method. We compared the regular design, the universal design, the entity-attribute-value with classes and relationships (EAV/CR) design, and the sixth normal form (6NF) design in case of PostgreSQL™ DBMS 8.3.6 based on two quite different contexts. One of the contexts describes a scientific information system for managing the results of measurements. Another context describes a typical online transaction processing system. We found the relative goodness of each database design for both contexts. The goal of the case study was to demonstrate the use of the method and not to make absolute conclusions about the goodness of the designs. Although in case of both contexts the best was the regular design it is possible that the results could be different in case of different contexts, criteria, measures, tasks, solutions, or alternatives.
An important property of the proposed method is its flexibility – it can be used in case of different data models, criteria, and alternatives.
Additional results of our work are a set of possible criteria that one can use to evaluate the designs of SQL databases. We also found software measures that correspond to the criteria. It is possible to reuse all of that during the future evaluations of SQL database designs.
On the basis of the results it is concluded that the proposed method can be effectively used to evaluate database designs.
Future work must include more empirical studies about the use of the proposed method. It is necessary to use it in case of various data models and database designs. For example, one could create some designs that are like the first and most probable regular design, but with some common design mistakes. After that one could evaluate the method by comparing the regular design with the set of newly created designs.
References
1. Baroni, A.L., Calero, C., Abreu, F.B., Piattini, M.: Object-Relational Database Metrics Formalization. In Proceedings of the Sixth International Conference on Quality Software. IEEE Computer Society, Beijing, China, 30-37. (2006)
2. Behkamal, B., Kahani, M., Akbari, M.K.: Customizing ISO 9126 Quality Model for Evaluation of B2B Applications. Information and Software Technology, Vol. 51, No. 3, 599-609. (2009)
3. Blaha, M.: Patterns of Data Modeling. CRC Press, Boca Raton London New York. (2010)
4. Chaudhuri S., Narasayya, V.: Self-Tuning Database Systems: A Decade of Progress. In Proceedings of the 33rd International Conference on Very Large Data Bases. ACM, University of Vienna, Austria, 3-14. (2007)
5. Chen, R.S., Nadkarni, P., Marenco, L., Levin, F., Erdos, J., Miller, P.L.: Exploring Performance Issues for a Clinical Database Organized Using an Entity-Attribute-Value Representation. Journal of the American Medical Informatics Association, Vol. 7, No. 5, 475-487. (2000)
6. Date, C.J.: An Introduction to Database Systems (8th ed.). Pearson/Addison Wesley, Boston. (2003)
7. Date, C.J.: The Relational Database Dictionary. A comprehensive glossary of relational terms and concepts, with illustrative examples. O'Reilly, USA. (2006) 8. Date, C.J.: SQL and Relational Theory. How to Write Accurate SQL Code.
O'Reilly, USA. (2009)
9. Date, C.J., Darwen, H., Lorentzos, N.A.: Temporal Data and the Relational Model. Morgan Kaufmann, USA. (2003)
10. Date, C.J., McGoveran, D.: The Principle of Orthogonal Design. Database Programming & Design, Vol. 7, No. 6. (1994)
11. Eessaar E., Soobik, M.: A Comparison of the Universal and the Regular Database Design. In: Haav, H.-M., Kalja, A. (eds.): Databases and Information Systems V - Selected Papers from the Eighth International Baltic Conference, DB&IS 2008. Frontiers in Artificial Intelligence and Applications, Vol. 187. IOS Press, Amsterdam Berlin Oxford Tokyo Washington, DC, 289-300. (2009)
12. Feuerlicht, G., Pokorný, J., Richta, K.: Object-Relational Database Design: Can Your Application Benefit from SQL:2003? In: Barry, C., Conboy, K., Lang, M., Wojtkowski, G., Wojtkowski, W. (eds.): Information Systems Development: Challenges in Practice, Theory, and Education, Vol. 2. Springer US, 975-987. (2009)
13. Forman, E.H., Selly, M.A.: Decision by Objectives. World Scientific Publishing Company. (2002)
14. Hay, D.C.: Data Model Patterns: Conventions of Thought. Dorset House Pub, New York. (1996)
15. Latva-Koivisto, A.M.: Finding a Complexity Measure for Business Process Models. Research Report. Helsinki University of Technology, Systems Analysis Laboratory, Finland. (2001)
16. March, S.T.: Techniques for Structuring Database Records. ACM Computing Surveys, Vol. 15, No. 1, 45-79. (1983)
17. Melton, J.: ISO/IEC 9075-2:2003 (E) Information technology – Database languages – SQL – Part 2: Foundation (SQL/Foundation), Aug. 2003. [Online]. Available: http://www.wiscorp.com/SQLStandards.html (current December 2004) 18. Park, K.S., Lim, C.H.: A Structured Methodology for Comparative Evaluation of
19. Piattini, M., Calero, C., Sahraoui, H., Lounis, H.: Object-Relational Database Metrics. L'Object, vol. March 2001.
20. PostgreSQL. The world's most advanced open source database. [Online]. Available: http://www.postgresql.com (current September 2010)
21. Saaty, T.L.: How to Make a Decision: The Analytic Hierarchy Process. Interfaces, Vol. 24, No. 6, 19-43. (1994)
22. Simsion, G.: Data Modeling. Theory and Practice. Technics Publication, LLC, New Jersey. (2007)
23. Soutou, C.: Modeling Relationships in Object-Relational Databases. Data & Knowledge Engineering, Vol. 36, No. 1, 79-107. (2001)
24. Svahnberg, M., Wohlin, C., Lundberg, L., Mattsson, M.: A Quality-Driven Decision Support Method for Identifying Software Architecture Candidates. International Journal of Software Engineering and Knowledge Management, Vol. 13, Part 5, 547-573. (2003)
25. Teorey, T.J., Yang, D., Fry, J.P.: A Logical Design Methodology for Relational Databases Using the Extended Entity-Relationship Model. ACM Computing Survey, Vol. 18, No. 2, 197-222. (1986)
26. Theodoratos, D., Bouzeghoub, M.: A general framework for the view selection problem for data warehouse design and evolution. In Proceedings of the 3rd ACM international Workshop on Data Warehousing and OLAP. ACM, New York, NY, 1-8. (2000)
27. Tow, D.: SQL Tuning. O'Reilly, USA. (2003)
28. TPC BENCHMARK™ C – Standard Specification, Revision 5.9, June 2007. [Online]. Available: http://www.tpc.org/tpcc/spec/tpcc_current.doc (current June 2007)
29. Vaidya O.S., Kumar, S.: Analytic Hierarchy Process: An Overview of Applications. European Journal of Operational Research, Vol. 169, No. 1, 1-29. (2006)
Erki Eessaar received the BSc and MSc degrees in informatics from Tallinn University of Techology, Estonia in 1999 and 2001, respectively. He received PhD in Engineering (in informatics) from Tallinn University of Techology, Estonia in 2006. He is currently Associate Professor in Department of Informatics in Tallinn University of Technology. He teaches courses in database design and programming of databases. His research interests are in relational- and object-relational data models, metamodeling, metamodeling systems, metadata, patterns, repositories, database design, information system design, software measures, and model-driven development.
Marek Soobik received the BS and MS degrees in informatics from Tallinn University of Techology, Estonia in 2007 and 2009, respectively. He is currently working as a software developer at itestra GmbH. His research interests are in relational- and object-relational data models, database design, and information system design.
![Fig. 3. An example of the use of the regular design (adapted from [28])](https://thumb-us.123doks.com/thumbv2/123dok_us/1179923.1620653/10.595.148.445.160.477/fig-example-use-regular-design-adapted.webp)